Calculate ROI in Turkey Real Estate – Profit Insights
Use our advanced ROI calculator to estimate rental income, investment returns, and property profitability in Turkey based on real-time market data, legal regulations, and current trends. Make smarter investment decisions with confidence.
1,042$
Average Income
695$ - 1,390$
Min Income - Max Income
565,000$
Cash Price
| Year | Annual Increase | Monthly ROI | Annual ROI |
|---|---|---|---|
| 1 |
2.21
%
|
1,042$
|
12,508$
|
| 2 |
2.99
%
|
1,407$
|
16,886$
|
| 3 |
4.03
%
|
1,900$
|
22,796$
|
| 4 |
5.45
%
|
2,565$
|
30,775$
|
| 5 |
7.35
%
|
3,462$
|
41,546$
|
| 6 |
9.93
%
|
4,674$
|
56,087$
|
| 7 |
13.40
%
|
6,310$
|
75,717$
|
| 8 |
18.09
%
|
8,518$
|
102,218$
|
| 9 |
24.42
%
|
11,500$
|
137,995$
|
| 10 |
32.97
%
|
15,524$
|
186,293$
|
682,821$ 120%
Total ROI For 10 Years
1,390$
Max Income
565,000$
Cash Price
| Year | Annual Increase | Monthly ROI | Annual ROI |
|---|---|---|---|
| 1 |
2.95
%
|
1,390$
|
16,678$
|
| 2 |
3.98
%
|
1,876$
|
22,515$
|
| 3 |
5.38
%
|
2,533$
|
30,395$
|
| 4 |
7.26
%
|
3,419$
|
41,033$
|
| 5 |
9.80
%
|
4,616$
|
55,394$
|
| 6 |
13.24
%
|
6,232$
|
74,782$
|
| 7 |
17.87
%
|
8,413$
|
100,956$
|
| 8 |
24.12
%
|
11,358$
|
136,291$
|
| 9 |
32.57
%
|
15,333$
|
183,993$
|
| 10 |
43.96
%
|
20,699$
|
248,390$
|
910,428$ 161%
Total ROI For 10 Years
695$
Min Income
565,000$
Cash Price
| Year | Annual Increase | Monthly ROI | Annual ROI |
|---|---|---|---|
| 1 |
1.48
%
|
695$
|
8,339$
|
| 2 |
1.99
%
|
938$
|
11,257$
|
| 3 |
2.69
%
|
1,266$
|
15,197$
|
| 4 |
3.63
%
|
1,710$
|
20,516$
|
| 5 |
4.90
%
|
2,308$
|
27,697$
|
| 6 |
6.62
%
|
3,116$
|
37,391$
|
| 7 |
8.93
%
|
4,207$
|
50,478$
|
| 8 |
12.06
%
|
5,679$
|
68,146$
|
| 9 |
16.28
%
|
7,666$
|
91,996$
|
| 10 |
21.98
%
|
10,350$
|
124,195$
|
455,214$ 80%
Total ROI For 10 Years
District Classification
Rating
a
Area map
Area Insights & Neighborhood Demographics
Population
46,343
Social Status
Married : 61%
Unmarried : 27%
area
38 Km2
District Property Price Trend (Last 5 Years)
1 Year Change
18.19%
3 Year Change
348%
5 Year Change
368%
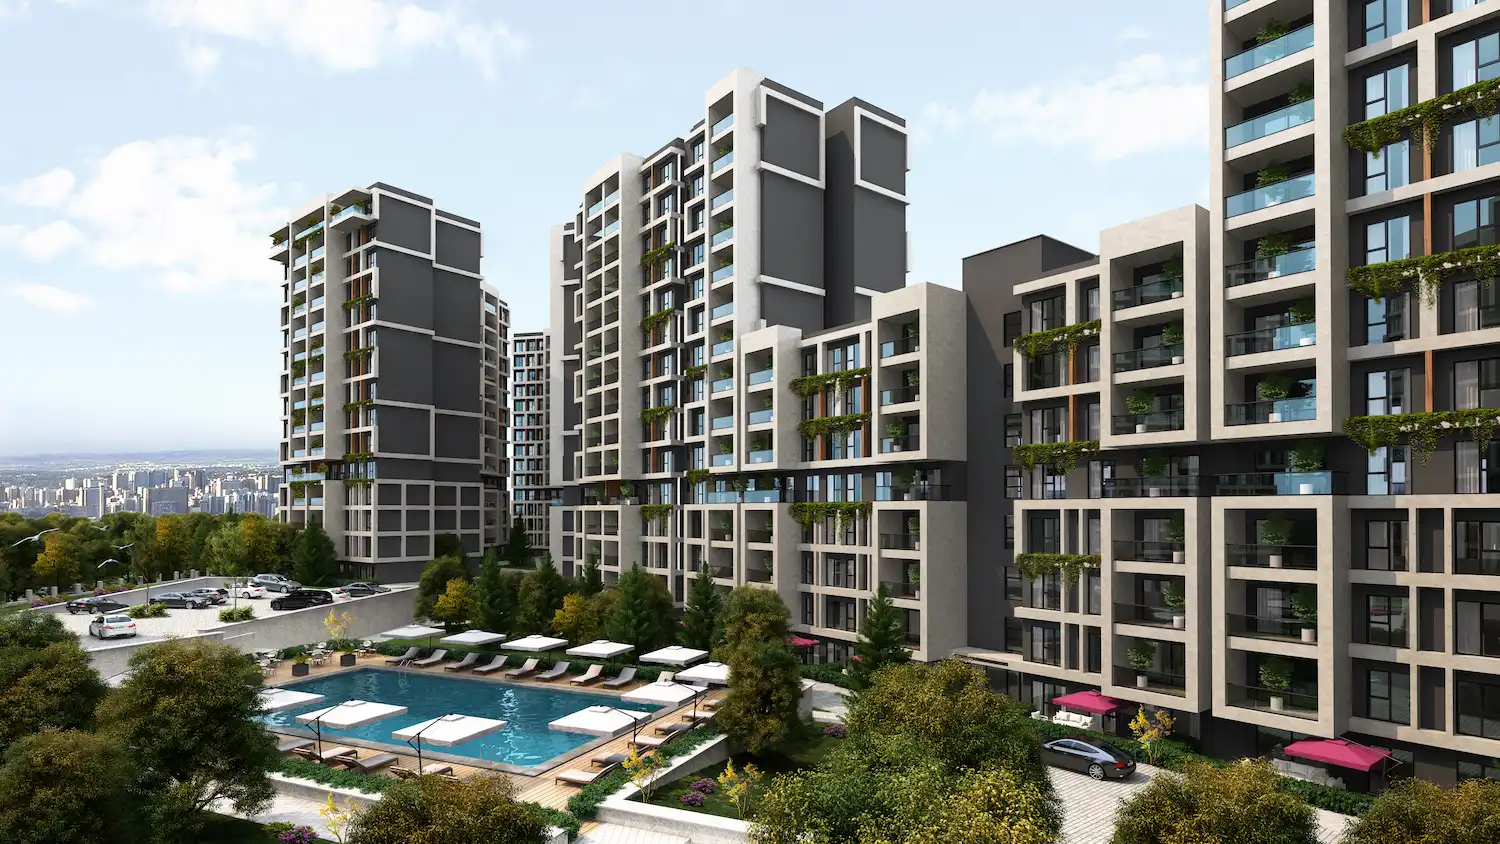
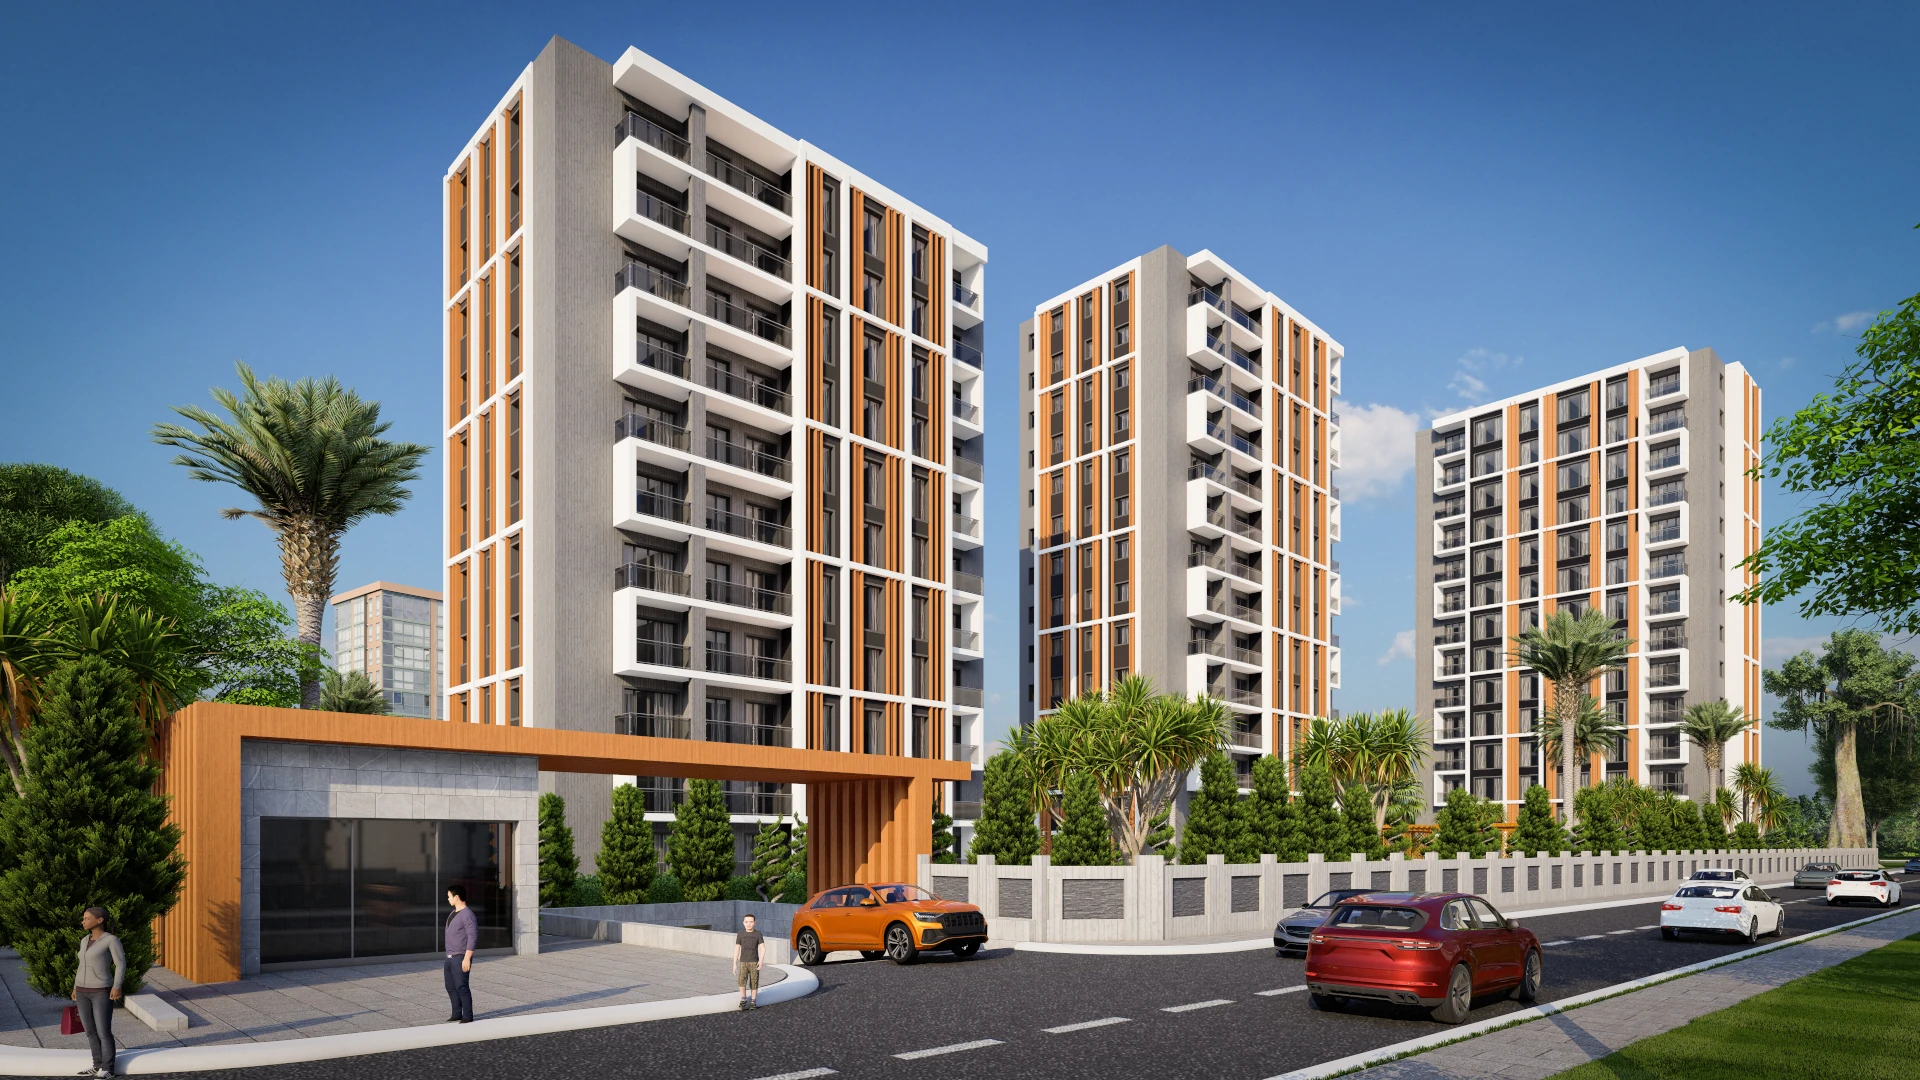
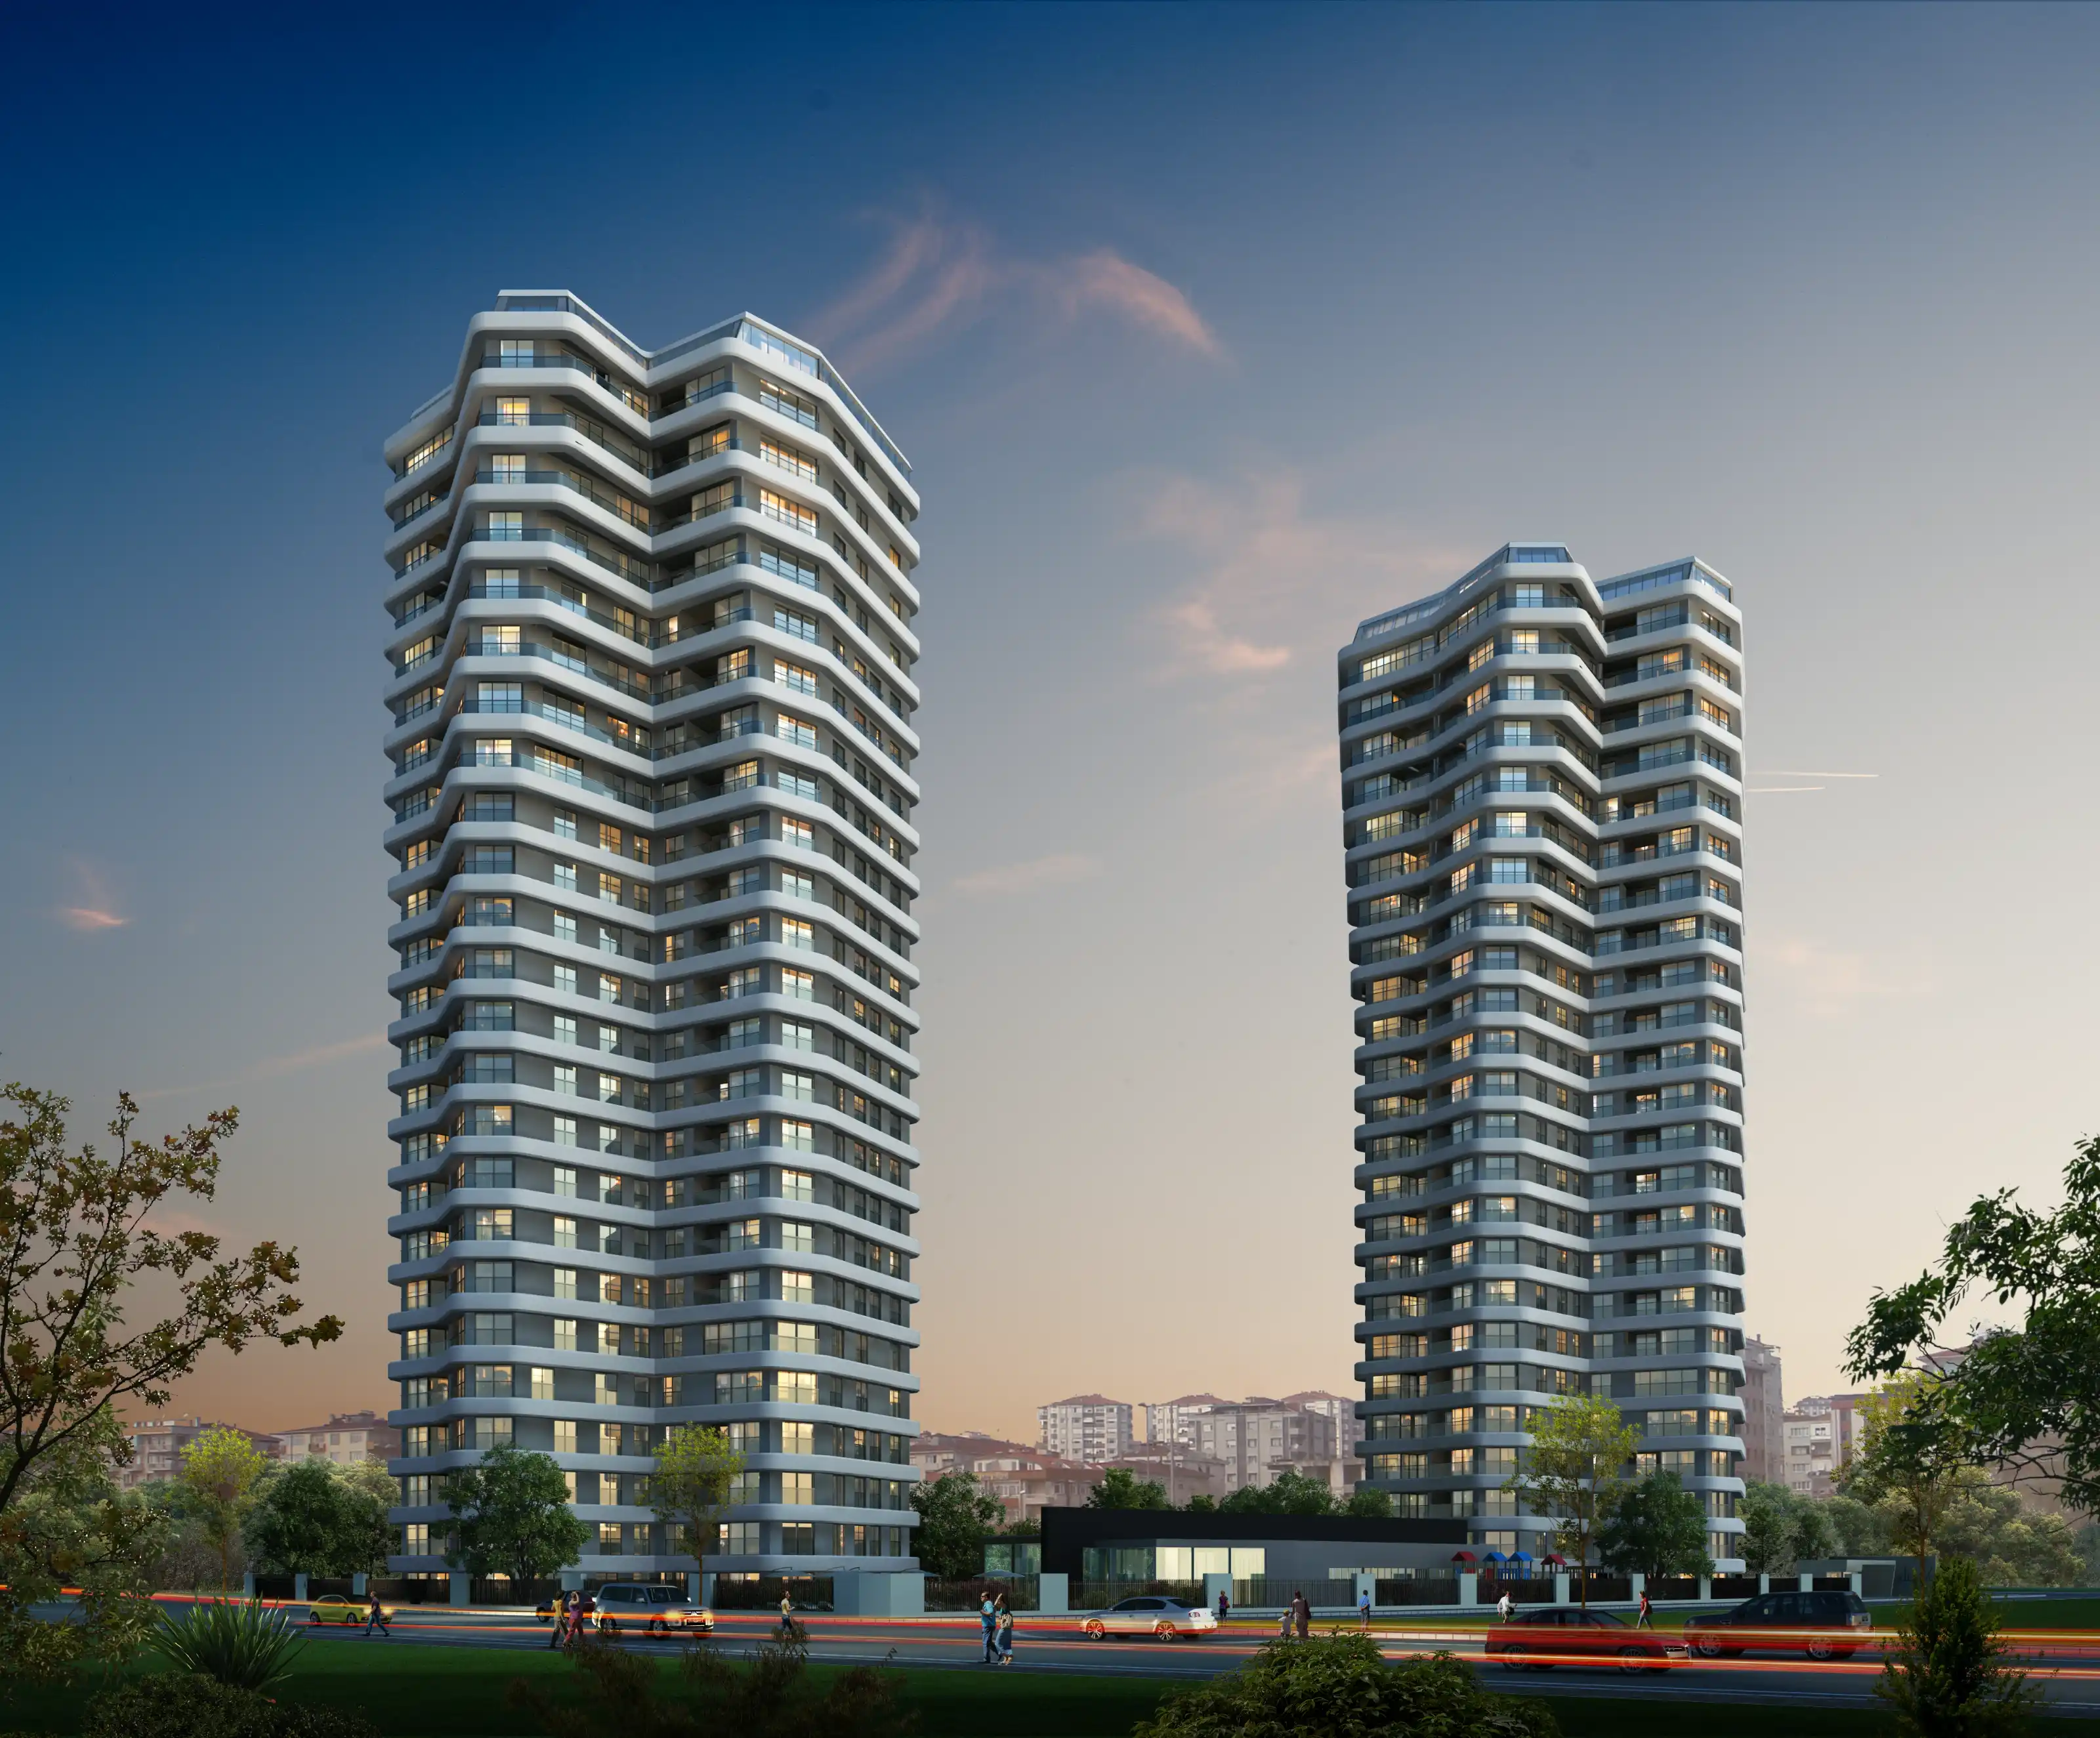
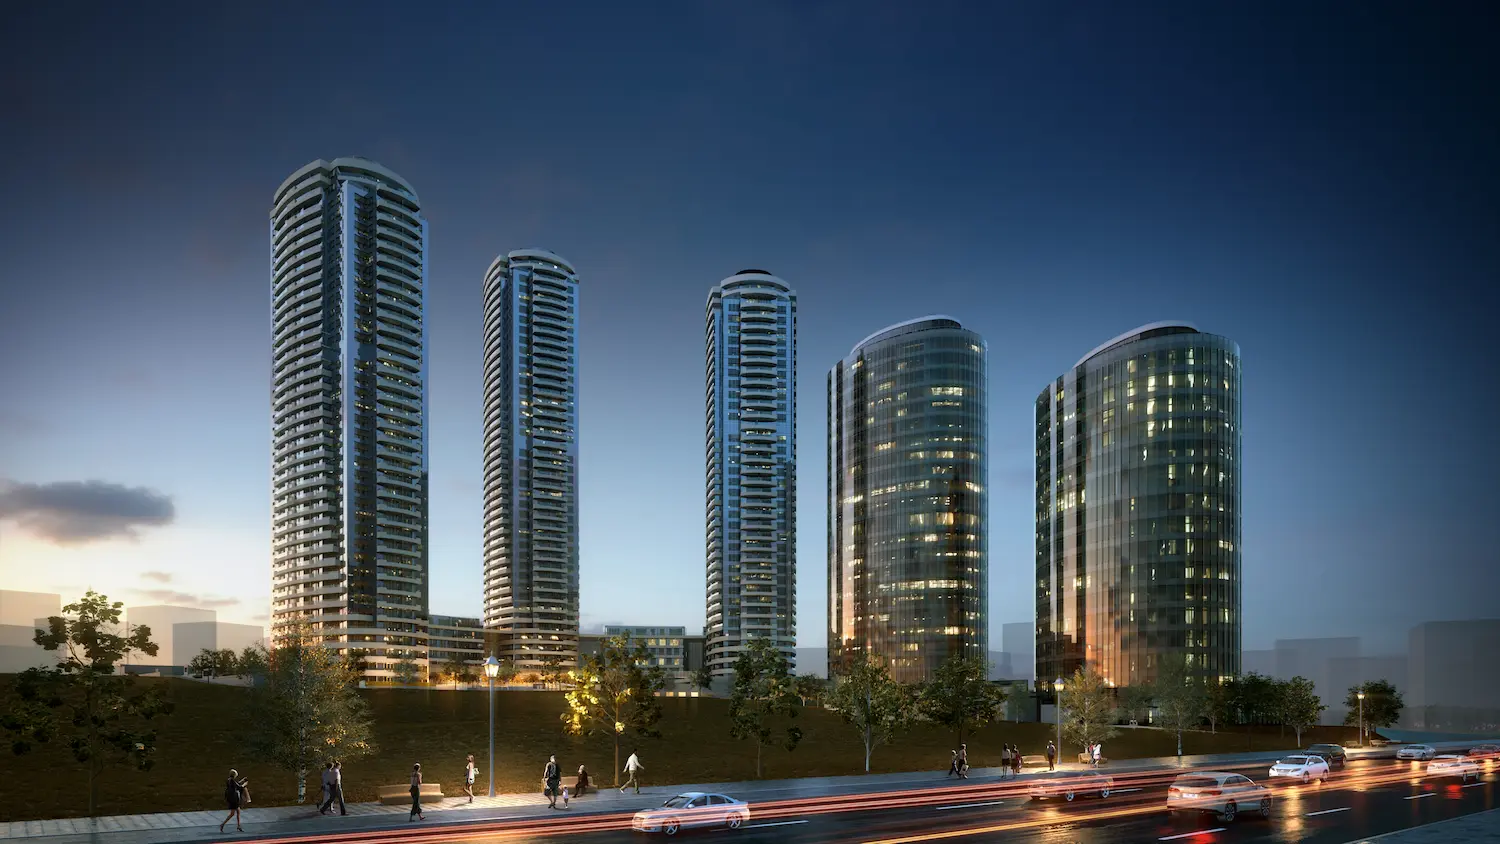
Projects Have same ROI in This Area

.webp)



Have Question Or Suggestion ?
Please Share Your Thought, To Make It Real