Calculate ROI in Turkey Real Estate – Profit Insights
Use our advanced ROI calculator to estimate rental income, investment returns, and property profitability in Turkey based on real-time market data, legal regulations, and current trends. Make smarter investment decisions with confidence.
348$
Average Income
299$ - 398$
Min Income - Max Income
0$
Cash Price
| Year | Annual Increase | Monthly ROI | Annual ROI |
|---|---|---|---|
| 1 |
0.00
%
|
348$
|
4,181$
|
| 2 |
0.00
%
|
470$
|
5,644$
|
| 3 |
0.00
%
|
635$
|
7,619$
|
| 4 |
0.00
%
|
857$
|
10,286$
|
| 5 |
0.00
%
|
1,157$
|
13,886$
|
| 6 |
0.00
%
|
1,562$
|
18,746$
|
| 7 |
0.00
%
|
2,109$
|
25,307$
|
| 8 |
0.00
%
|
2,847$
|
34,164$
|
| 9 |
0.00
%
|
3,843$
|
46,122$
|
| 10 |
0.00
%
|
5,189$
|
62,264$
|
228,217$ 0%
Total ROI For 10 Years
398$
Max Income
0$
Cash Price
| Year | Annual Increase | Monthly ROI | Annual ROI |
|---|---|---|---|
| 1 |
0.00
%
|
398$
|
4,778$
|
| 2 |
0.00
%
|
538$
|
6,450$
|
| 3 |
0.00
%
|
726$
|
8,708$
|
| 4 |
0.00
%
|
980$
|
11,755$
|
| 5 |
0.00
%
|
1,322$
|
15,869$
|
| 6 |
0.00
%
|
1,785$
|
21,424$
|
| 7 |
0.00
%
|
2,410$
|
28,922$
|
| 8 |
0.00
%
|
3,254$
|
39,045$
|
| 9 |
0.00
%
|
4,393$
|
52,710$
|
| 10 |
0.00
%
|
5,930$
|
71,159$
|
260,820$ 0%
Total ROI For 10 Years
299$
Min Income
0$
Cash Price
| Year | Annual Increase | Monthly ROI | Annual ROI |
|---|---|---|---|
| 1 |
0.00
%
|
299$
|
3,583$
|
| 2 |
0.00
%
|
403$
|
4,838$
|
| 3 |
0.00
%
|
544$
|
6,531$
|
| 4 |
0.00
%
|
735$
|
8,816$
|
| 5 |
0.00
%
|
992$
|
11,902$
|
| 6 |
0.00
%
|
1,339$
|
16,068$
|
| 7 |
0.00
%
|
1,808$
|
21,692$
|
| 8 |
0.00
%
|
2,440$
|
29,284$
|
| 9 |
0.00
%
|
3,294$
|
39,533$
|
| 10 |
0.00
%
|
4,447$
|
53,369$
|
195,615$ 0%
Total ROI For 10 Years
District Classification
Rating
a+
Area map
Area Insights & Neighborhood Demographics
Population
533,570
Social Status
Married : 57%
Unmarried : 31%
area
35 Km2
District Property Price Trend (Last 5 Years)
1 Year Change
13.41%
3 Year Change
273.8%
5 Year Change
279.2%
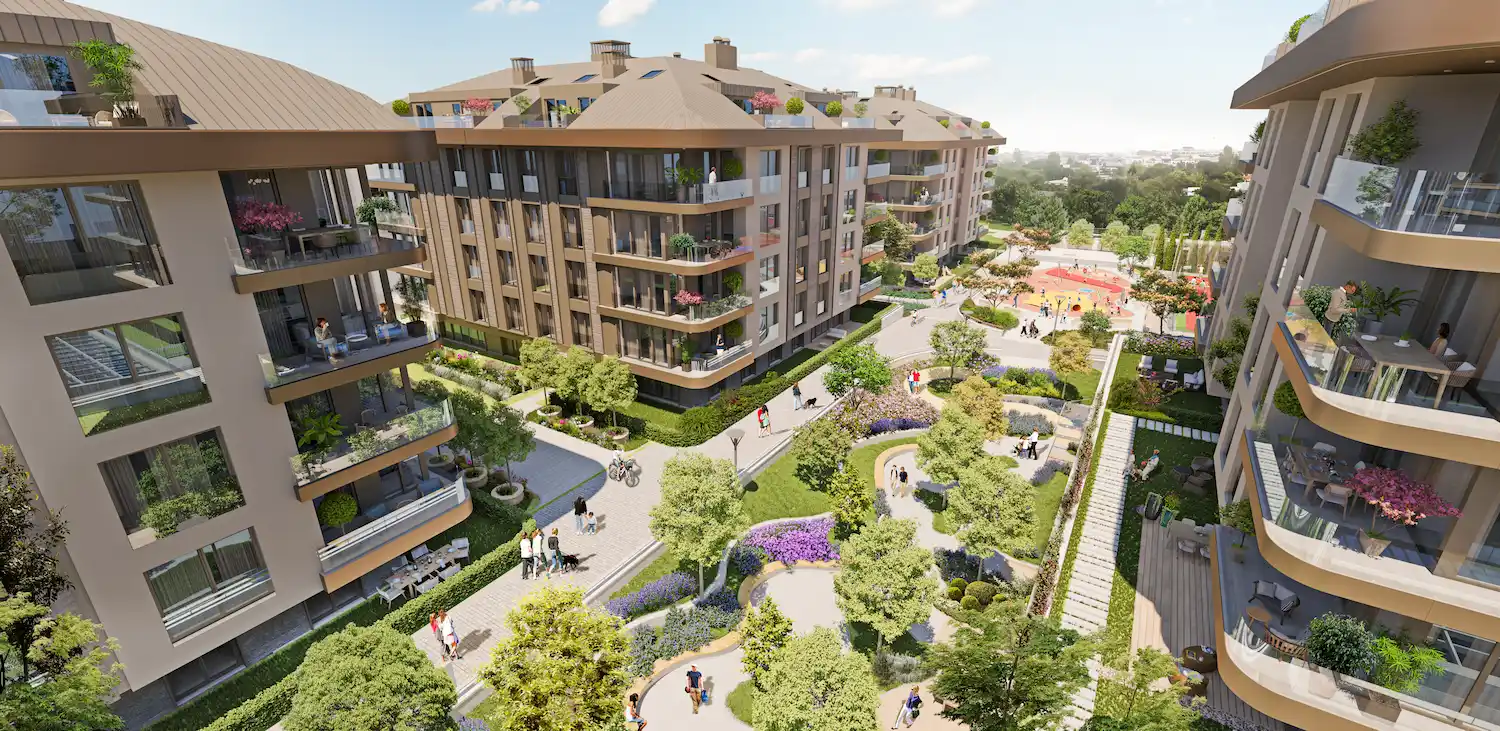
Projects Have same ROI in This Area
.webp)
.webp)
.webp)
Have Question Or Suggestion ?
Please Share Your Thought, To Make It Real