Calculate ROI in Turkey Real Estate – Profit Insights
Use our advanced ROI calculator to estimate rental income, investment returns, and property profitability in Turkey based on real-time market data, legal regulations, and current trends. Make smarter investment decisions with confidence.
2,189$
Average Income
1,393$ - 2,985$
Min Income - Max Income
1,650,000$
Cash Price
| Year | Annual Increase | Monthly ROI | Annual ROI |
|---|---|---|---|
| 1 |
1.59
%
|
2,189$
|
26,265$
|
| 2 |
2.15
%
|
2,955$
|
35,457$
|
| 3 |
2.90
%
|
3,989$
|
47,867$
|
| 4 |
3.92
%
|
5,385$
|
64,621$
|
| 5 |
5.29
%
|
7,270$
|
87,238$
|
| 6 |
7.14
%
|
9,814$
|
117,771$
|
| 7 |
9.64
%
|
13,249$
|
158,991$
|
| 8 |
13.01
%
|
17,886$
|
214,638$
|
| 9 |
17.56
%
|
24,147$
|
289,761$
|
| 10 |
23.71
%
|
32,598$
|
391,177$
|
1,433,785$ 86%
Total ROI For 10 Years
2,985$
Max Income
1,650,000$
Cash Price
| Year | Annual Increase | Monthly ROI | Annual ROI |
|---|---|---|---|
| 1 |
2.17
%
|
2,985$
|
35,815$
|
| 2 |
2.93
%
|
4,029$
|
48,351$
|
| 3 |
3.96
%
|
5,439$
|
65,273$
|
| 4 |
5.34
%
|
7,343$
|
88,119$
|
| 5 |
7.21
%
|
9,913$
|
118,961$
|
| 6 |
9.73
%
|
13,383$
|
160,597$
|
| 7 |
13.14
%
|
18,067$
|
216,806$
|
| 8 |
17.74
%
|
24,391$
|
292,688$
|
| 9 |
23.95
%
|
32,927$
|
395,128$
|
| 10 |
32.33
%
|
44,452$
|
533,423$
|
1,955,161$ 118%
Total ROI For 10 Years
1,393$
Min Income
1,650,000$
Cash Price
| Year | Annual Increase | Monthly ROI | Annual ROI |
|---|---|---|---|
| 1 |
1.01
%
|
1,393$
|
16,714$
|
| 2 |
1.37
%
|
1,880$
|
22,564$
|
| 3 |
1.85
%
|
2,538$
|
30,461$
|
| 4 |
2.49
%
|
3,427$
|
41,122$
|
| 5 |
3.36
%
|
4,626$
|
55,515$
|
| 6 |
4.54
%
|
6,245$
|
74,945$
|
| 7 |
6.13
%
|
8,431$
|
101,176$
|
| 8 |
8.28
%
|
11,382$
|
136,588$
|
| 9 |
11.18
%
|
15,366$
|
184,393$
|
| 10 |
15.09
%
|
20,744$
|
248,931$
|
912,409$ 55%
Total ROI For 10 Years
District Classification
Rating
A+
Area map
Area Insights & Neighborhood Demographics
Population
178,940
Social Status
Married : 49%
Unmarried : 33%
area
17 Km2
District Property Price Trend (Last 5 Years)
1 Year Change
12.14%
3 Year Change
257%
5 Year Change
226.9%
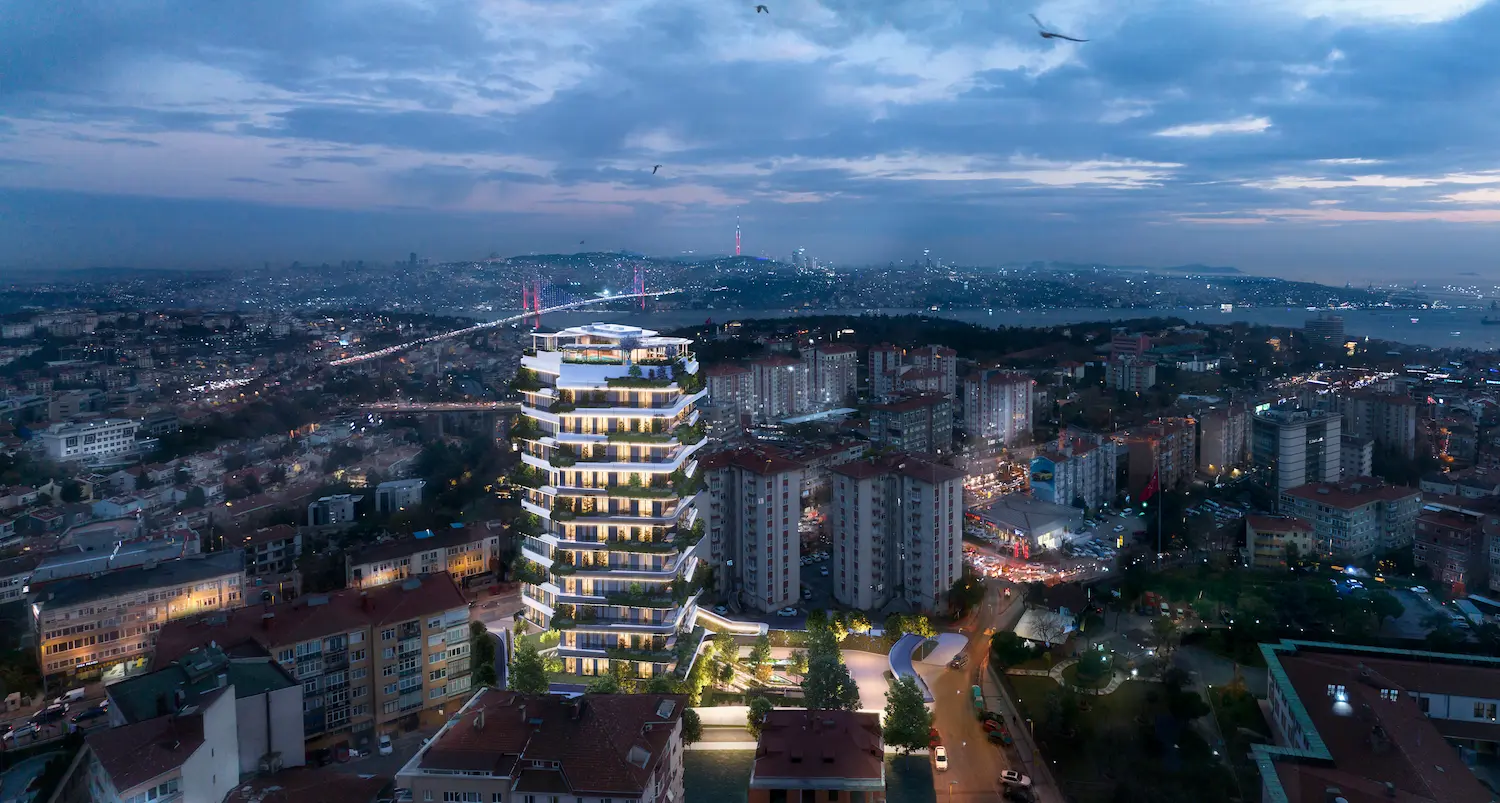
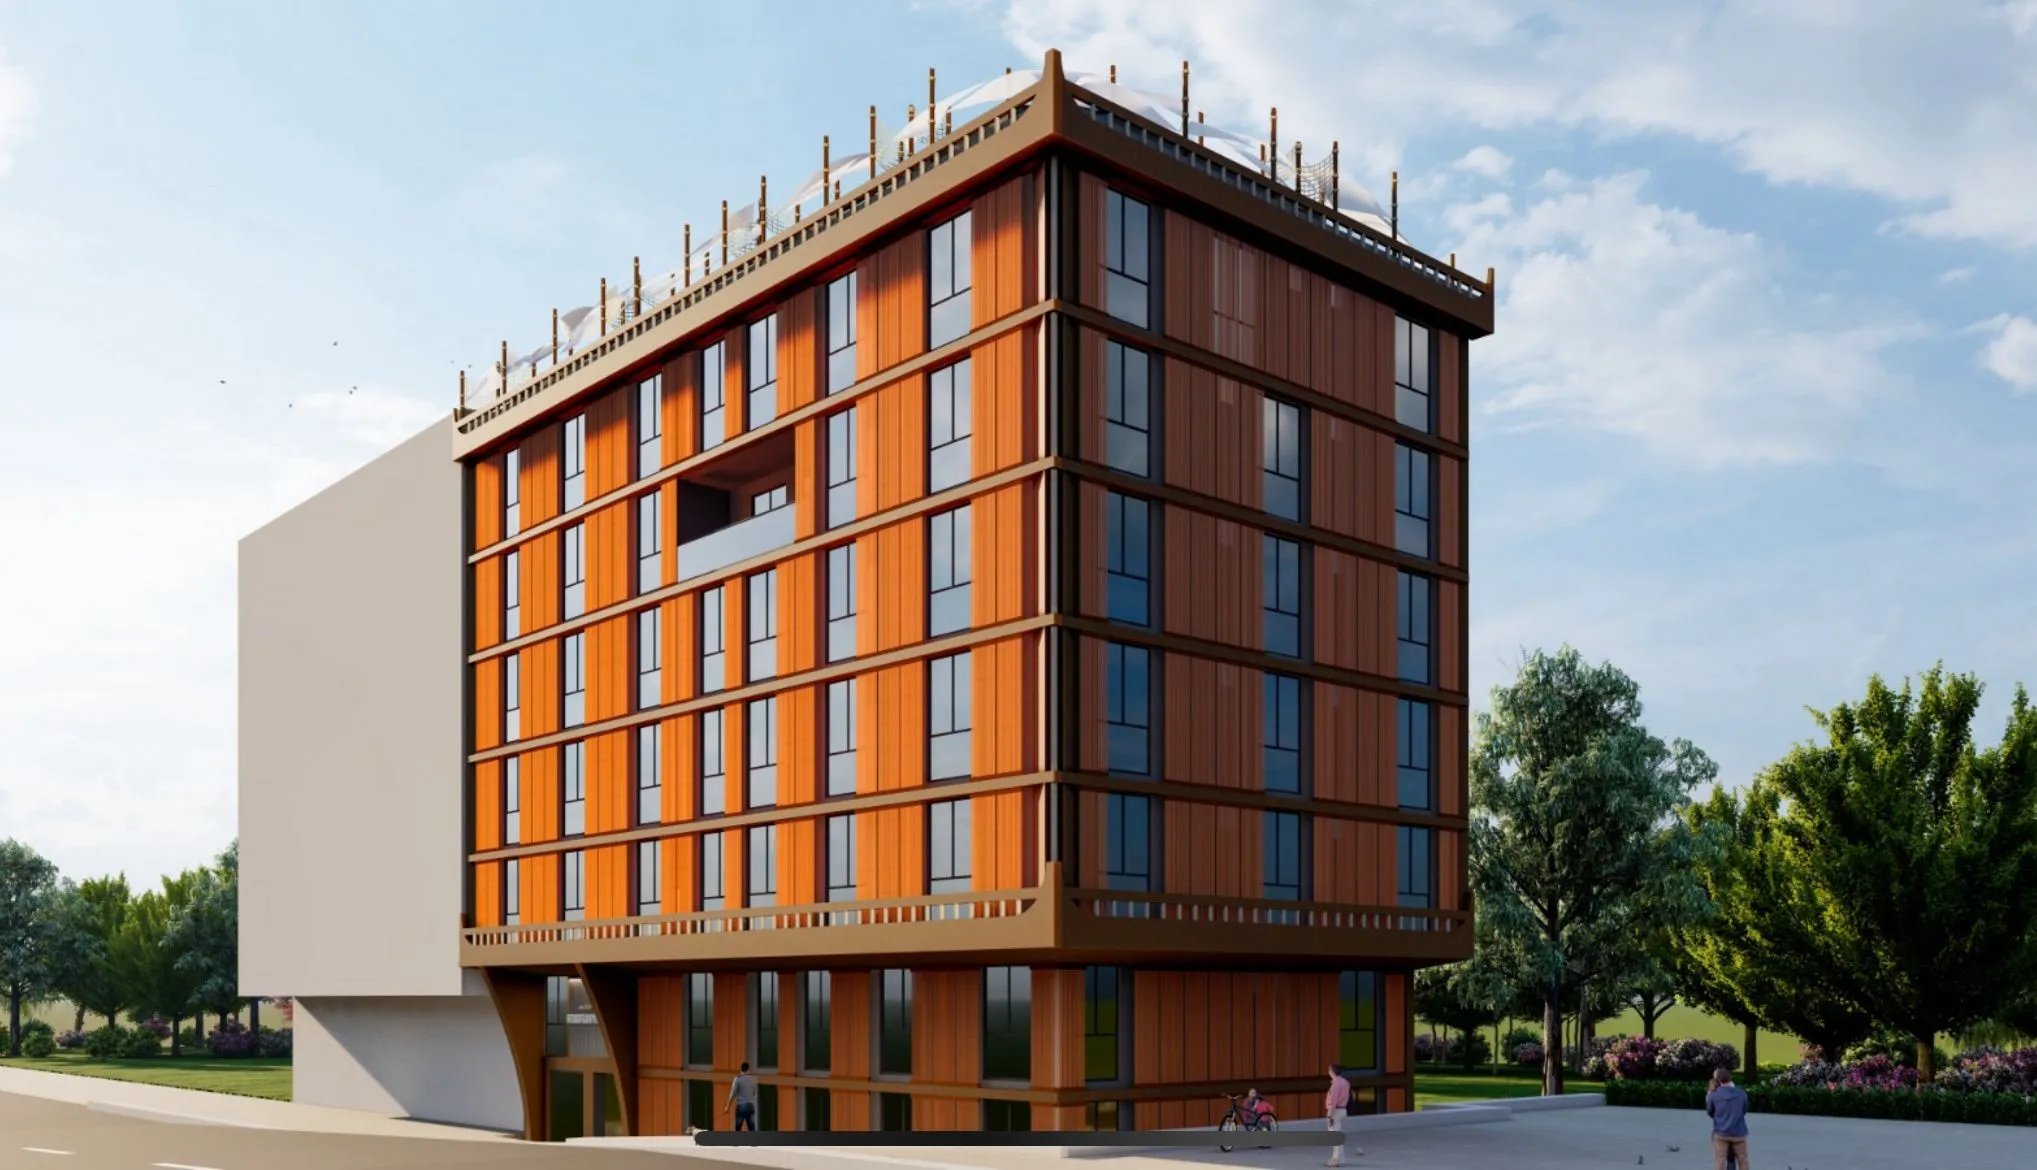
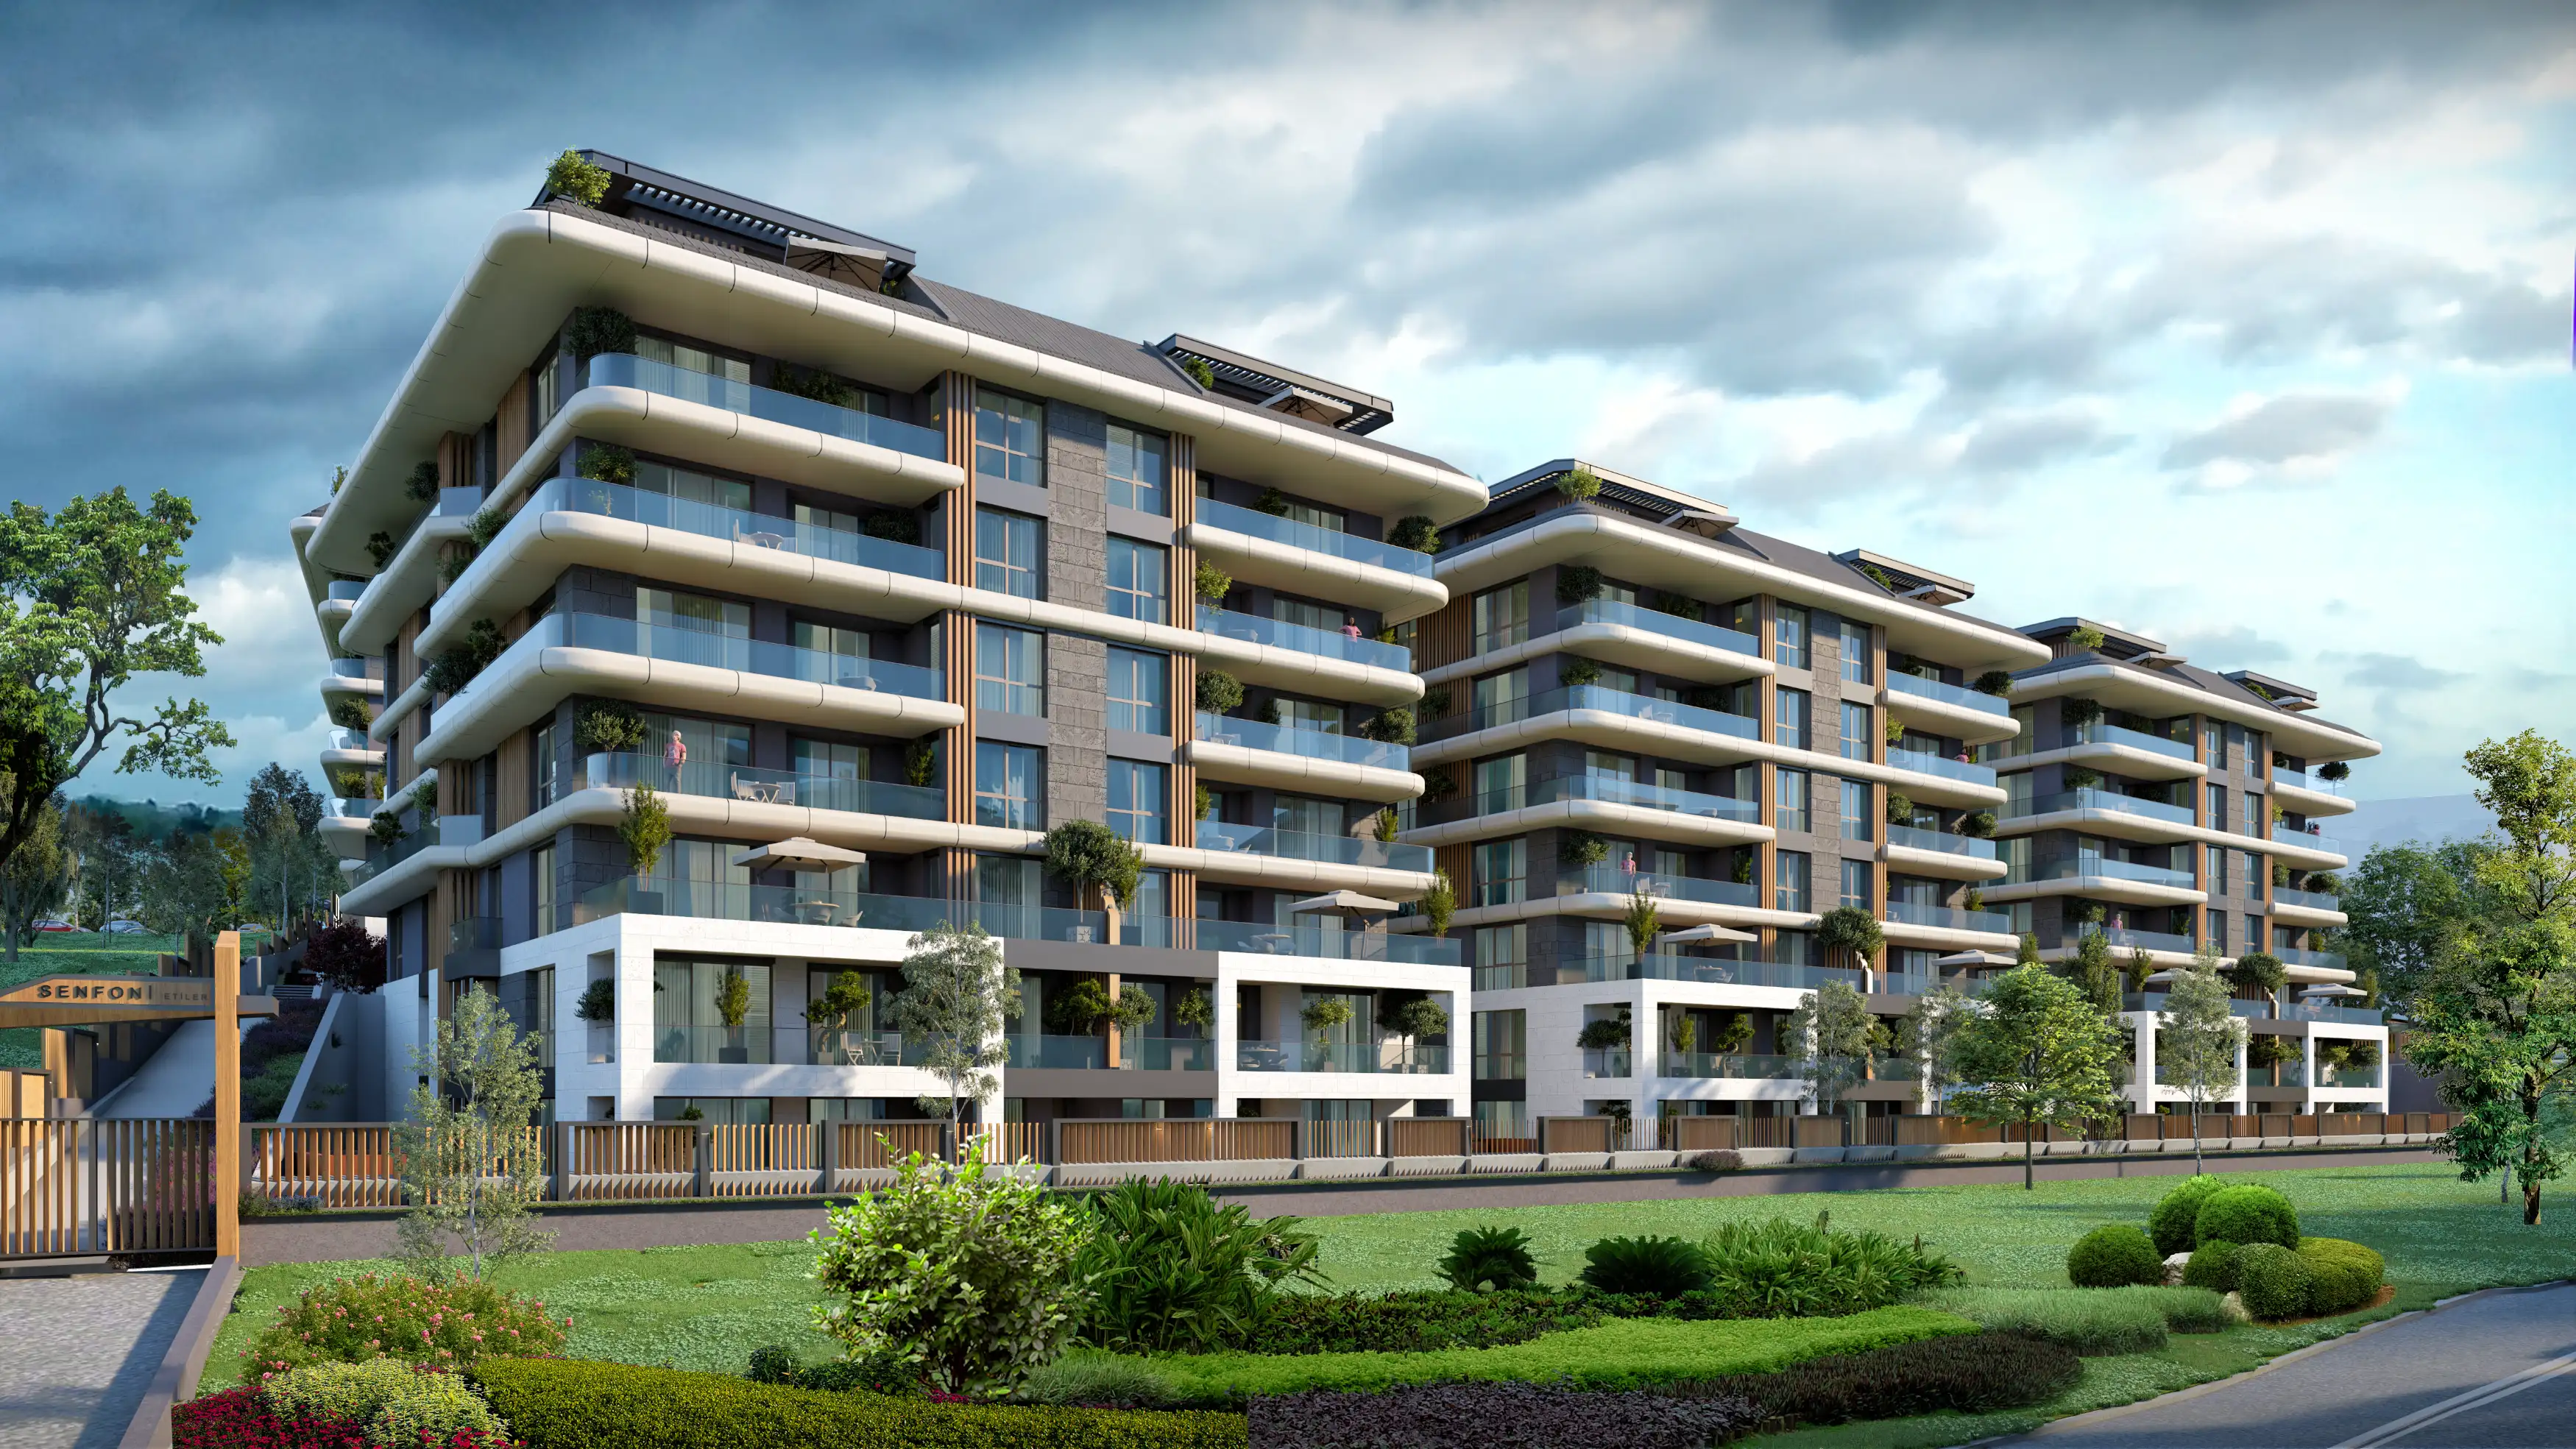
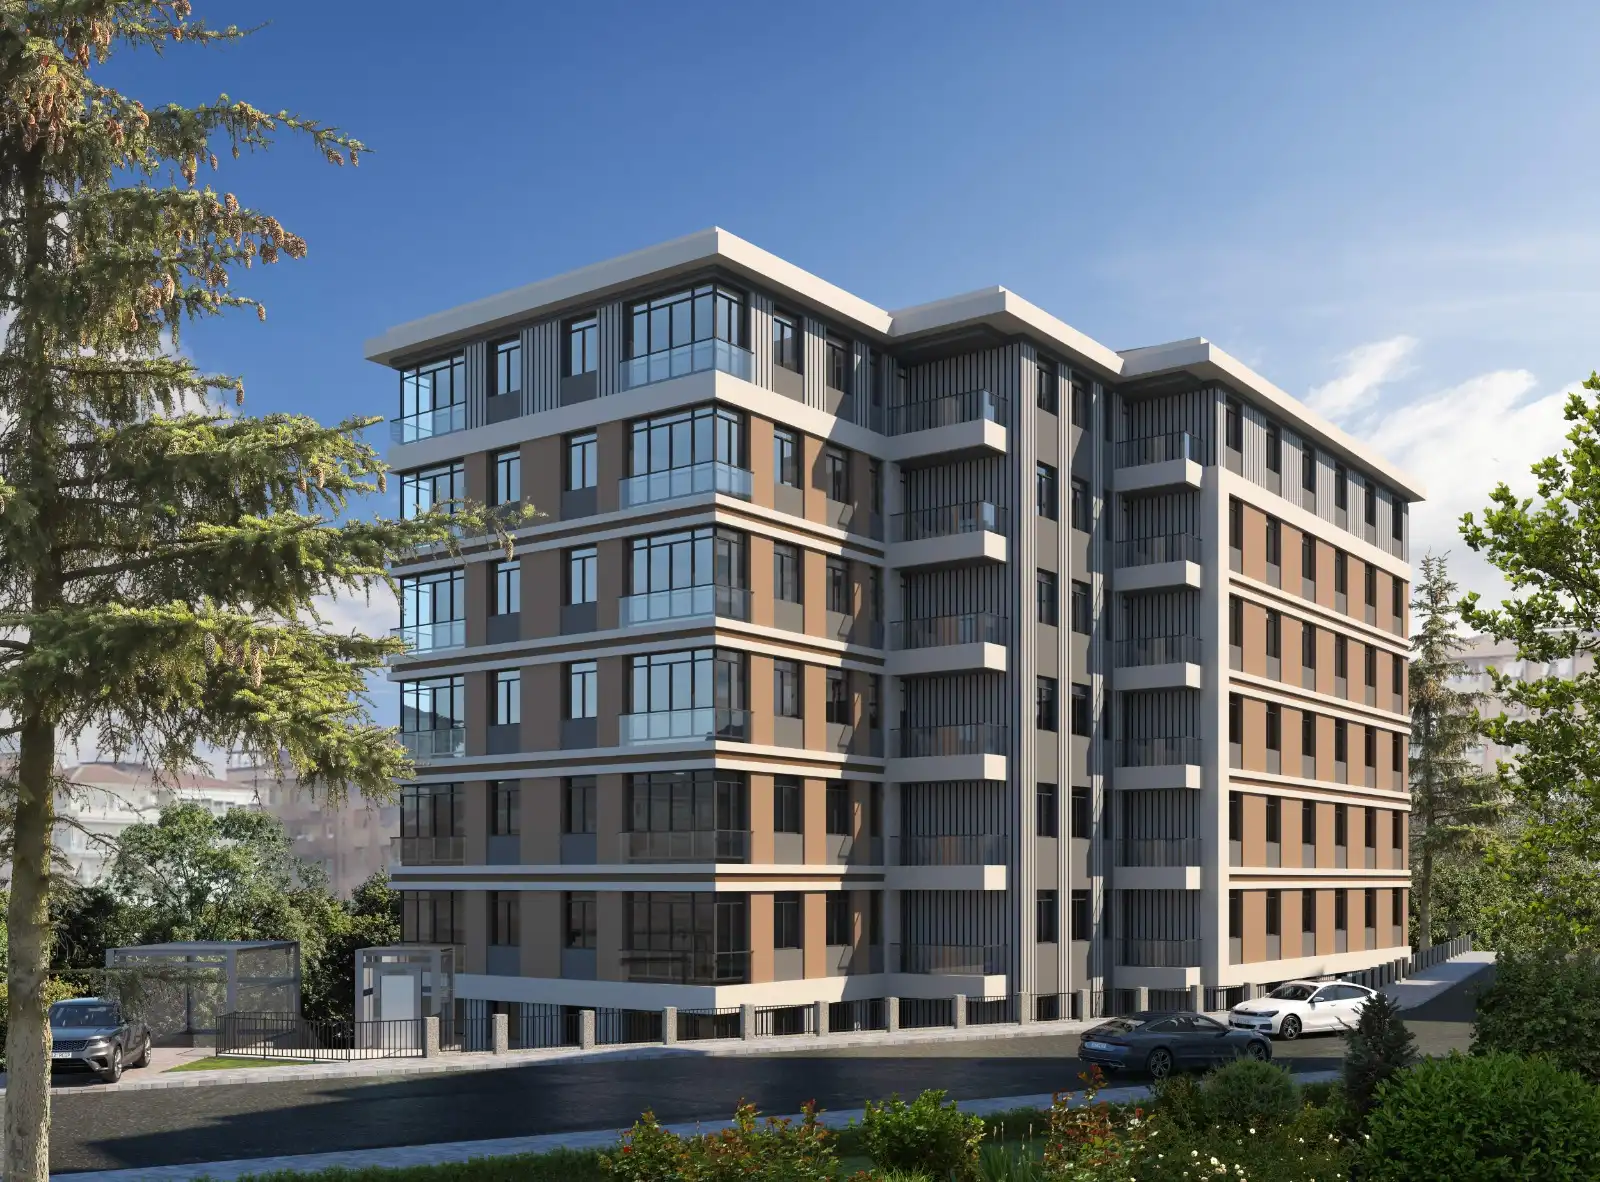
Projects Have same ROI in This Area




.webp)

Have Question Or Suggestion ?
Please Share Your Thought, To Make It Real