Calculate ROI in Turkey Real Estate – Profit Insights
Use our advanced ROI calculator to estimate rental income, investment returns, and property profitability in Turkey based on real-time market data, legal regulations, and current trends. Make smarter investment decisions with confidence.
1,271$
Average Income
915$ - 1,627$
Min Income - Max Income
193,000$
Cash Price
| Year | Annual Increase | Monthly ROI | Annual ROI |
|---|---|---|---|
| 1 |
7.90
%
|
1,271$
|
15,251$
|
| 2 |
10.67
%
|
1,716$
|
20,589$
|
| 3 |
14.40
%
|
2,316$
|
27,795$
|
| 4 |
19.44
%
|
3,127$
|
37,523$
|
| 5 |
26.25
%
|
4,221$
|
50,656$
|
| 6 |
35.43
%
|
5,699$
|
68,386$
|
| 7 |
47.83
%
|
7,693$
|
92,321$
|
| 8 |
64.58
%
|
10,386$
|
124,633$
|
| 9 |
87.18
%
|
14,021$
|
168,255$
|
| 10 |
117.69
%
|
18,929$
|
227,144$
|
832,551$ 431%
Total ROI For 10 Years
1,627$
Max Income
193,000$
Cash Price
| Year | Annual Increase | Monthly ROI | Annual ROI |
|---|---|---|---|
| 1 |
10.11
%
|
1,627$
|
19,521$
|
| 2 |
13.65
%
|
2,196$
|
26,354$
|
| 3 |
18.43
%
|
2,965$
|
35,577$
|
| 4 |
24.89
%
|
4,002$
|
48,029$
|
| 5 |
33.60
%
|
5,403$
|
64,840$
|
| 6 |
45.35
%
|
7,294$
|
87,534$
|
| 7 |
61.23
%
|
9,848$
|
118,171$
|
| 8 |
82.66
%
|
13,294$
|
159,530$
|
| 9 |
111.59
%
|
17,947$
|
215,366$
|
| 10 |
150.64
%
|
24,229$
|
290,744$
|
1,065,666$ 552%
Total ROI For 10 Years
915$
Min Income
193,000$
Cash Price
| Year | Annual Increase | Monthly ROI | Annual ROI |
|---|---|---|---|
| 1 |
5.69
%
|
915$
|
10,981$
|
| 2 |
7.68
%
|
1,235$
|
14,824$
|
| 3 |
10.37
%
|
1,668$
|
20,012$
|
| 4 |
14.00
%
|
2,251$
|
27,017$
|
| 5 |
18.90
%
|
3,039$
|
36,472$
|
| 6 |
25.51
%
|
4,103$
|
49,238$
|
| 7 |
34.44
%
|
5,539$
|
66,471$
|
| 8 |
46.50
%
|
7,478$
|
89,736$
|
| 9 |
62.77
%
|
10,095$
|
121,143$
|
| 10 |
84.74
%
|
13,629$
|
163,543$
|
599,437$ 310%
Total ROI For 10 Years
District Classification
Rating
A+
Area map
Area Insights & Neighborhood Demographics
Population
178,940
Social Status
Married : 49%
Unmarried : 33%
area
17 Km2
District Property Price Trend (Last 5 Years)
1 Year Change
12.14%
3 Year Change
257%
5 Year Change
226.9%
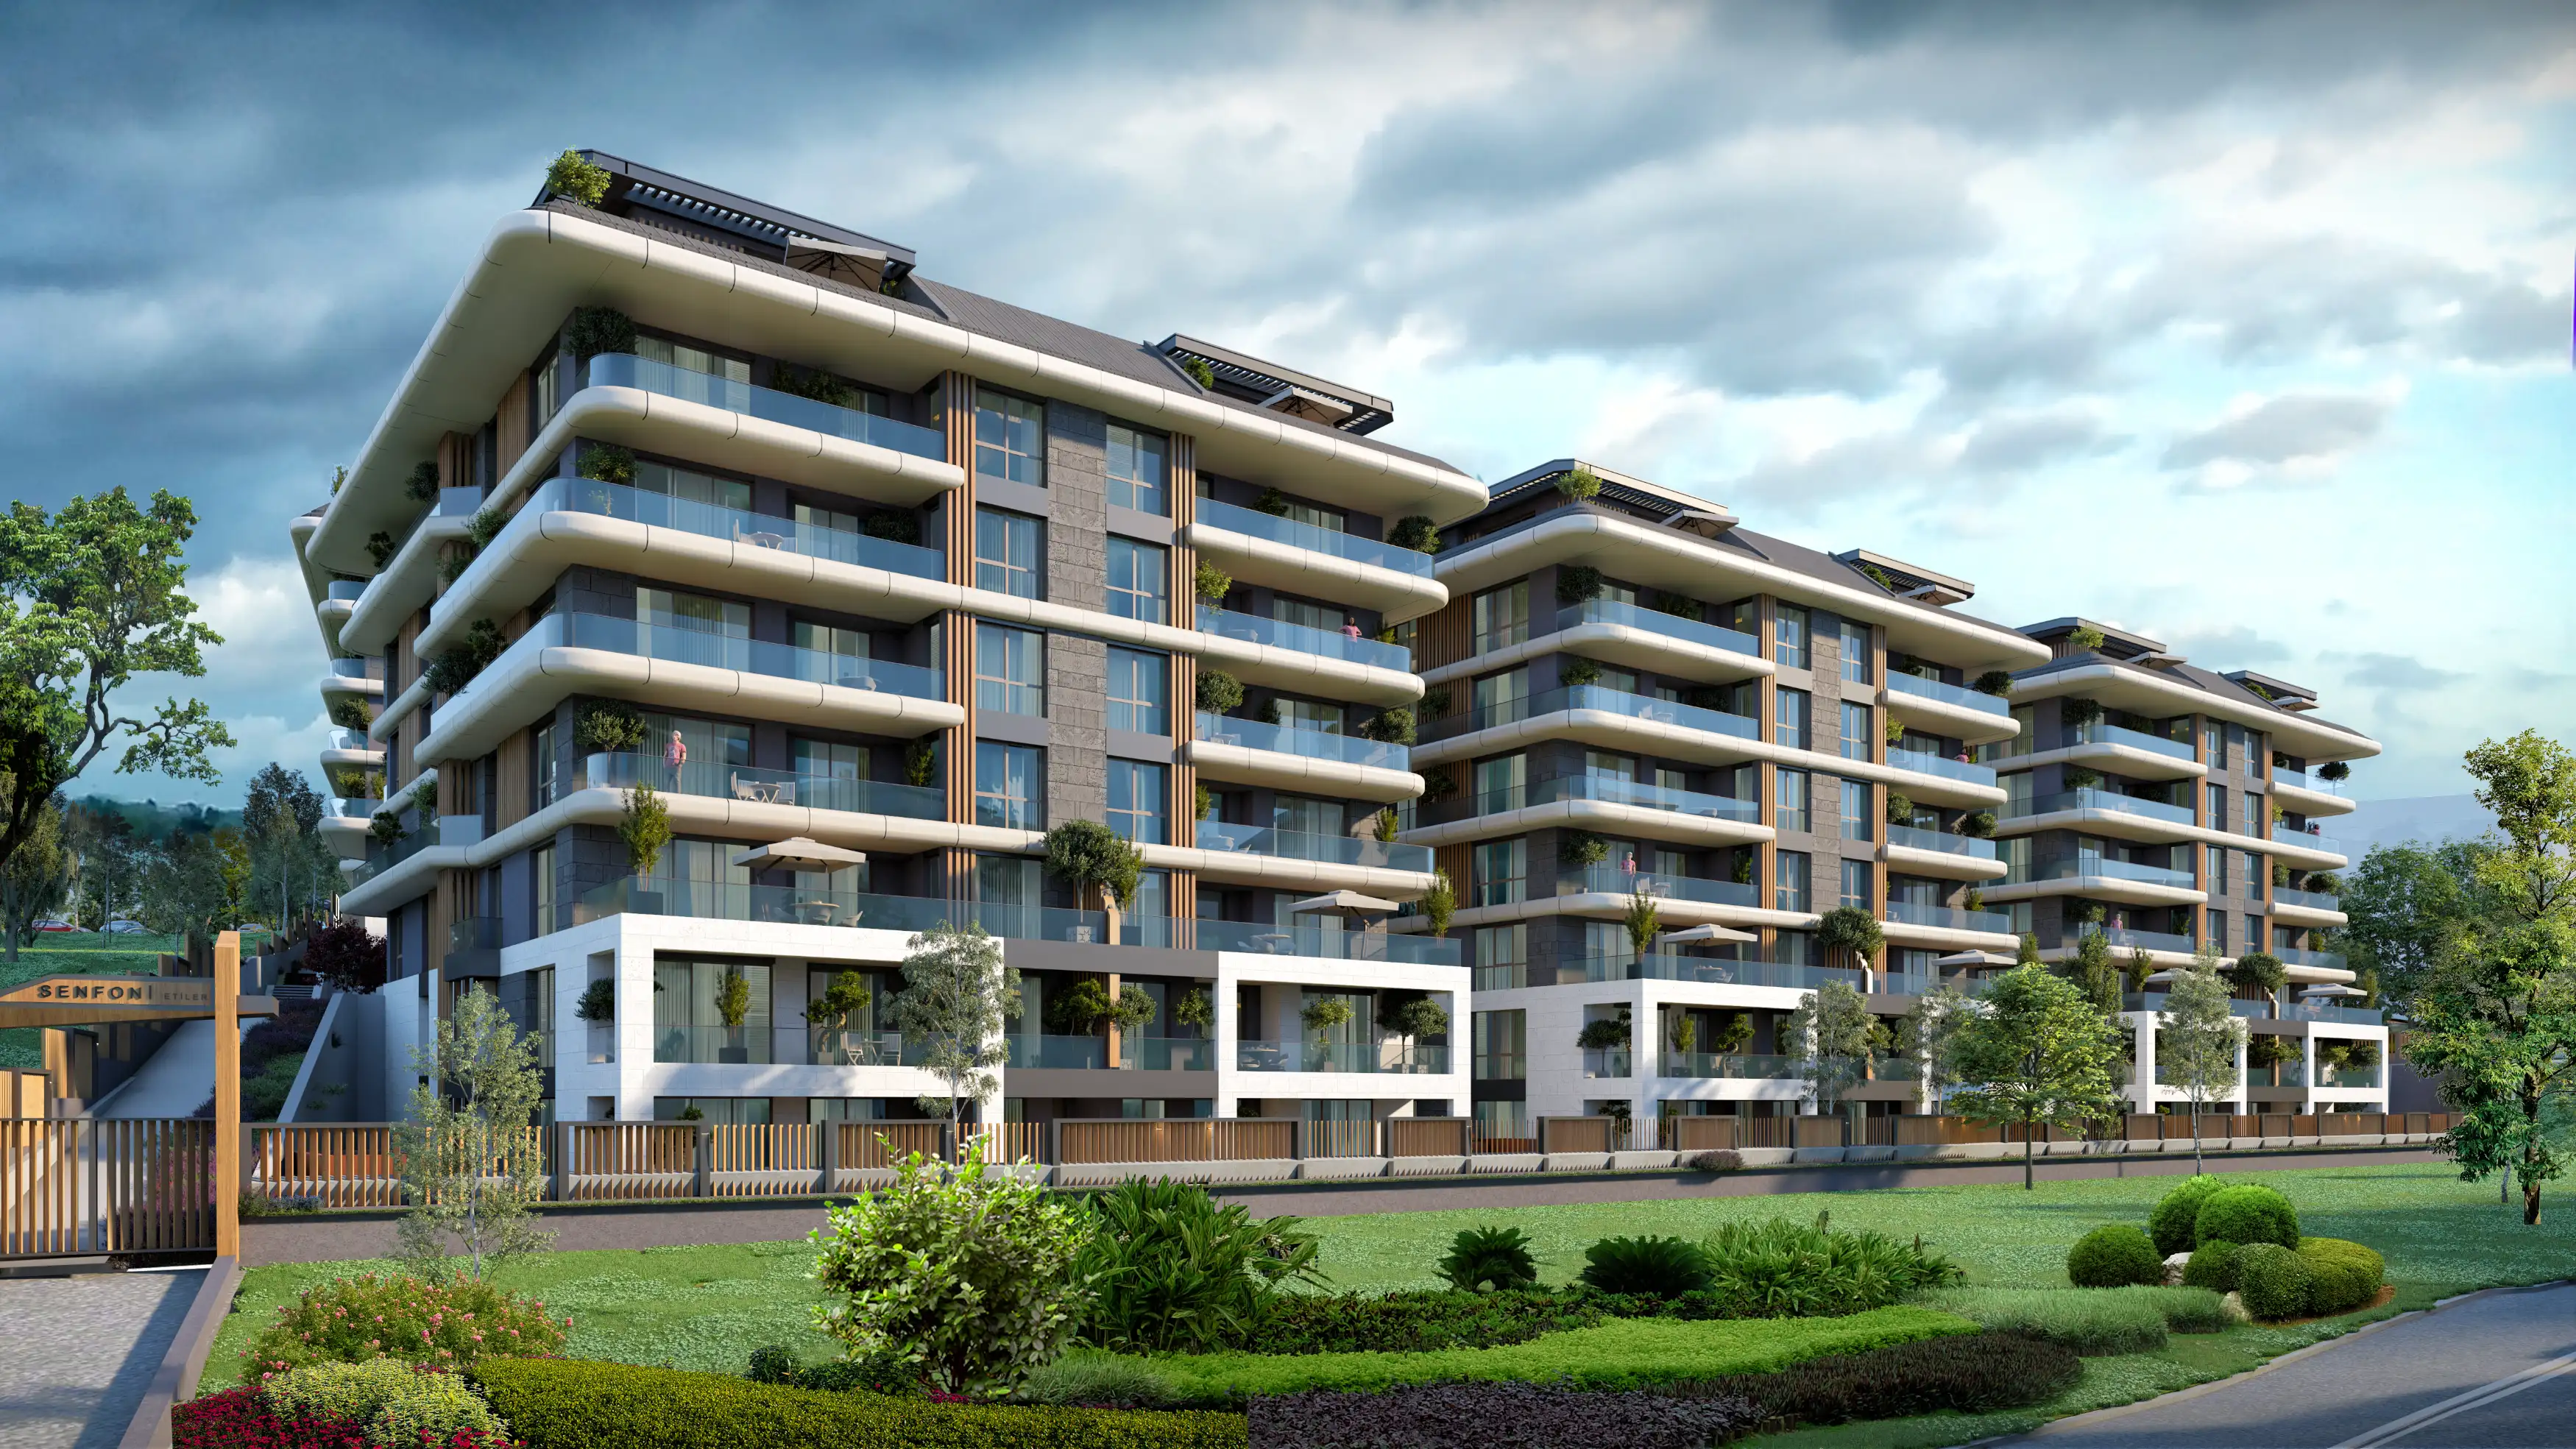
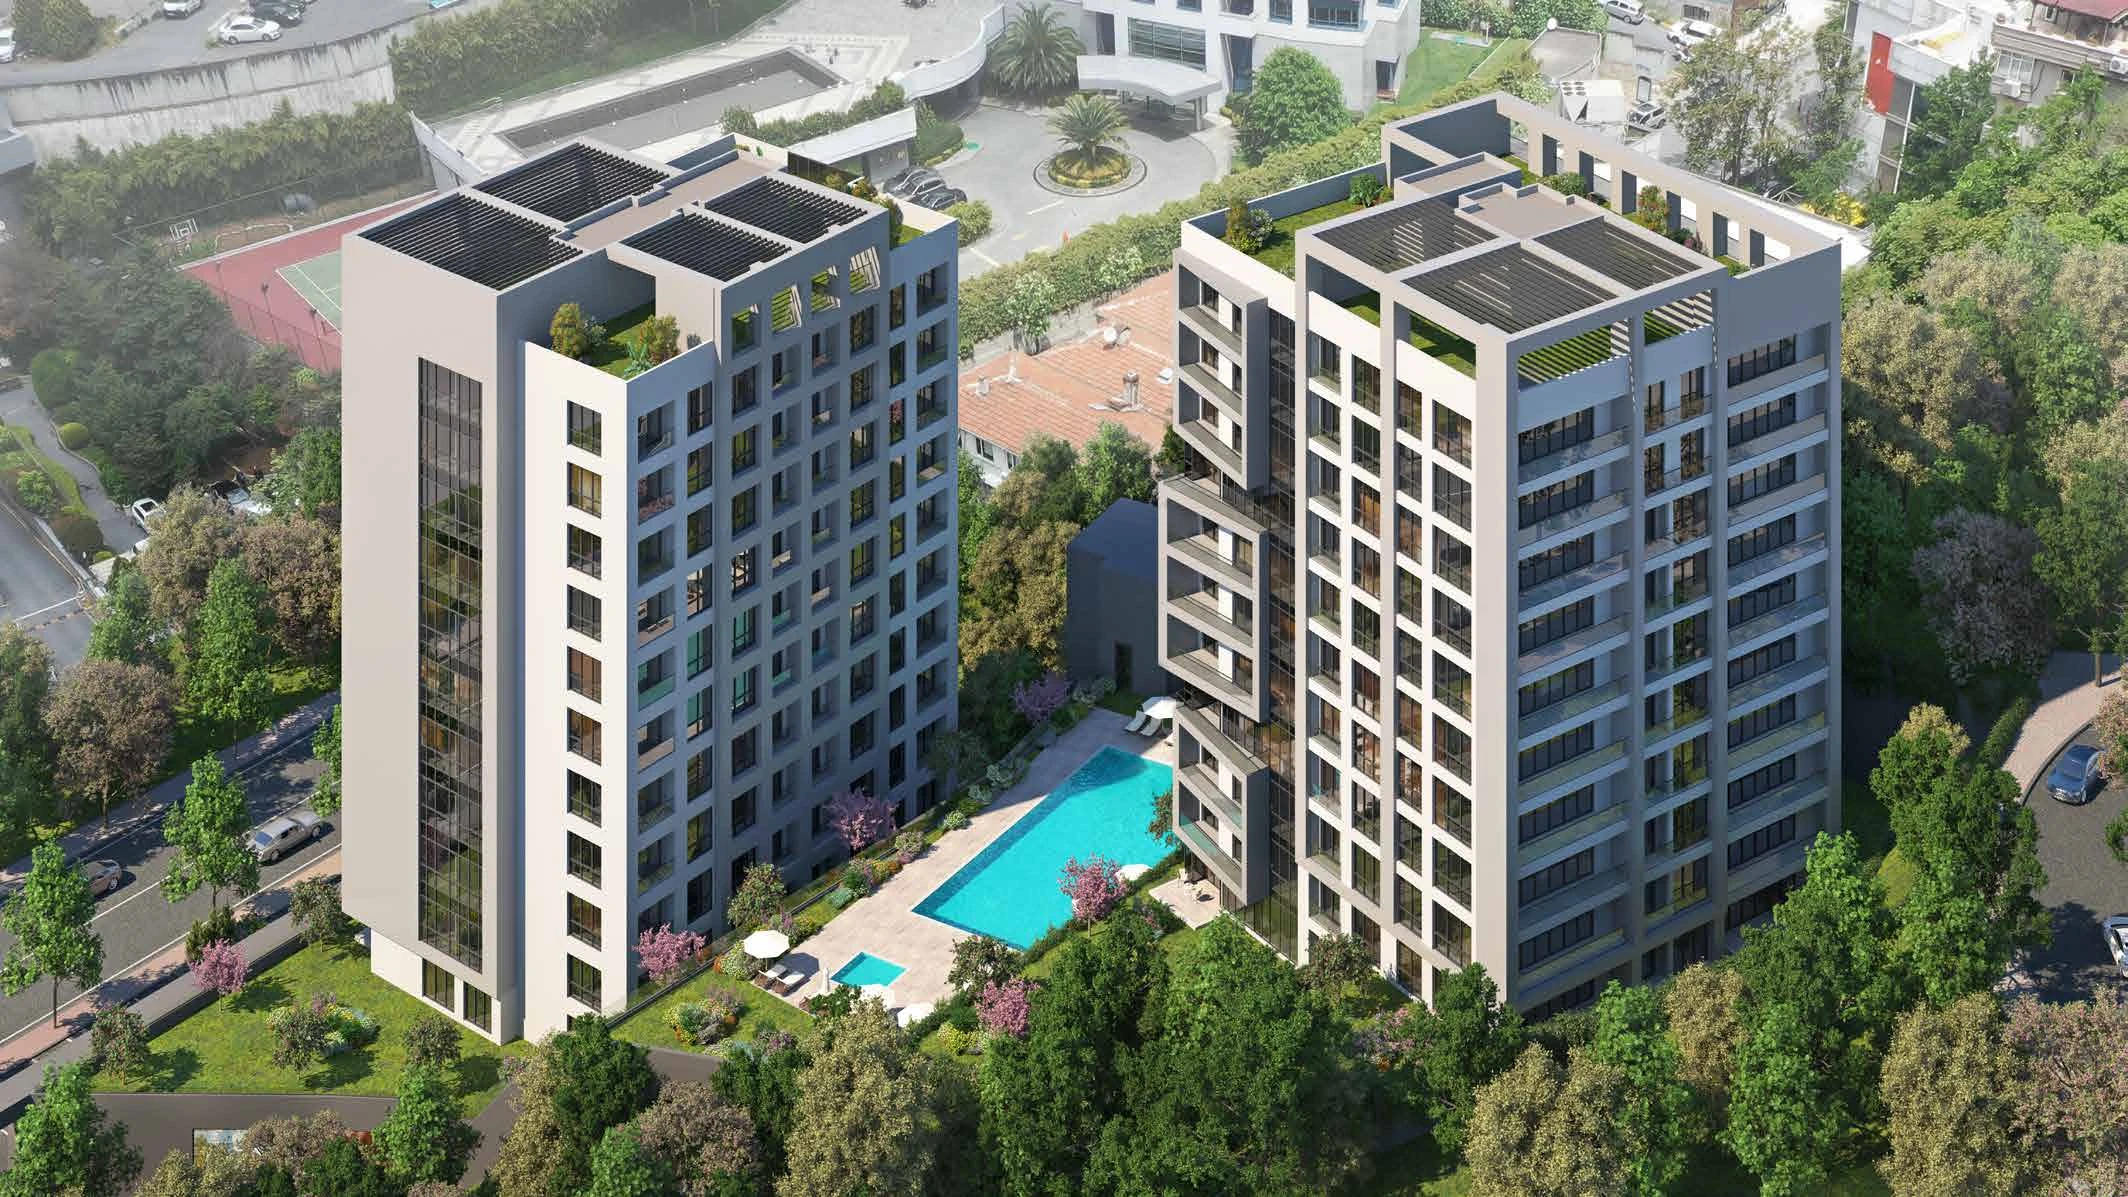
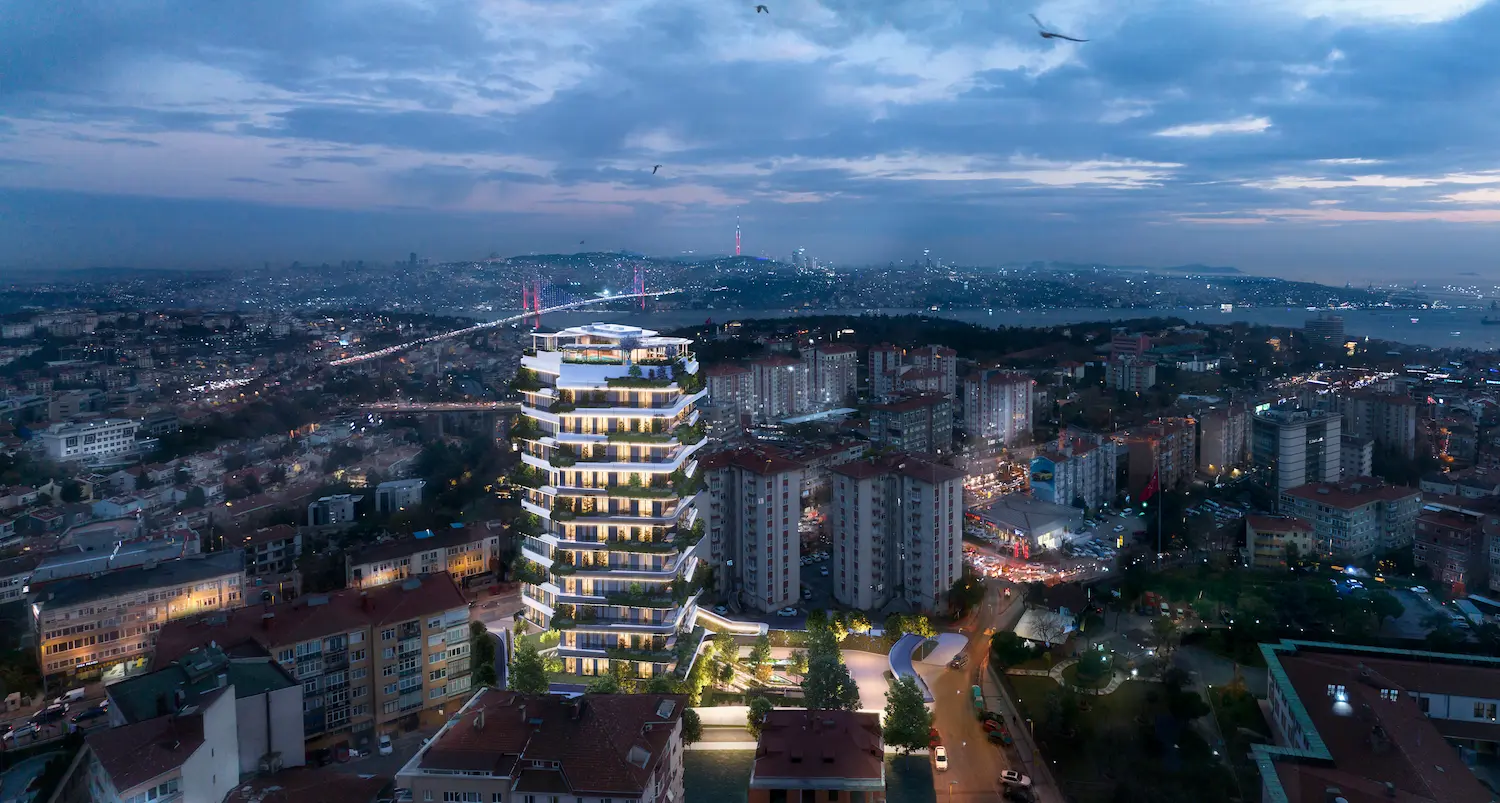
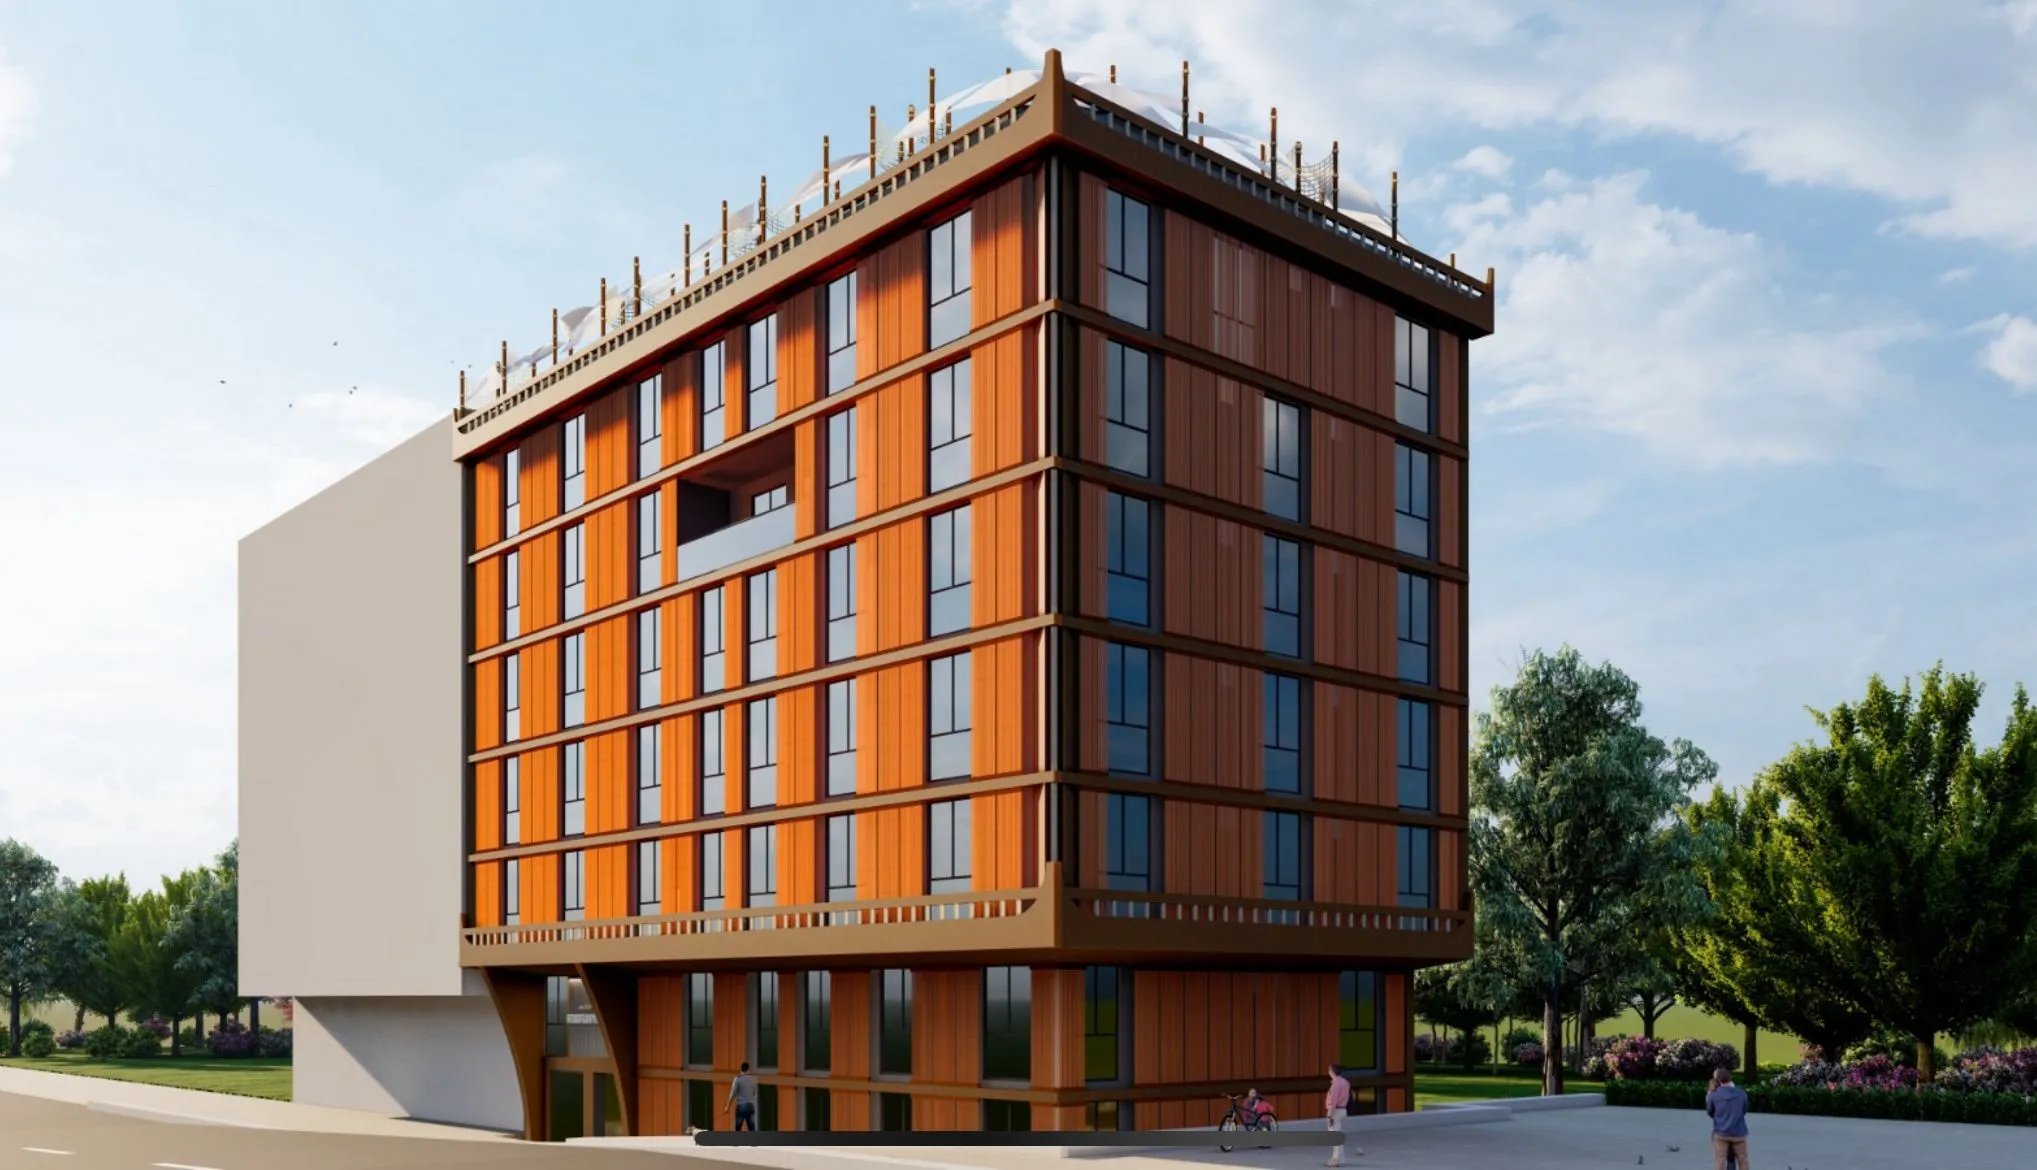
Projects Have same ROI in This Area
.webp)





Have Question Or Suggestion ?
Please Share Your Thought, To Make It Real