Calculate ROI in Turkey Real Estate – Profit Insights
Use our advanced ROI calculator to estimate rental income, investment returns, and property profitability in Turkey based on real-time market data, legal regulations, and current trends. Make smarter investment decisions with confidence.
3,872$
Average Income
2,581$ - 5,162$
Min Income - Max Income
3,524,000$
Cash Price
| Year | Annual Increase | Monthly ROI | Annual ROI |
|---|---|---|---|
| 1 |
1.32
%
|
3,872$
|
46,459$
|
| 2 |
1.78
%
|
5,227$
|
62,719$
|
| 3 |
2.40
%
|
7,056$
|
84,671$
|
| 4 |
3.24
%
|
9,526$
|
114,306$
|
| 5 |
4.38
%
|
12,859$
|
154,313$
|
| 6 |
5.91
%
|
17,360$
|
208,323$
|
| 7 |
7.98
%
|
23,436$
|
281,236$
|
| 8 |
10.77
%
|
31,639$
|
379,668$
|
| 9 |
14.54
%
|
42,713$
|
512,552$
|
| 10 |
19.64
%
|
57,662$
|
691,945$
|
2,536,191$ 71%
Total ROI For 10 Years
5,162$
Max Income
3,524,000$
Cash Price
| Year | Annual Increase | Monthly ROI | Annual ROI |
|---|---|---|---|
| 1 |
1.76
%
|
5,162$
|
61,945$
|
| 2 |
2.37
%
|
6,969$
|
83,626$
|
| 3 |
3.20
%
|
9,408$
|
112,895$
|
| 4 |
4.32
%
|
12,701$
|
152,408$
|
| 5 |
5.84
%
|
17,146$
|
205,751$
|
| 6 |
7.88
%
|
23,147$
|
277,763$
|
| 7 |
10.64
%
|
31,248$
|
374,981$
|
| 8 |
14.37
%
|
42,185$
|
506,224$
|
| 9 |
19.39
%
|
56,950$
|
683,402$
|
| 10 |
26.18
%
|
76,883$
|
922,593$
|
3,381,588$ 95%
Total ROI For 10 Years
2,581$
Min Income
3,524,000$
Cash Price
| Year | Annual Increase | Monthly ROI | Annual ROI |
|---|---|---|---|
| 1 |
0.88
%
|
2,581$
|
30,973$
|
| 2 |
1.19
%
|
3,484$
|
41,813$
|
| 3 |
1.60
%
|
4,704$
|
56,447$
|
| 4 |
2.16
%
|
6,350$
|
76,204$
|
| 5 |
2.92
%
|
8,573$
|
102,875$
|
| 6 |
3.94
%
|
11,573$
|
138,882$
|
| 7 |
5.32
%
|
15,624$
|
187,490$
|
| 8 |
7.18
%
|
21,093$
|
253,112$
|
| 9 |
9.70
%
|
28,475$
|
341,701$
|
| 10 |
13.09
%
|
38,441$
|
461,297$
|
1,690,794$ 47%
Total ROI For 10 Years
District Classification
Rating
A+
Area map
Area Insights & Neighborhood Demographics
Population
178,940
Social Status
Married : 49%
Unmarried : 33%
area
17 Km2
District Property Price Trend (Last 5 Years)
1 Year Change
12.14%
3 Year Change
257%
5 Year Change
226.9%
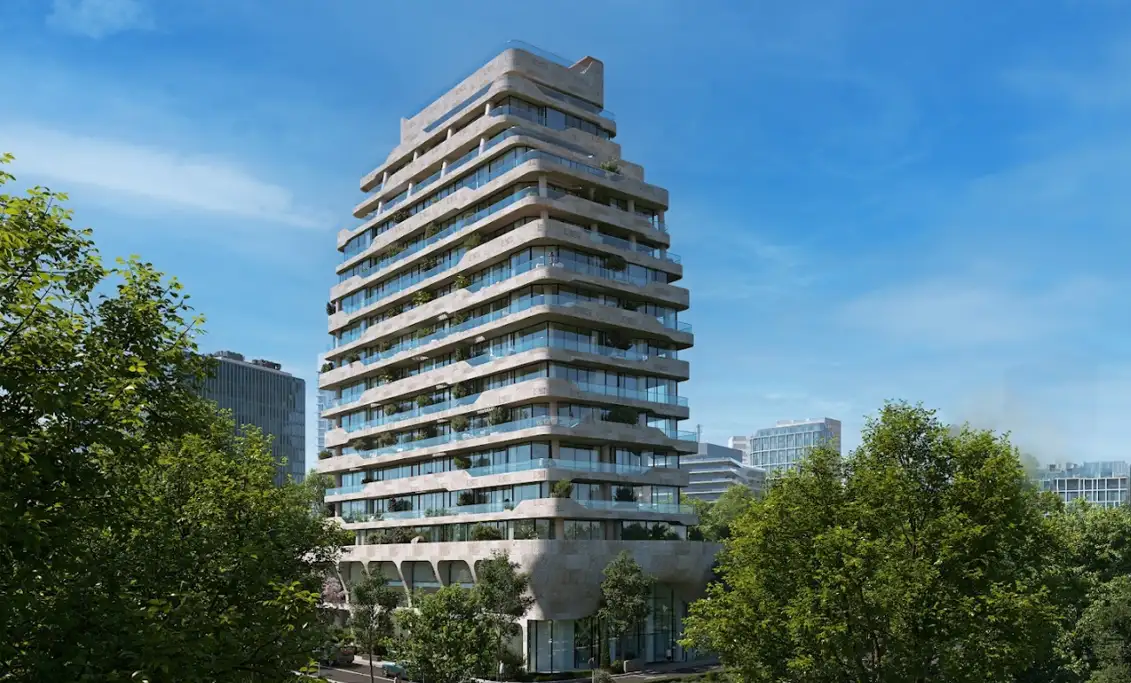
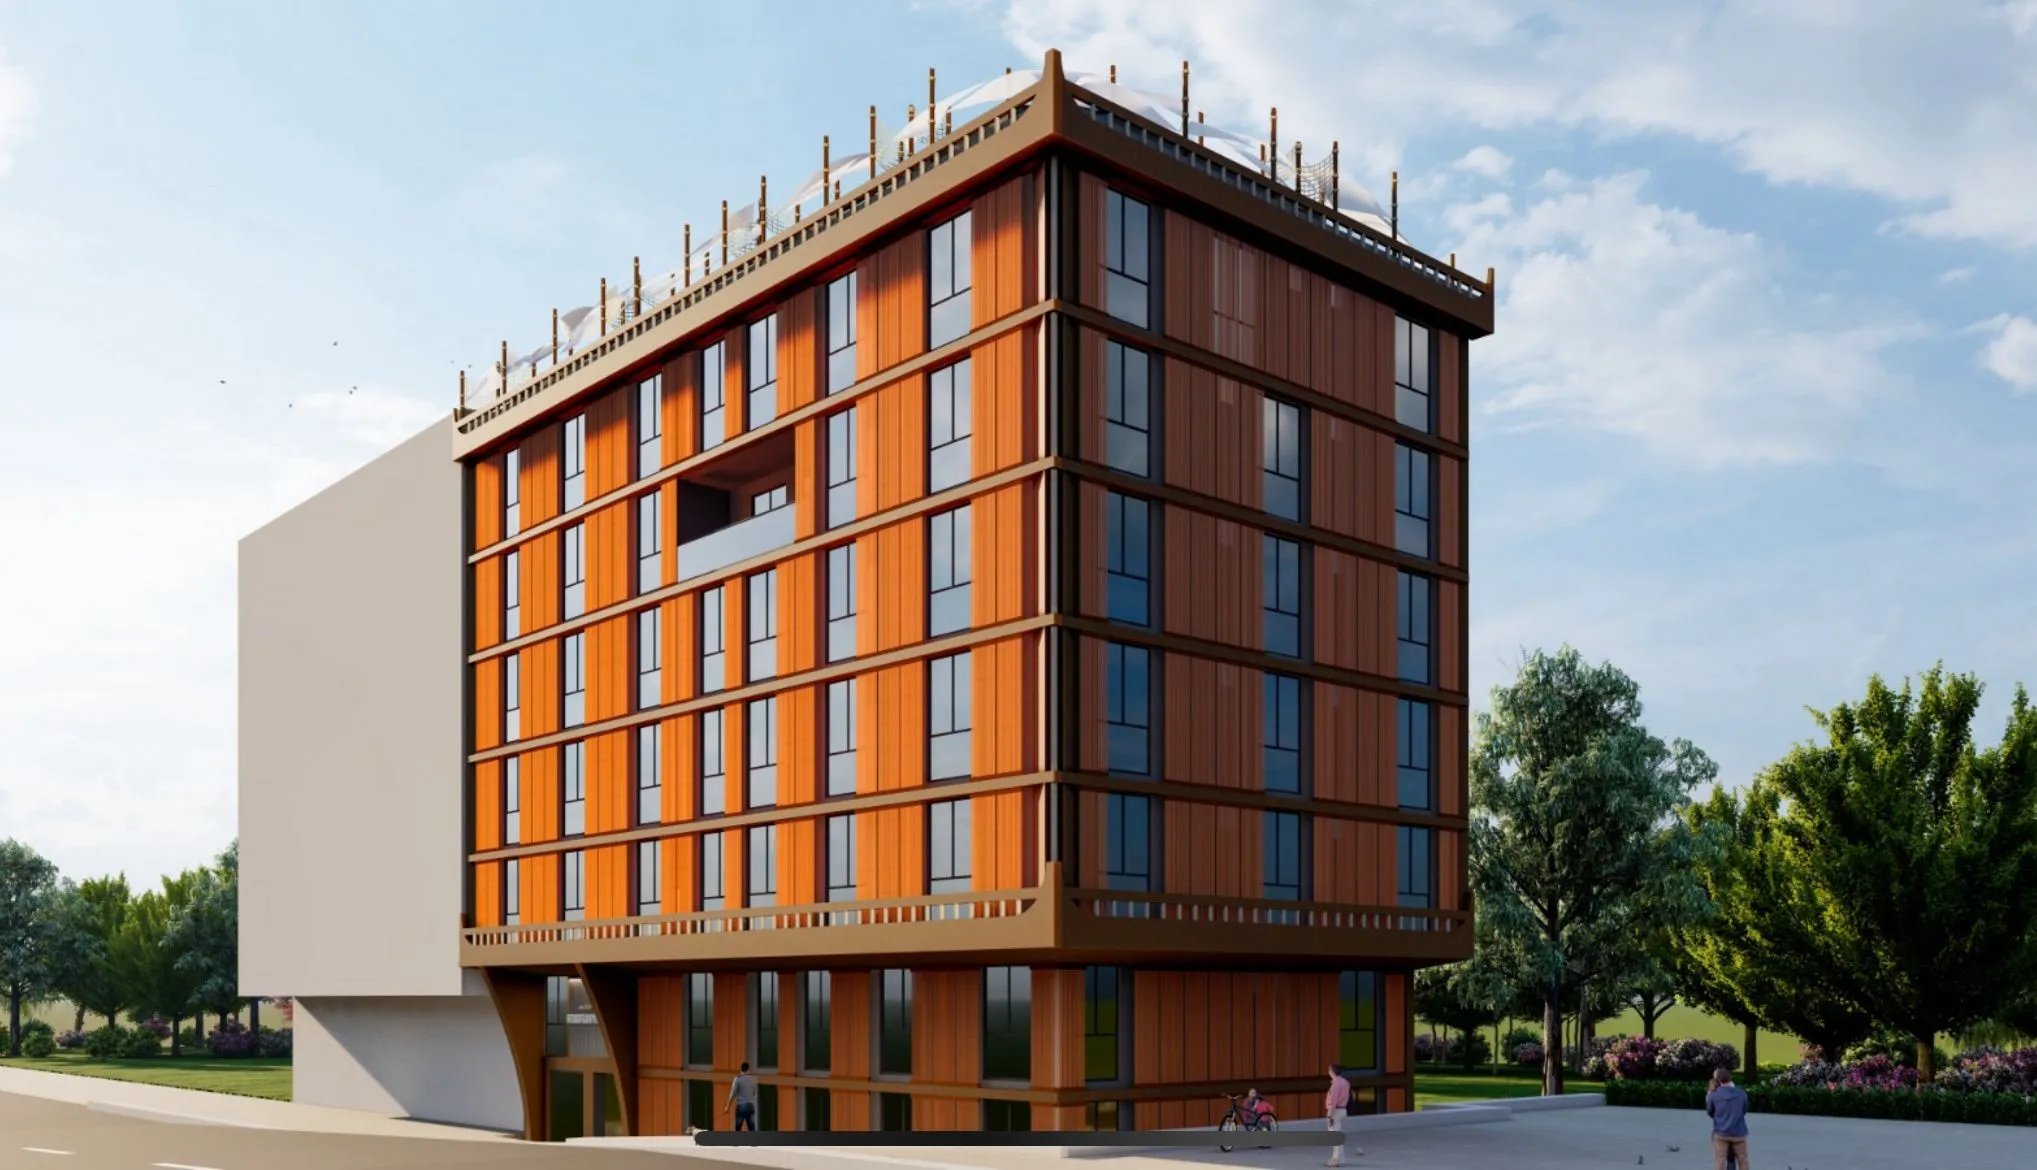
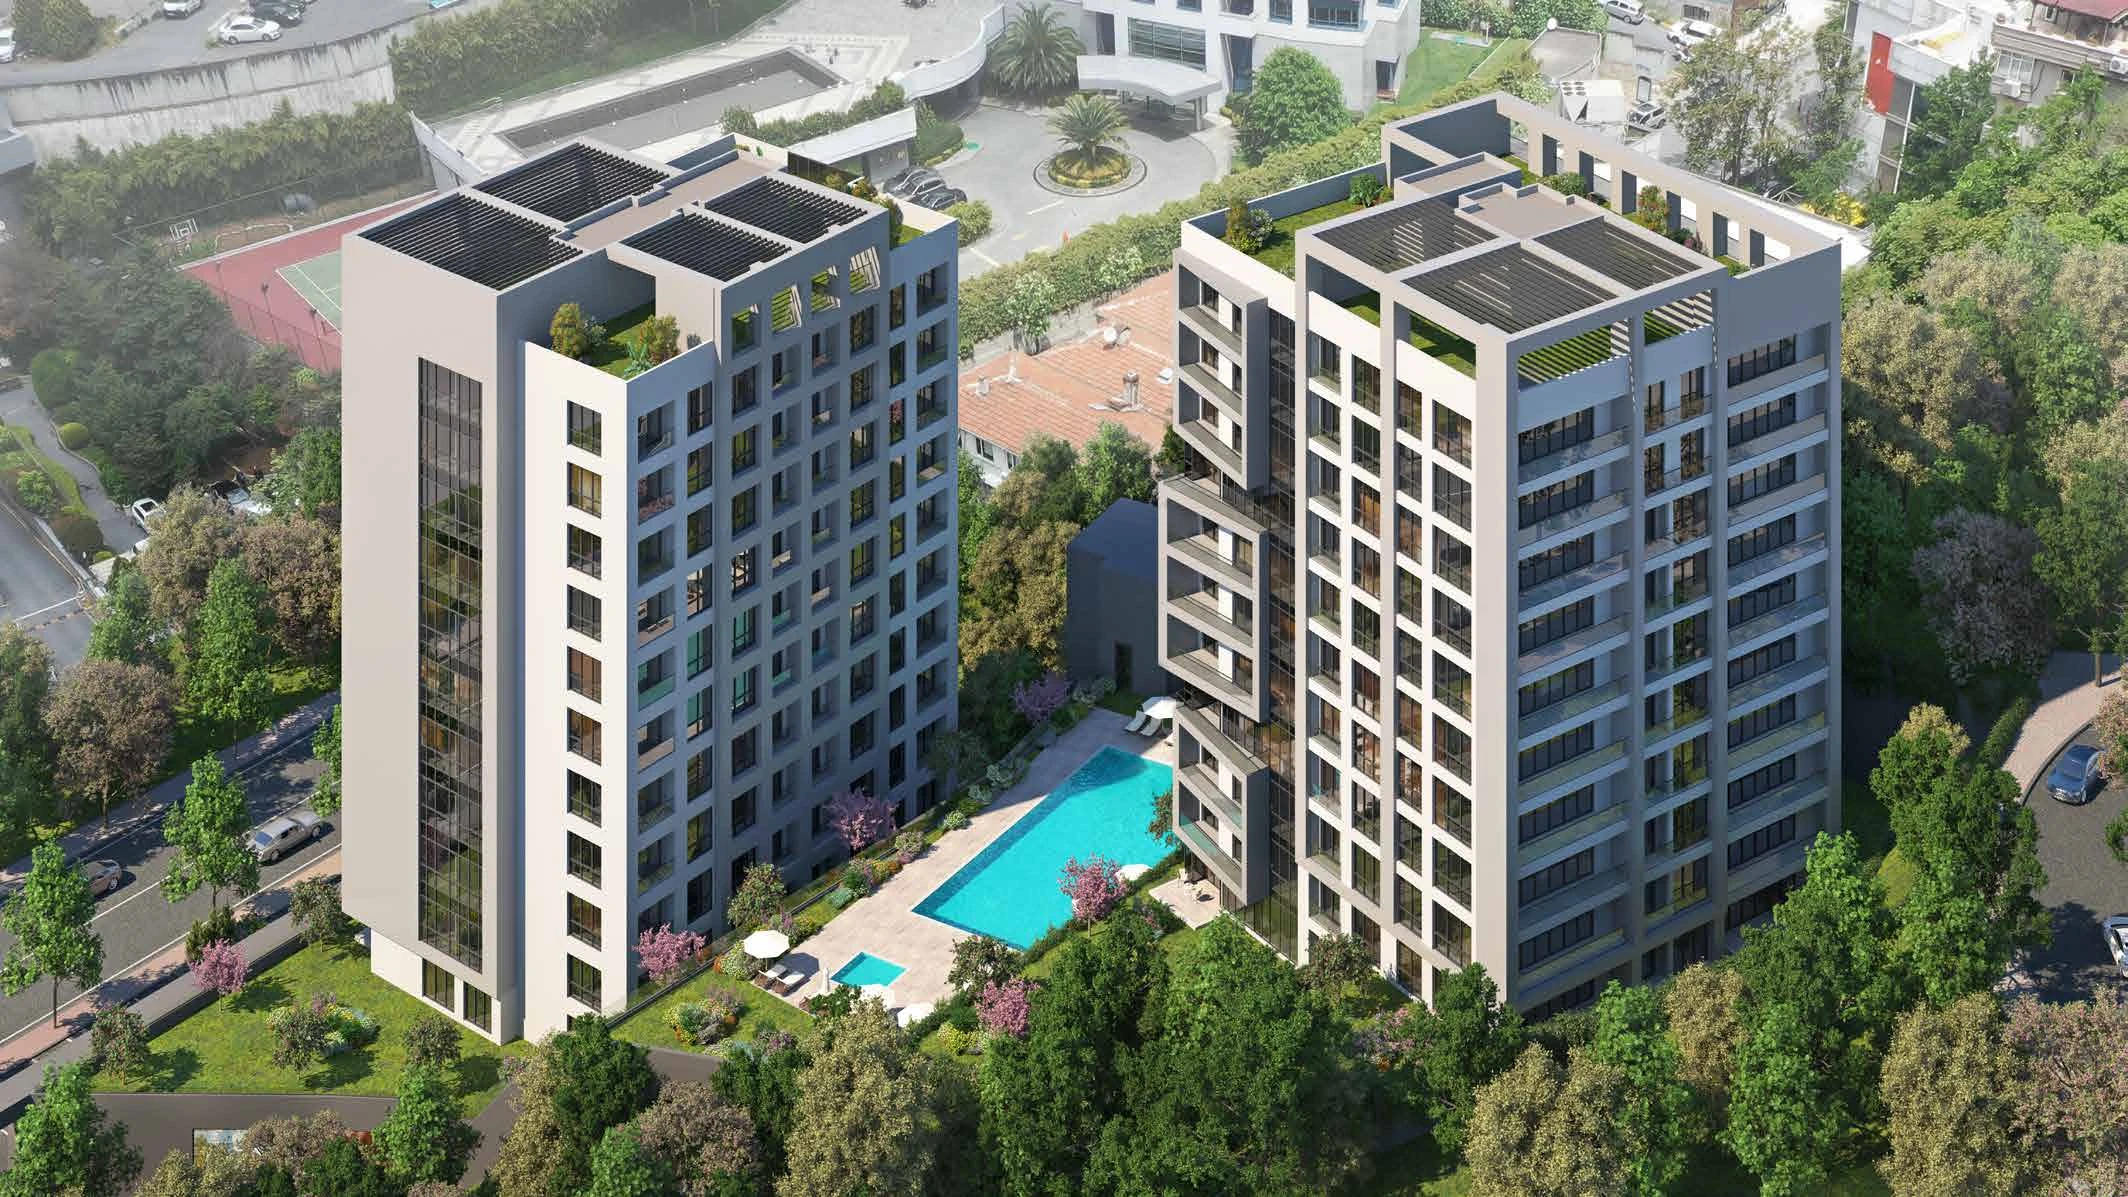
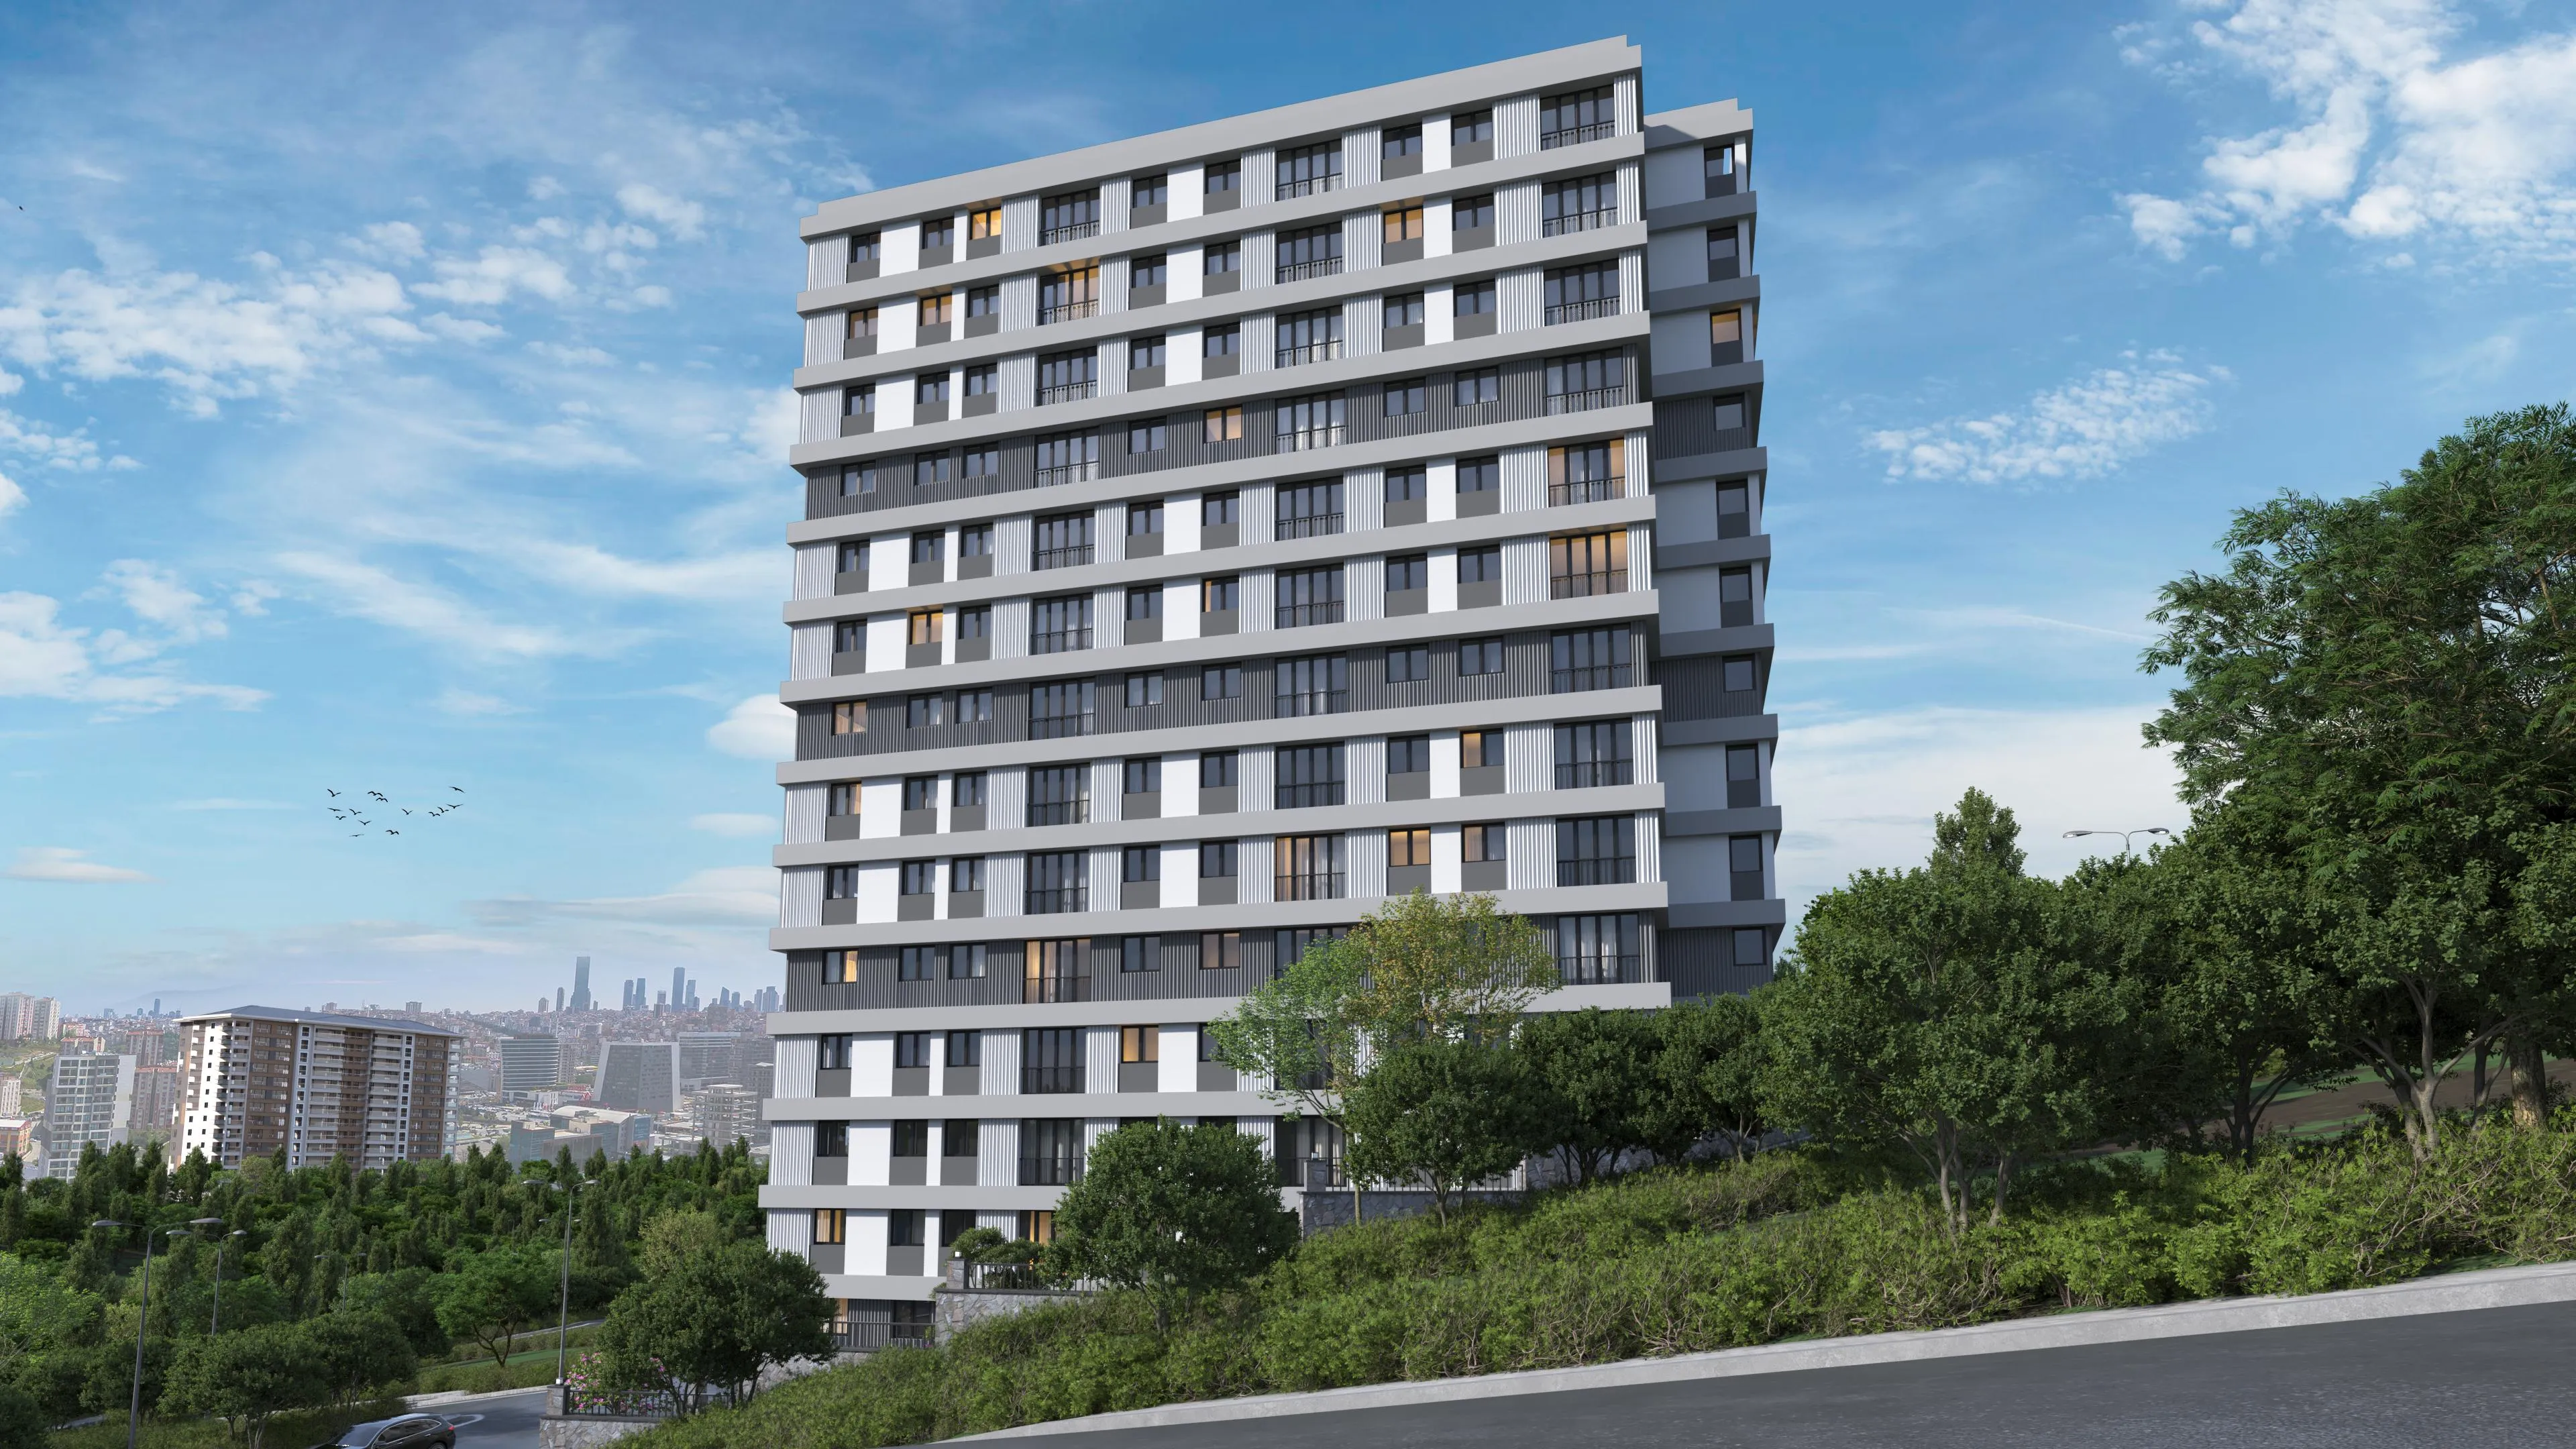
Projects Have same ROI in This Area



.webp)


Have Question Or Suggestion ?
Please Share Your Thought, To Make It Real