Calculate ROI in Turkey Real Estate – Profit Insights
Use our advanced ROI calculator to estimate rental income, investment returns, and property profitability in Turkey based on real-time market data, legal regulations, and current trends. Make smarter investment decisions with confidence.
915$
Average Income
508$ - 1,322$
Min Income - Max Income
525,000$
Cash Price
| Year | Annual Increase | Monthly ROI | Annual ROI |
|---|---|---|---|
| 1 |
2.09
%
|
915$
|
10,981$
|
| 2 |
2.82
%
|
1,235$
|
14,824$
|
| 3 |
3.81
%
|
1,668$
|
20,012$
|
| 4 |
5.15
%
|
2,251$
|
27,017$
|
| 5 |
6.95
%
|
3,039$
|
36,472$
|
| 6 |
9.38
%
|
4,103$
|
49,238$
|
| 7 |
12.66
%
|
5,539$
|
66,471$
|
| 8 |
17.09
%
|
7,478$
|
89,736$
|
| 9 |
23.07
%
|
10,095$
|
121,143$
|
| 10 |
31.15
%
|
13,629$
|
163,543$
|
599,437$ 114%
Total ROI For 10 Years
1,322$
Max Income
525,000$
Cash Price
| Year | Annual Increase | Monthly ROI | Annual ROI |
|---|---|---|---|
| 1 |
3.02
%
|
1,322$
|
15,861$
|
| 2 |
4.08
%
|
1,784$
|
21,412$
|
| 3 |
5.51
%
|
2,409$
|
28,907$
|
| 4 |
7.43
%
|
3,252$
|
39,024$
|
| 5 |
10.03
%
|
4,390$
|
52,682$
|
| 6 |
13.55
%
|
5,927$
|
71,121$
|
| 7 |
18.29
%
|
8,001$
|
96,014$
|
| 8 |
24.69
%
|
10,802$
|
129,618$
|
| 9 |
33.33
%
|
14,582$
|
174,985$
|
| 10 |
45.00
%
|
19,686$
|
236,229$
|
865,853$ 164%
Total ROI For 10 Years
508$
Min Income
525,000$
Cash Price
| Year | Annual Increase | Monthly ROI | Annual ROI |
|---|---|---|---|
| 1 |
1.16
%
|
508$
|
6,100$
|
| 2 |
1.57
%
|
686$
|
8,236$
|
| 3 |
2.12
%
|
926$
|
11,118$
|
| 4 |
2.86
%
|
1,251$
|
15,009$
|
| 5 |
3.86
%
|
1,689$
|
20,262$
|
| 6 |
5.21
%
|
2,280$
|
27,354$
|
| 7 |
7.03
%
|
3,077$
|
36,928$
|
| 8 |
9.50
%
|
4,154$
|
49,853$
|
| 9 |
12.82
%
|
5,608$
|
67,302$
|
| 10 |
17.31
%
|
7,571$
|
90,857$
|
333,020$ 63%
Total ROI For 10 Years
District Classification
Rating
a
Area map
Area Insights & Neighborhood Demographics
Population
415,290
Social Status
Married : 51%
Unmarried : 49%
area
37 Km2
District Property Price Trend (Last 5 Years)
1 Year Change
45.51%
3 Year Change
386.7%
5 Year Change
555.59%
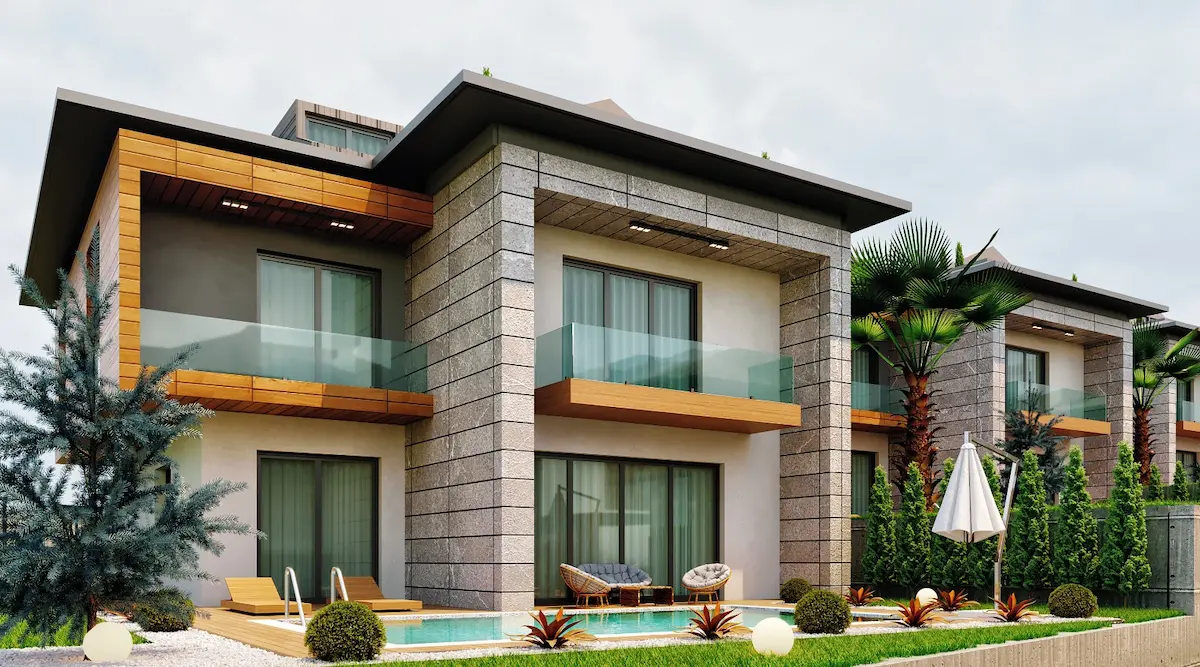
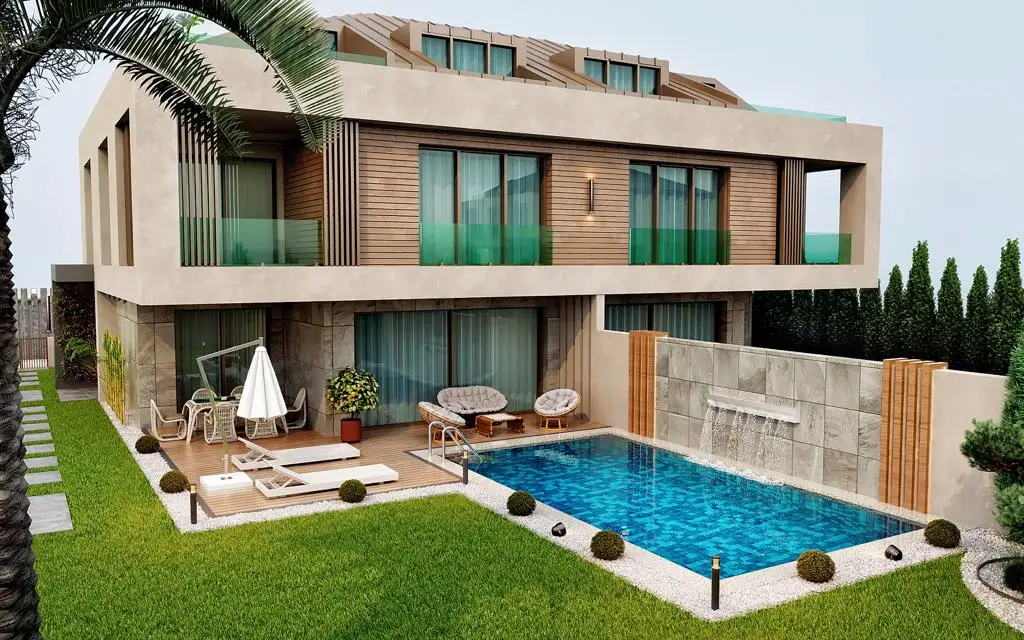
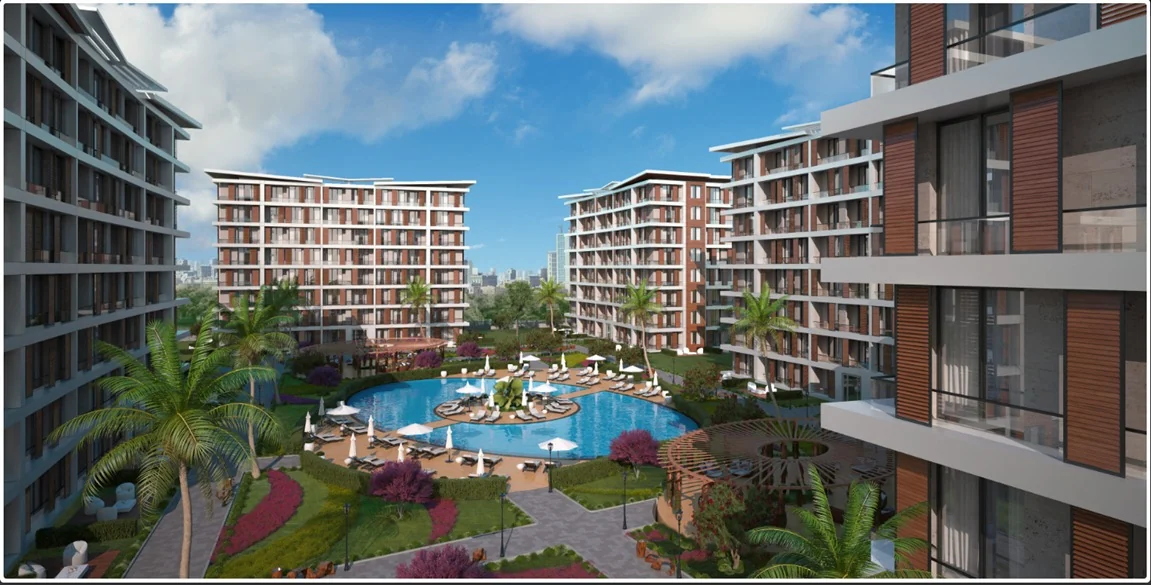
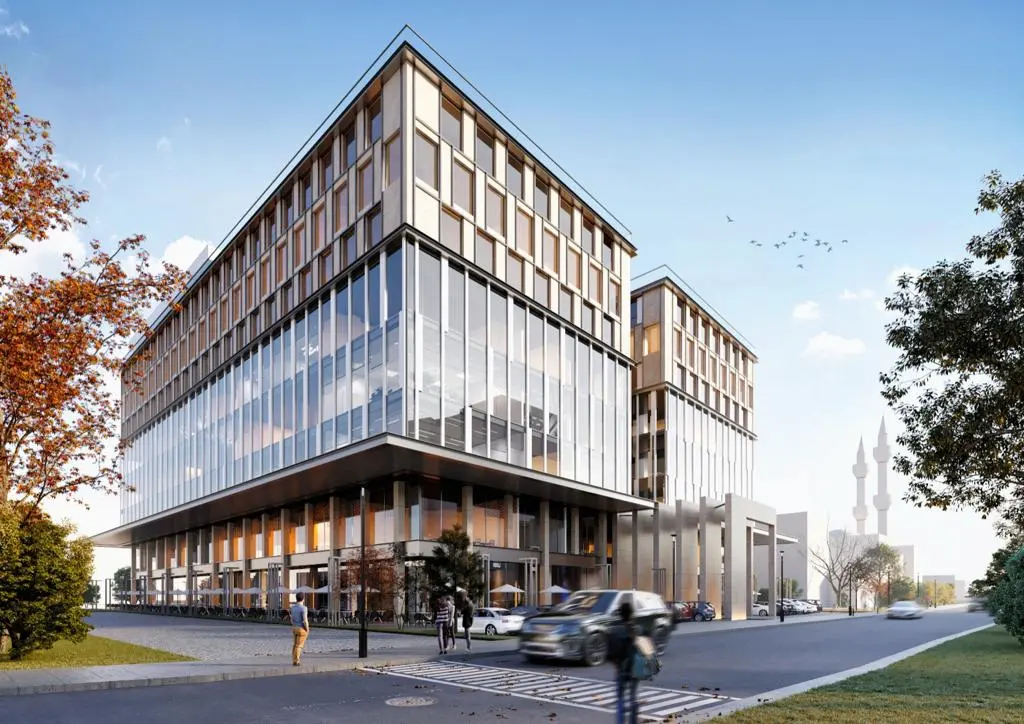
Projects Have same ROI in This Area
.webp)
.webp)

.webp)
Have Question Or Suggestion ?
Please Share Your Thought, To Make It Real