Return on Investment In Turkey
We are providing a financial metric for real estate investors as it helps them to determine the profitability of their real estate investment in Turkey
629$
Average Income
338$ - 921$
Min Income - Max Income
62,143$
Cash Price
| Year | Annual Increase | Monthly ROI | Annual ROI |
|---|---|---|---|
| 1 | 12.15 % | 629$ | 7,549$ |
| 2 | 15.18 % | 786$ | 9,436$ |
| 3 | 18.98 % | 983$ | 11,795$ |
| 4 | 23.73 % | 1,229$ | 14,744$ |
| 5 | 29.66 % | 1,536$ | 18,430$ |
| 6 | 37.07 % | 1,920$ | 23,038$ |
| 7 | 46.34 % | 2,400$ | 28,797$ |
| 8 | 57.92 % | 3,000$ | 35,996$ |
| 9 | 72.41 % | 3,750$ | 44,995$ |
| 10 | 90.51 % | 4,687$ | 56,244$ |
251,024$ 403%
Total ROI For 10 Years
921$
Max Income
62,143$
Cash Price
| Year | Annual Increase | Monthly ROI | Annual ROI |
|---|---|---|---|
| 1 | 17.78 % | 921$ | 11,047$ |
| 2 | 22.22 % | 1,151$ | 13,809$ |
| 3 | 27.78 % | 1,438$ | 17,261$ |
| 4 | 34.72 % | 1,798$ | 21,577$ |
| 5 | 43.40 % | 2,248$ | 26,971$ |
| 6 | 54.25 % | 2,809$ | 33,713$ |
| 7 | 67.81 % | 3,512$ | 42,142$ |
| 8 | 84.77 % | 4,390$ | 52,677$ |
| 9 | 105.96 % | 5,487$ | 65,847$ |
| 10 | 132.45 % | 6,859$ | 82,308$ |
367,352$ 591%
Total ROI For 10 Years
338$
Min Income
62,143$
Cash Price
| Year | Annual Increase | Monthly ROI | Annual ROI |
|---|---|---|---|
| 1 | 6.52 % | 338$ | 4,051$ |
| 2 | 8.15 % | 422$ | 5,063$ |
| 3 | 10.18 % | 527$ | 6,329$ |
| 4 | 12.73 % | 659$ | 7,911$ |
| 5 | 15.91 % | 824$ | 9,889$ |
| 6 | 19.89 % | 1,030$ | 12,362$ |
| 7 | 24.87 % | 1,288$ | 15,452$ |
| 8 | 31.08 % | 1,610$ | 19,315$ |
| 9 | 38.85 % | 2,012$ | 24,144$ |
| 10 | 48.56 % | 2,515$ | 30,180$ |
134,696$ 216%
Total ROI For 10 Years
District Classification
Rating
a
Area map
Statistics
Population
331,525
Social Status
Married : 51%
Unmarried : 49%
area
37 Km2
Price Changes Over Last 5 Years
1 Year Change
17.71%
3 Year Change
386.7%
5 Year Change
415.4%
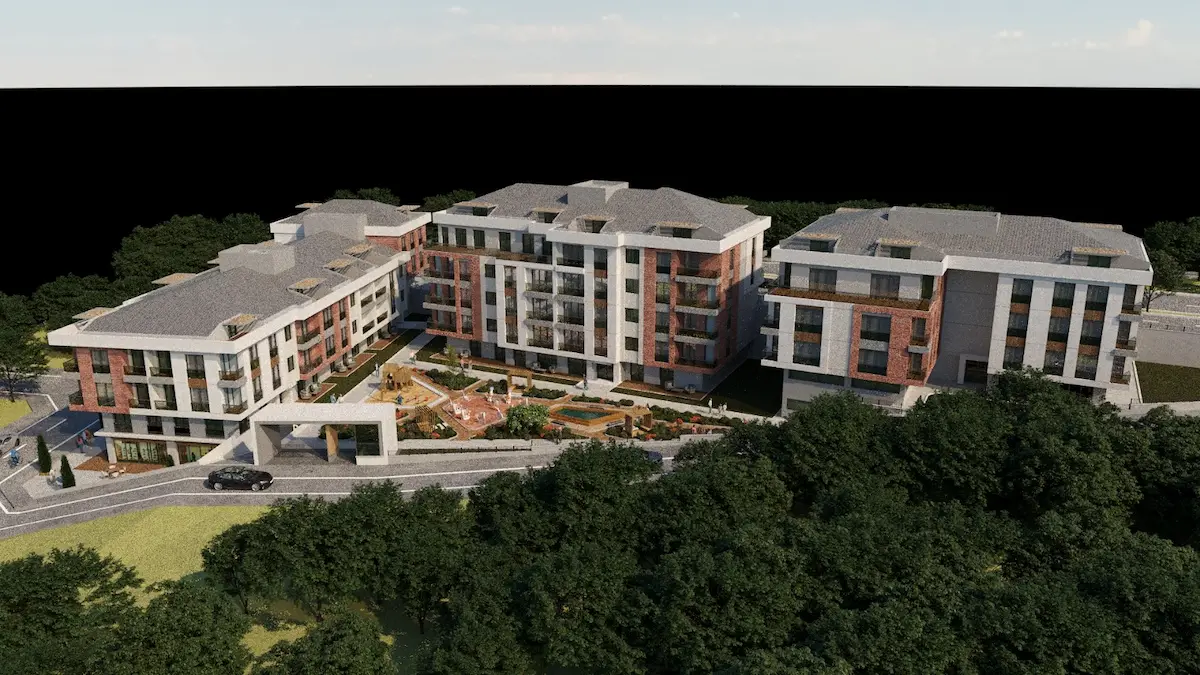
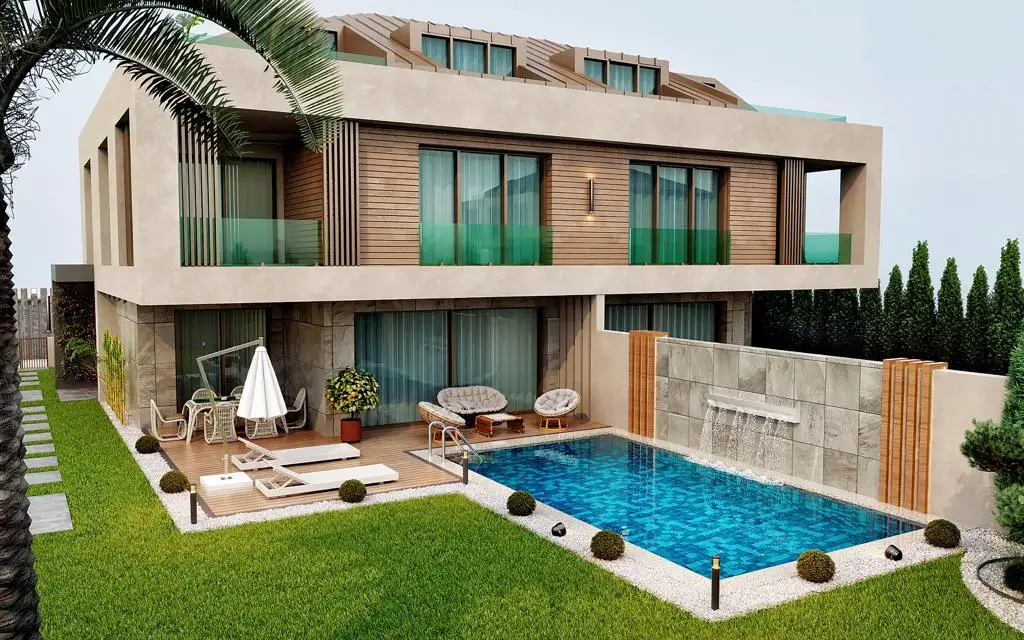
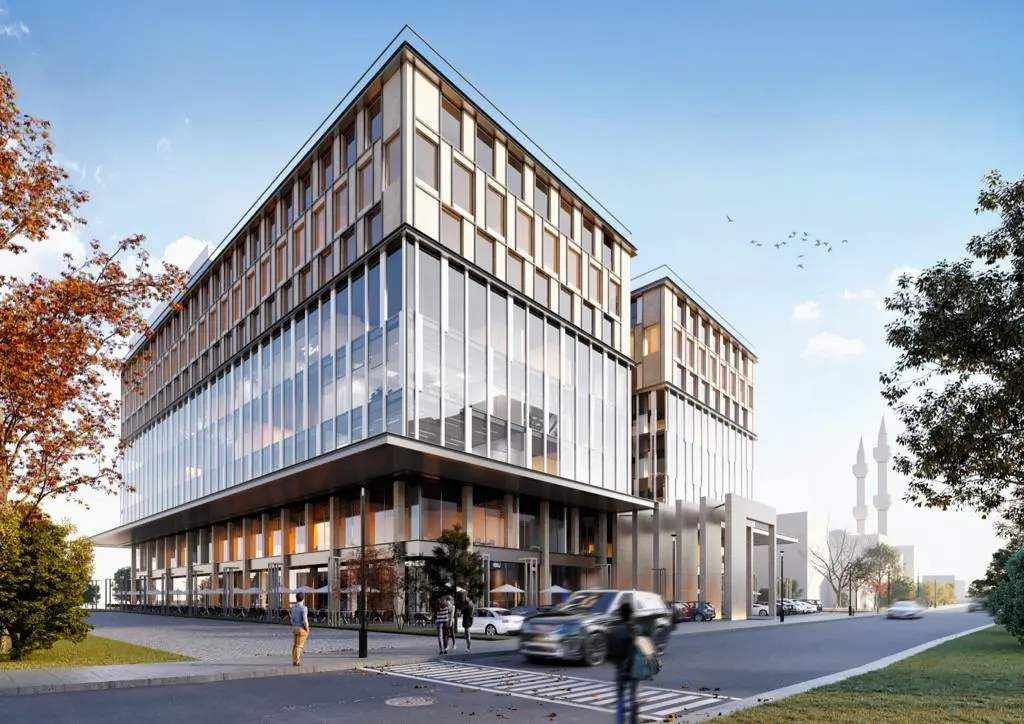
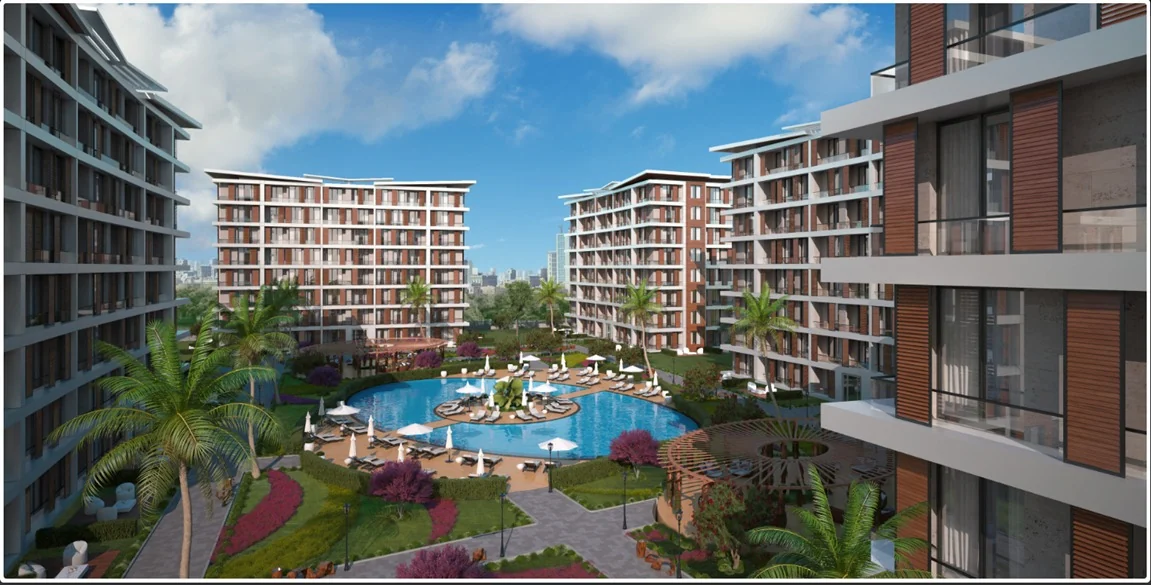
Projects Have same ROI in This Area
.webp)
.webp)


Have Question Or Suggestion ?
Please Share Your Thought, To Make It Real


