Calculate ROI in Turkey Real Estate – Profit Insights
Use our advanced ROI calculator to estimate rental income, investment returns, and property profitability in Turkey based on real-time market data, legal regulations, and current trends. Make smarter investment decisions with confidence.
727$
Average Income
597$ - 856$
Min Income - Max Income
292,000$
Cash Price
| Year | Annual Increase | Monthly ROI | Annual ROI |
|---|---|---|---|
| 1 |
2.99
%
|
727$
|
8,719$
|
| 2 |
4.03
%
|
981$
|
11,771$
|
| 3 |
5.44
%
|
1,324$
|
15,891$
|
| 4 |
7.35
%
|
1,788$
|
21,453$
|
| 5 |
9.92
%
|
2,413$
|
28,962$
|
| 6 |
13.39
%
|
3,258$
|
39,098$
|
| 7 |
18.08
%
|
4,399$
|
52,783$
|
| 8 |
24.40
%
|
5,938$
|
71,257$
|
| 9 |
32.94
%
|
8,016$
|
96,197$
|
| 10 |
44.47
%
|
10,822$
|
129,865$
|
475,996$ 163%
Total ROI For 10 Years
856$
Max Income
292,000$
Cash Price
| Year | Annual Increase | Monthly ROI | Annual ROI |
|---|---|---|---|
| 1 |
3.52
%
|
856$
|
10,272$
|
| 2 |
4.75
%
|
1,156$
|
13,868$
|
| 3 |
6.41
%
|
1,560$
|
18,721$
|
| 4 |
8.66
%
|
2,106$
|
25,274$
|
| 5 |
11.68
%
|
2,843$
|
34,119$
|
| 6 |
15.77
%
|
3,838$
|
46,061$
|
| 7 |
21.30
%
|
5,182$
|
62,182$
|
| 8 |
28.75
%
|
6,996$
|
83,946$
|
| 9 |
38.81
%
|
9,444$
|
113,327$
|
| 10 |
52.39
%
|
12,749$
|
152,992$
|
560,763$ 192%
Total ROI For 10 Years
597$
Min Income
292,000$
Cash Price
| Year | Annual Increase | Monthly ROI | Annual ROI |
|---|---|---|---|
| 1 |
2.45
%
|
597$
|
7,167$
|
| 2 |
3.31
%
|
806$
|
9,675$
|
| 3 |
4.47
%
|
1,088$
|
13,061$
|
| 4 |
6.04
%
|
1,469$
|
17,633$
|
| 5 |
8.15
%
|
1,984$
|
23,804$
|
| 6 |
11.01
%
|
2,678$
|
32,136$
|
| 7 |
14.86
%
|
3,615$
|
43,383$
|
| 8 |
20.06
%
|
4,881$
|
58,567$
|
| 9 |
27.08
%
|
6,589$
|
79,066$
|
| 10 |
36.55
%
|
8,895$
|
106,739$
|
391,230$ 133%
Total ROI For 10 Years
District Classification
Rating
a+
Area map
Area Insights & Neighborhood Demographics
Population
236,610
Social Status
Married : 53%
Unmarried : 34%
area
9 Km2
District Property Price Trend (Last 5 Years)
1 Year Change
20.44%
3 Year Change
142%
5 Year Change
180.7%
Projects Have same ROI in This Area
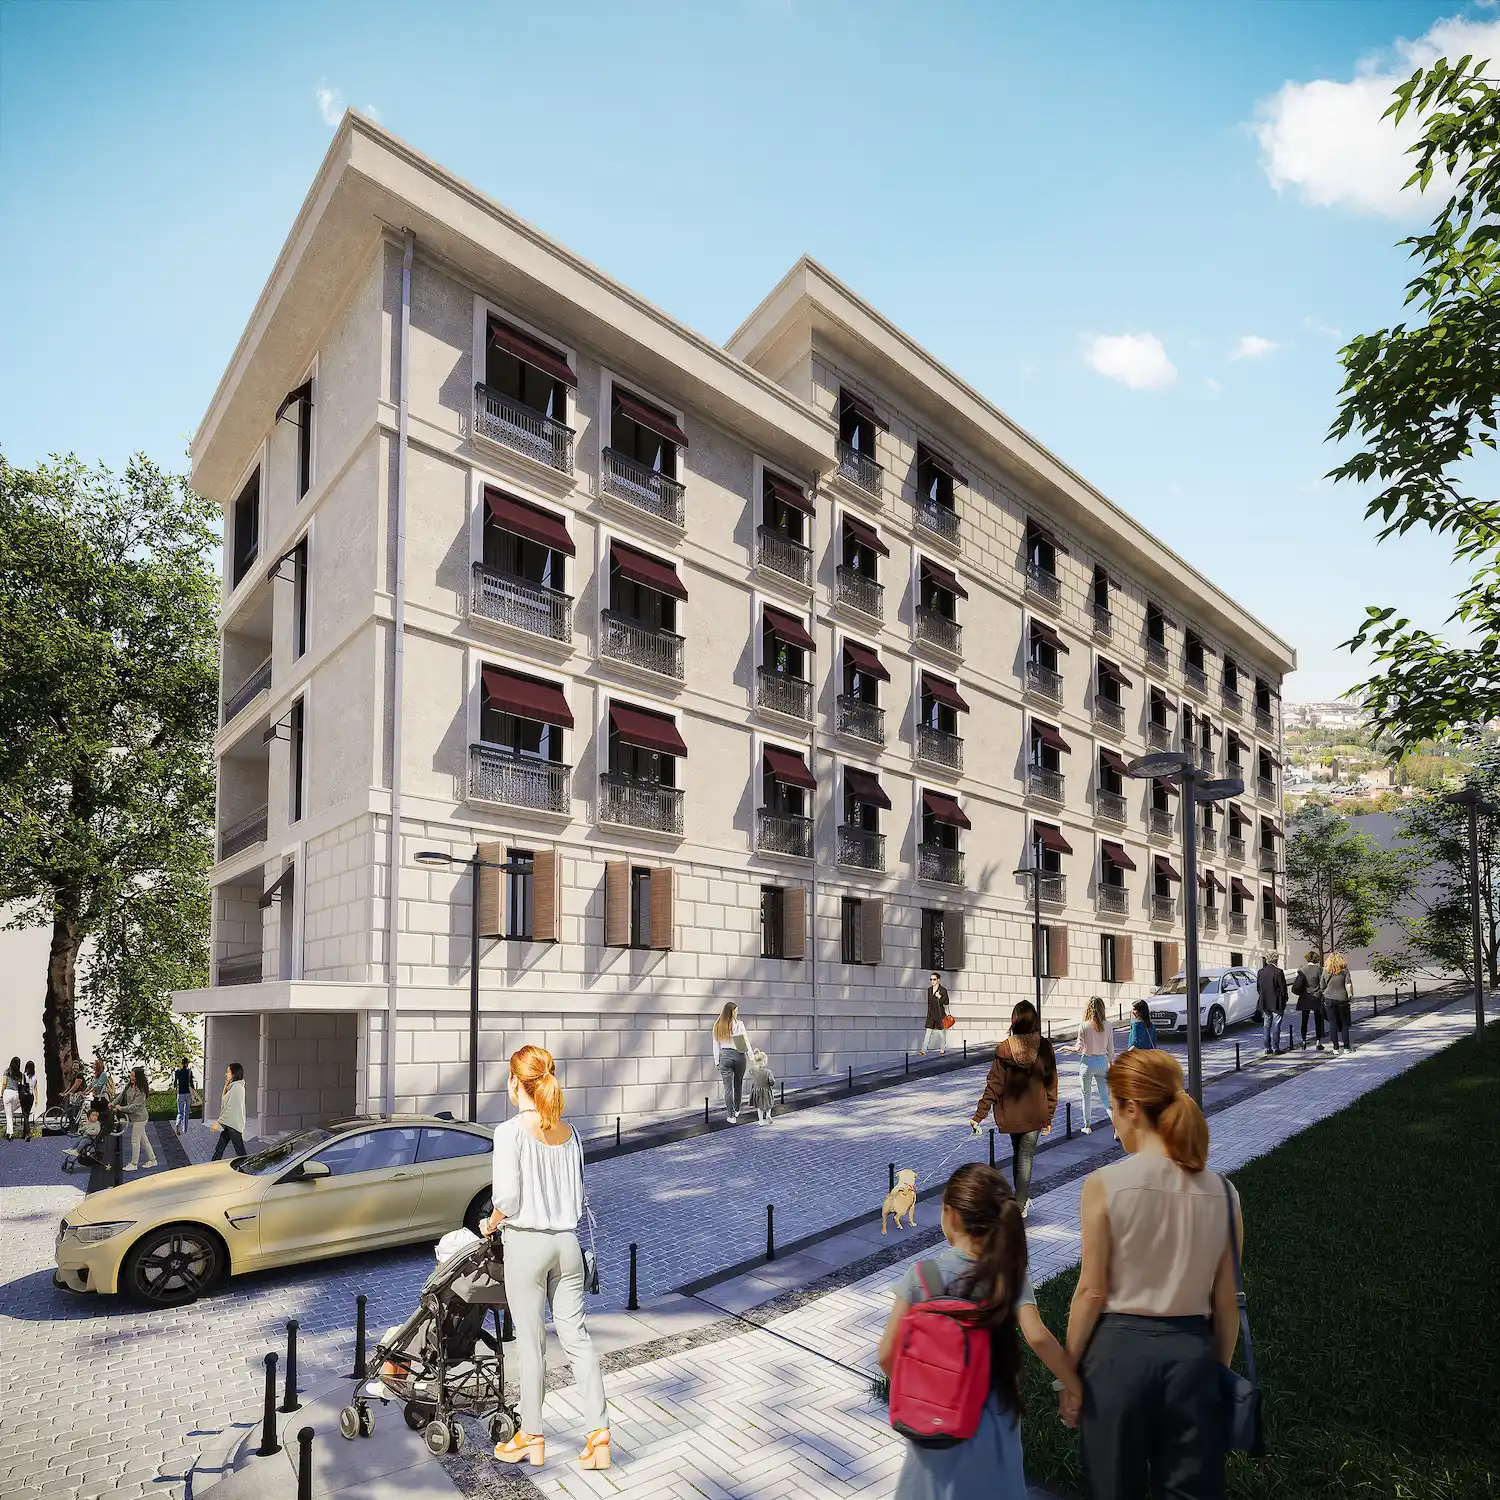


.webp)
Have Question Or Suggestion ?
Please Share Your Thought, To Make It Real