Calculate ROI in Turkey Real Estate – Profit Insights
Use our advanced ROI calculator to estimate rental income, investment returns, and property profitability in Turkey based on real-time market data, legal regulations, and current trends. Make smarter investment decisions with confidence.
397$
Average Income
298$ - 496$
Min Income - Max Income
59,011$
Cash Price
| Year | Annual Increase | Monthly ROI | Annual ROI |
|---|---|---|---|
| 1 |
8.07
%
|
397$
|
4,760$
|
| 2 |
10.89
%
|
536$
|
6,426$
|
| 3 |
14.70
%
|
723$
|
8,676$
|
| 4 |
19.85
%
|
976$
|
11,712$
|
| 5 |
26.79
%
|
1,318$
|
15,811$
|
| 6 |
36.17
%
|
1,779$
|
21,345$
|
| 7 |
48.83
%
|
2,401$
|
28,816$
|
| 8 |
65.92
%
|
3,242$
|
38,902$
|
| 9 |
89.00
%
|
4,376$
|
52,517$
|
| 10 |
120.14
%
|
5,908$
|
70,898$
|
259,863$ 440%
Total ROI For 10 Years
496$
Max Income
59,011$
Cash Price
| Year | Annual Increase | Monthly ROI | Annual ROI |
|---|---|---|---|
| 1 |
10.08
%
|
496$
|
5,950$
|
| 2 |
13.61
%
|
669$
|
8,033$
|
| 3 |
18.38
%
|
904$
|
10,844$
|
| 4 |
24.81
%
|
1,220$
|
14,640$
|
| 5 |
33.49
%
|
1,647$
|
19,764$
|
| 6 |
45.21
%
|
2,223$
|
26,681$
|
| 7 |
61.04
%
|
3,002$
|
36,020$
|
| 8 |
82.40
%
|
4,052$
|
48,627$
|
| 9 |
111.24
%
|
5,471$
|
65,646$
|
| 10 |
150.18
%
|
7,385$
|
88,623$
|
324,829$ 550%
Total ROI For 10 Years
298$
Min Income
59,011$
Cash Price
| Year | Annual Increase | Monthly ROI | Annual ROI |
|---|---|---|---|
| 1 |
6.05
%
|
298$
|
3,570$
|
| 2 |
8.17
%
|
402$
|
4,820$
|
| 3 |
11.03
%
|
542$
|
6,507$
|
| 4 |
14.89
%
|
732$
|
8,784$
|
| 5 |
20.10
%
|
988$
|
11,858$
|
| 6 |
27.13
%
|
1,334$
|
16,009$
|
| 7 |
36.62
%
|
1,801$
|
21,612$
|
| 8 |
49.44
%
|
2,431$
|
29,176$
|
| 9 |
66.75
%
|
3,282$
|
39,388$
|
| 10 |
90.11
%
|
4,431$
|
53,174$
|
194,898$ 330%
Total ROI For 10 Years
District Classification
Rating
b+
Area map
Area Insights & Neighborhood Demographics
Population
846,000
Social Status
Married : 53%
Unmarried : 47%
area
42 Km2
District Property Price Trend (Last 5 Years)
1 Year Change
13.27%
3 Year Change
255.2%
5 Year Change
315.6%
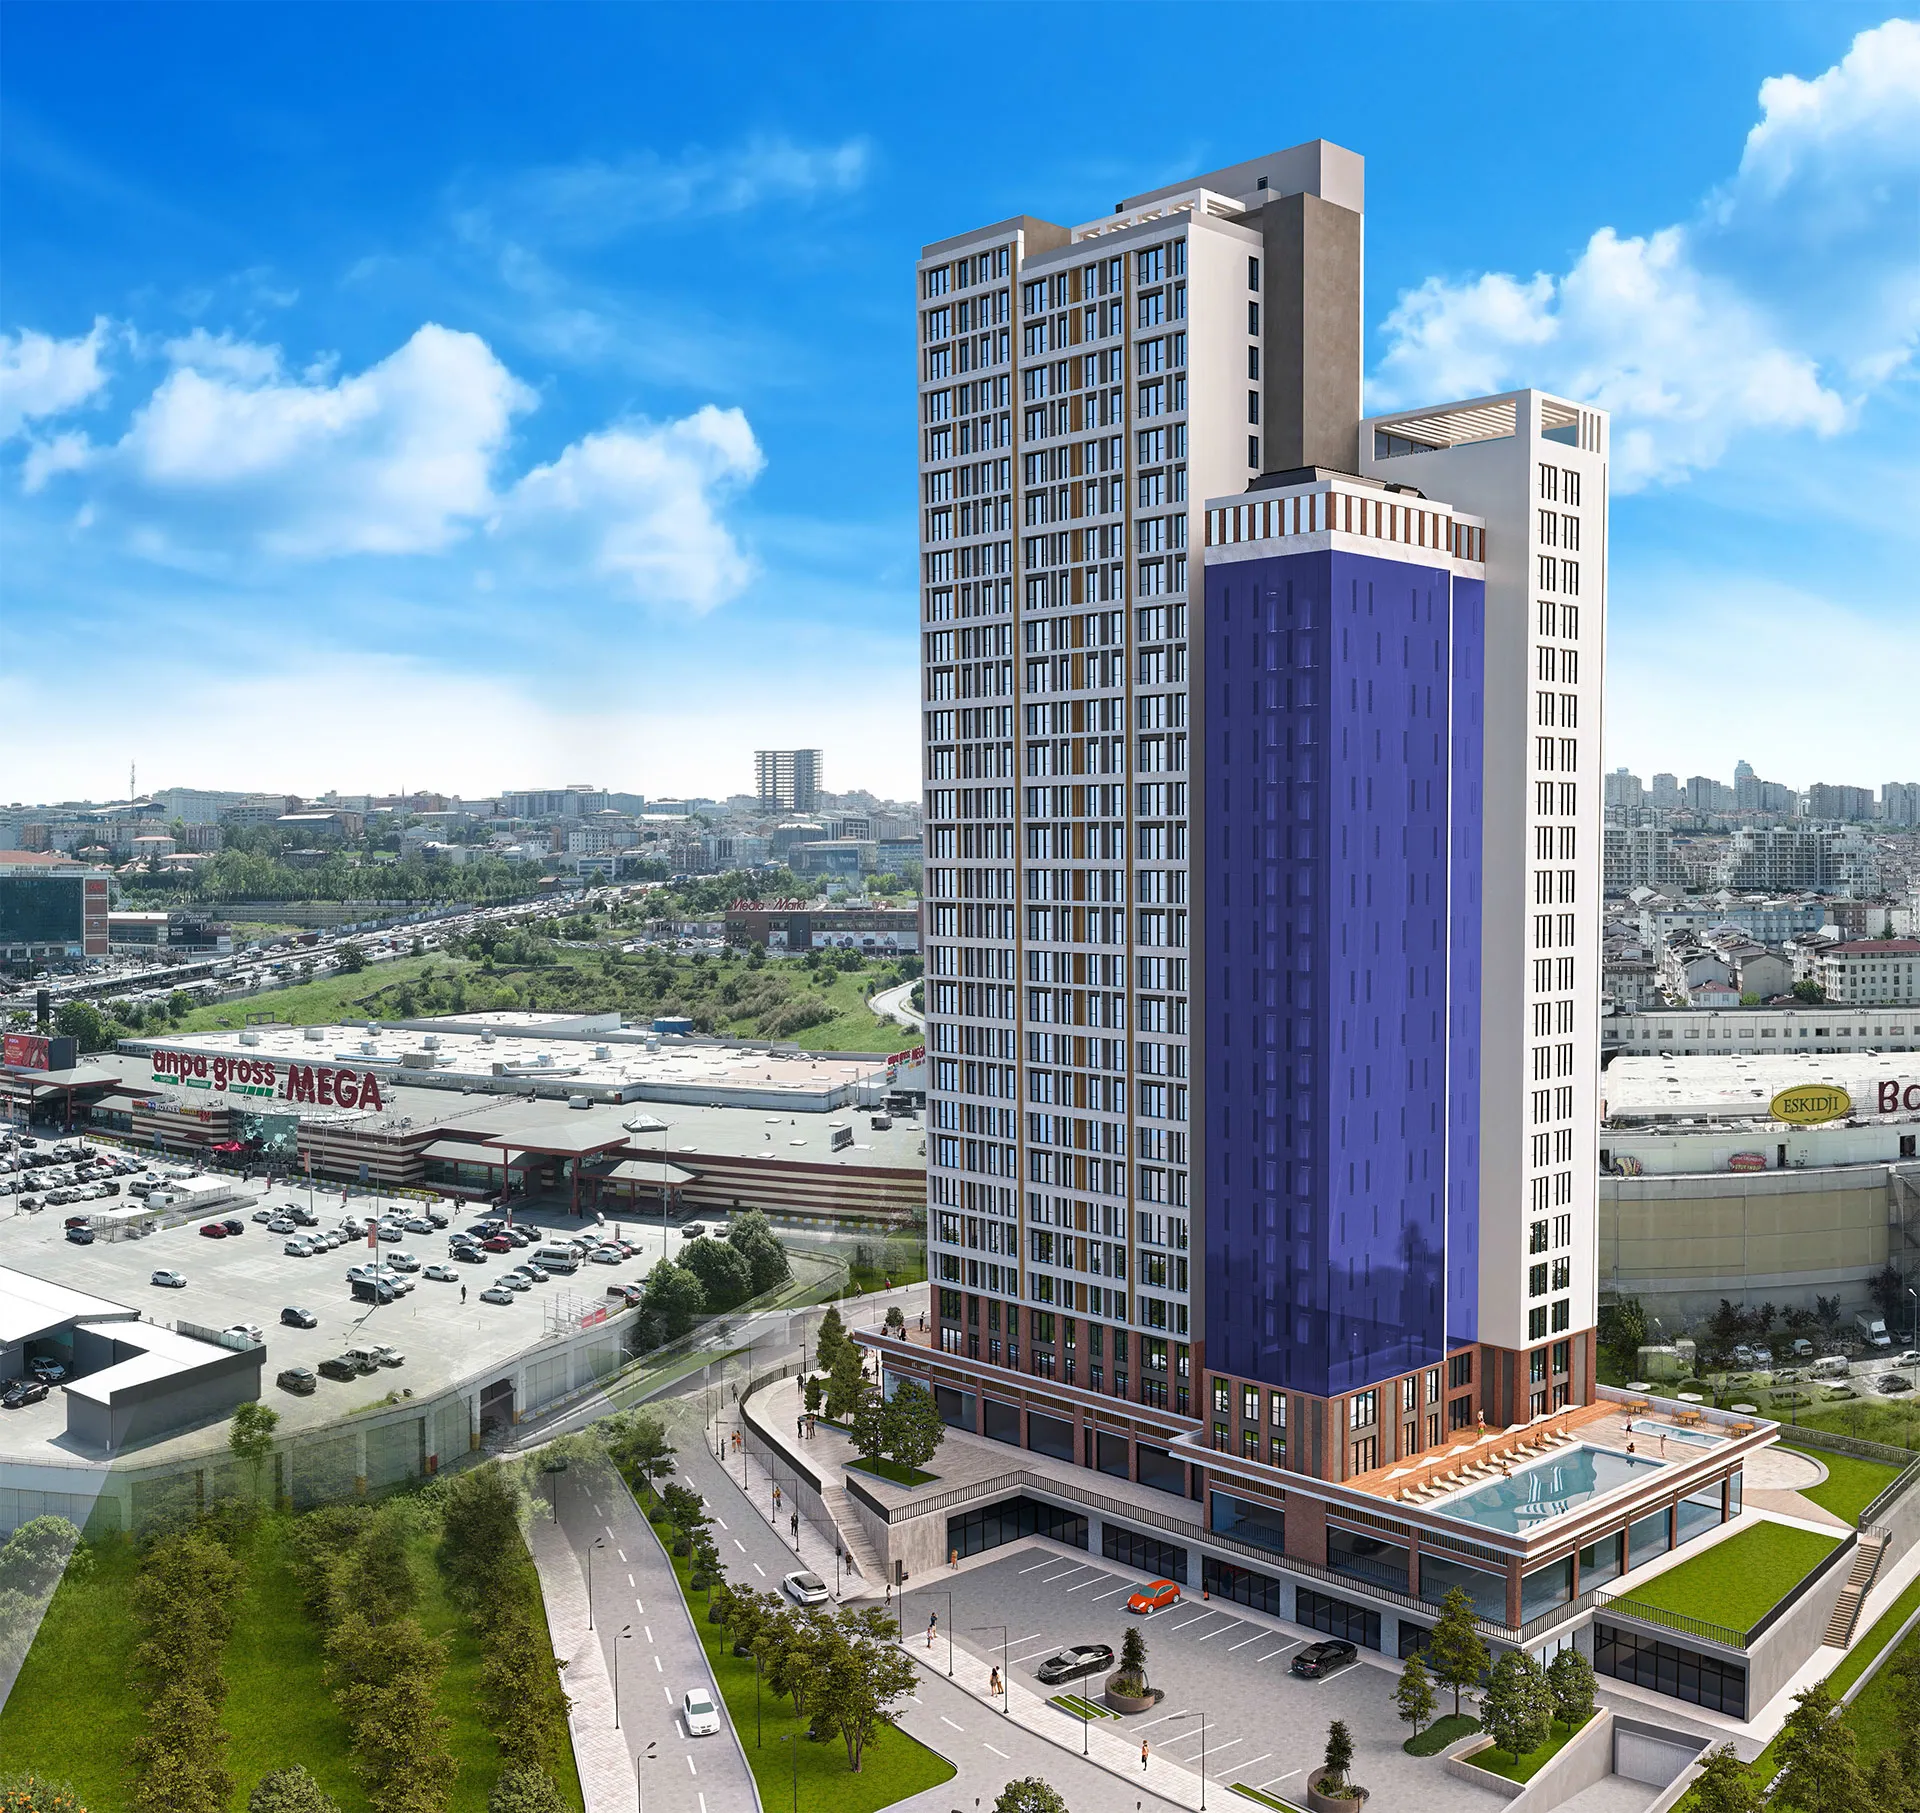
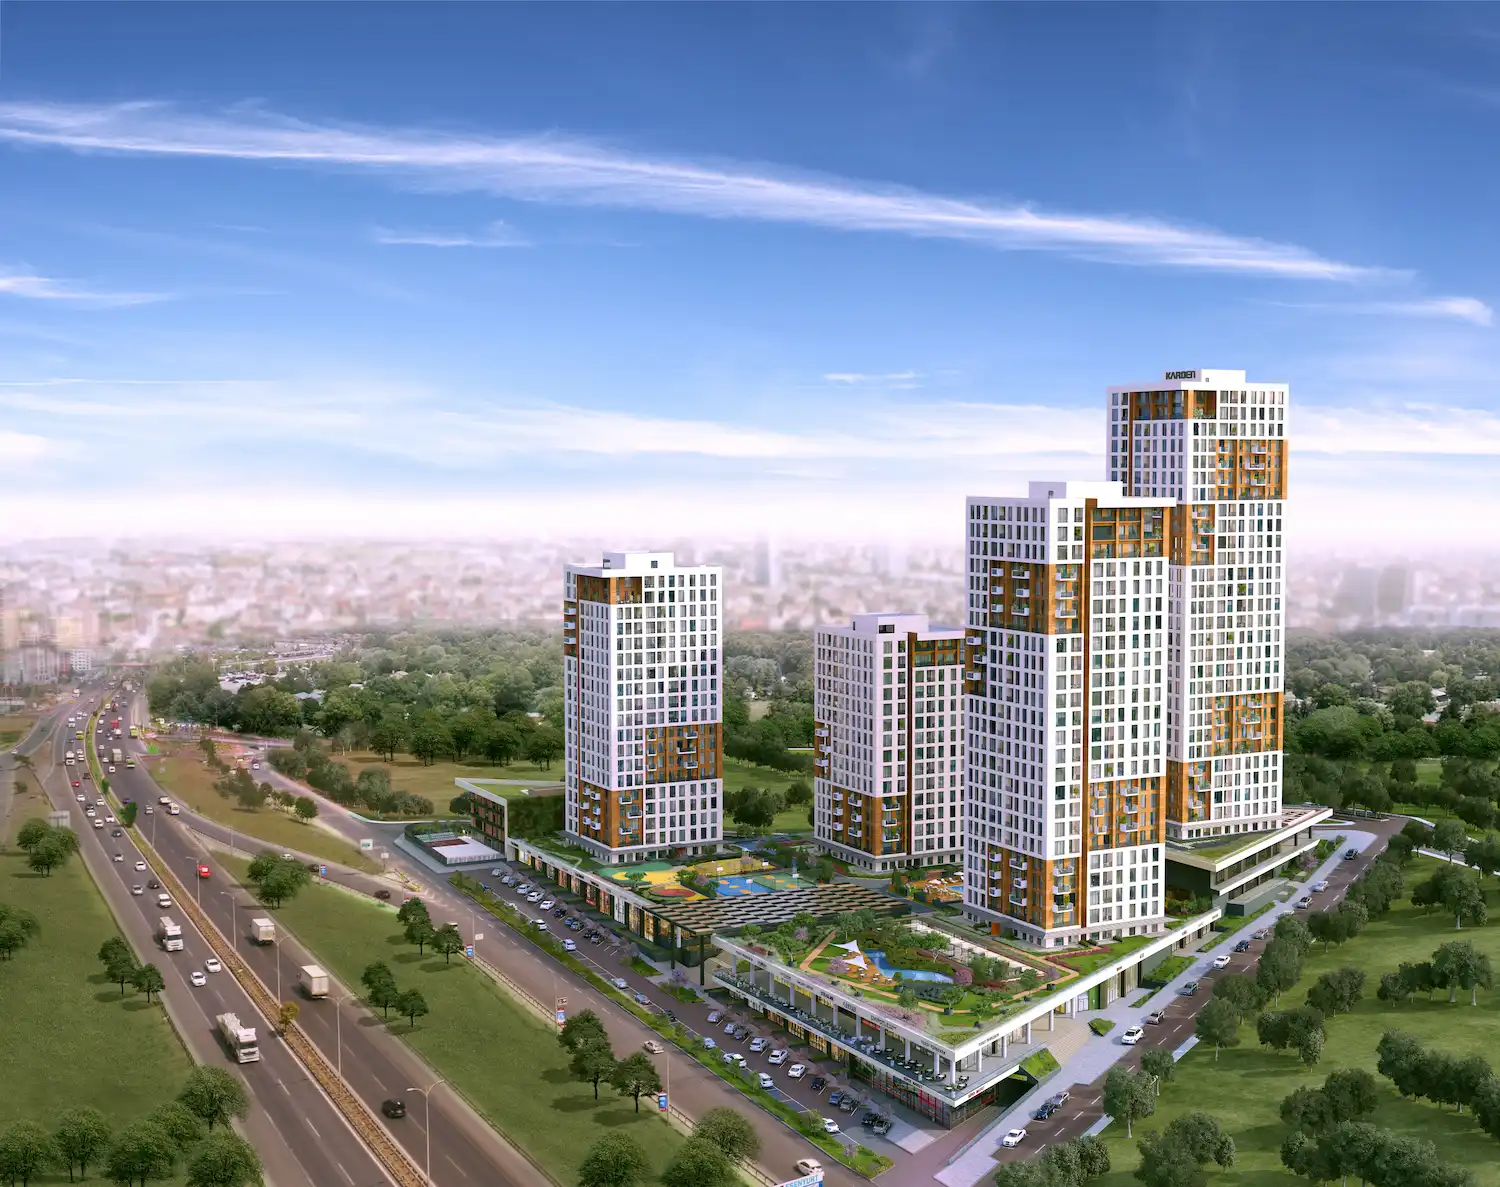
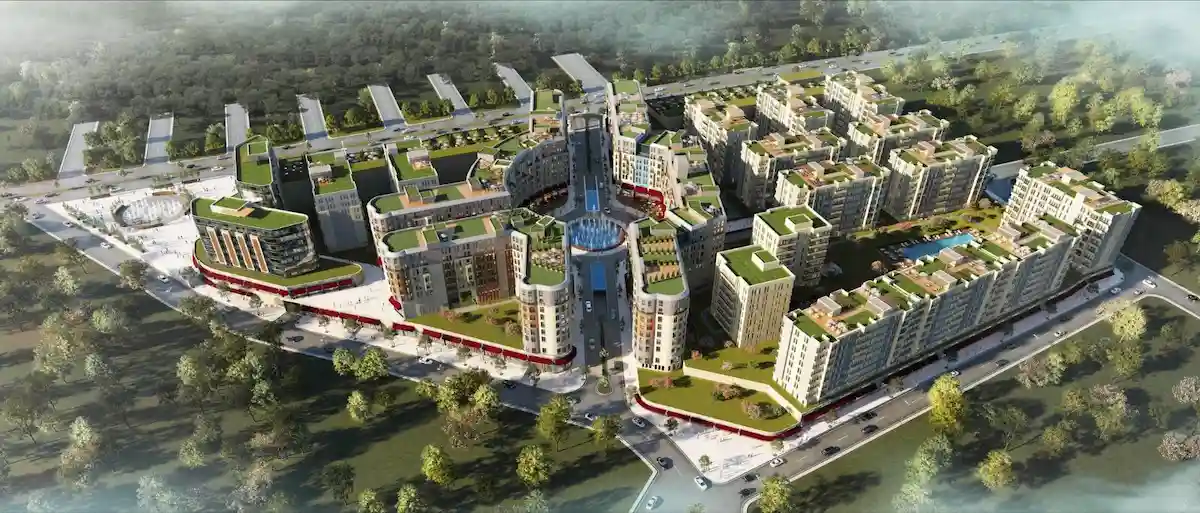
Projects Have same ROI in This Area
.webp)
Have Question Or Suggestion ?
Please Share Your Thought, To Make It Real