Calculate ROI in Turkey Real Estate – Profit Insights
Use our advanced ROI calculator to estimate rental income, investment returns, and property profitability in Turkey based on real-time market data, legal regulations, and current trends. Make smarter investment decisions with confidence.
660$
Average Income
508$ - 813$
Min Income - Max Income
285,000$
Cash Price
| Year | Annual Increase | Monthly ROI | Annual ROI |
|---|---|---|---|
| 1 |
2.78
%
|
660$
|
7,925$
|
| 2 |
3.75
%
|
892$
|
10,699$
|
| 3 |
5.07
%
|
1,204$
|
14,443$
|
| 4 |
6.84
%
|
1,625$
|
19,498$
|
| 5 |
9.24
%
|
2,194$
|
26,322$
|
| 6 |
12.47
%
|
2,961$
|
35,535$
|
| 7 |
16.83
%
|
3,998$
|
47,973$
|
| 8 |
22.72
%
|
5,397$
|
64,763$
|
| 9 |
30.68
%
|
7,286$
|
87,430$
|
| 10 |
41.41
%
|
9,836$
|
118,030$
|
432,618$ 151%
Total ROI For 10 Years
813$
Max Income
285,000$
Cash Price
| Year | Annual Increase | Monthly ROI | Annual ROI |
|---|---|---|---|
| 1 |
3.42
%
|
813$
|
9,754$
|
| 2 |
4.62
%
|
1,097$
|
13,167$
|
| 3 |
6.24
%
|
1,481$
|
17,776$
|
| 4 |
8.42
%
|
2,000$
|
23,998$
|
| 5 |
11.37
%
|
2,700$
|
32,397$
|
| 6 |
15.35
%
|
3,645$
|
43,736$
|
| 7 |
20.72
%
|
4,920$
|
59,043$
|
| 8 |
27.97
%
|
6,642$
|
79,708$
|
| 9 |
37.76
%
|
8,967$
|
107,606$
|
| 10 |
50.97
%
|
12,106$
|
145,268$
|
532,453$ 186%
Total ROI For 10 Years
508$
Min Income
285,000$
Cash Price
| Year | Annual Increase | Monthly ROI | Annual ROI |
|---|---|---|---|
| 1 |
2.14
%
|
508$
|
6,096$
|
| 2 |
2.89
%
|
686$
|
8,230$
|
| 3 |
3.90
%
|
926$
|
11,110$
|
| 4 |
5.26
%
|
1,250$
|
14,999$
|
| 5 |
7.10
%
|
1,687$
|
20,248$
|
| 6 |
9.59
%
|
2,278$
|
27,335$
|
| 7 |
12.95
%
|
3,075$
|
36,902$
|
| 8 |
17.48
%
|
4,151$
|
49,818$
|
| 9 |
23.60
%
|
5,604$
|
67,254$
|
| 10 |
31.86
%
|
7,566$
|
90,793$
|
332,783$ 116%
Total ROI For 10 Years
District Classification
Rating
a
Area map
Area Insights & Neighborhood Demographics
Population
442,690
Social Status
Married : 58%
Unmarried : 31%
area
15 Km2
District Property Price Trend (Last 5 Years)
1 Year Change
13.59%
3 Year Change
255.1%
5 Year Change
294.1%
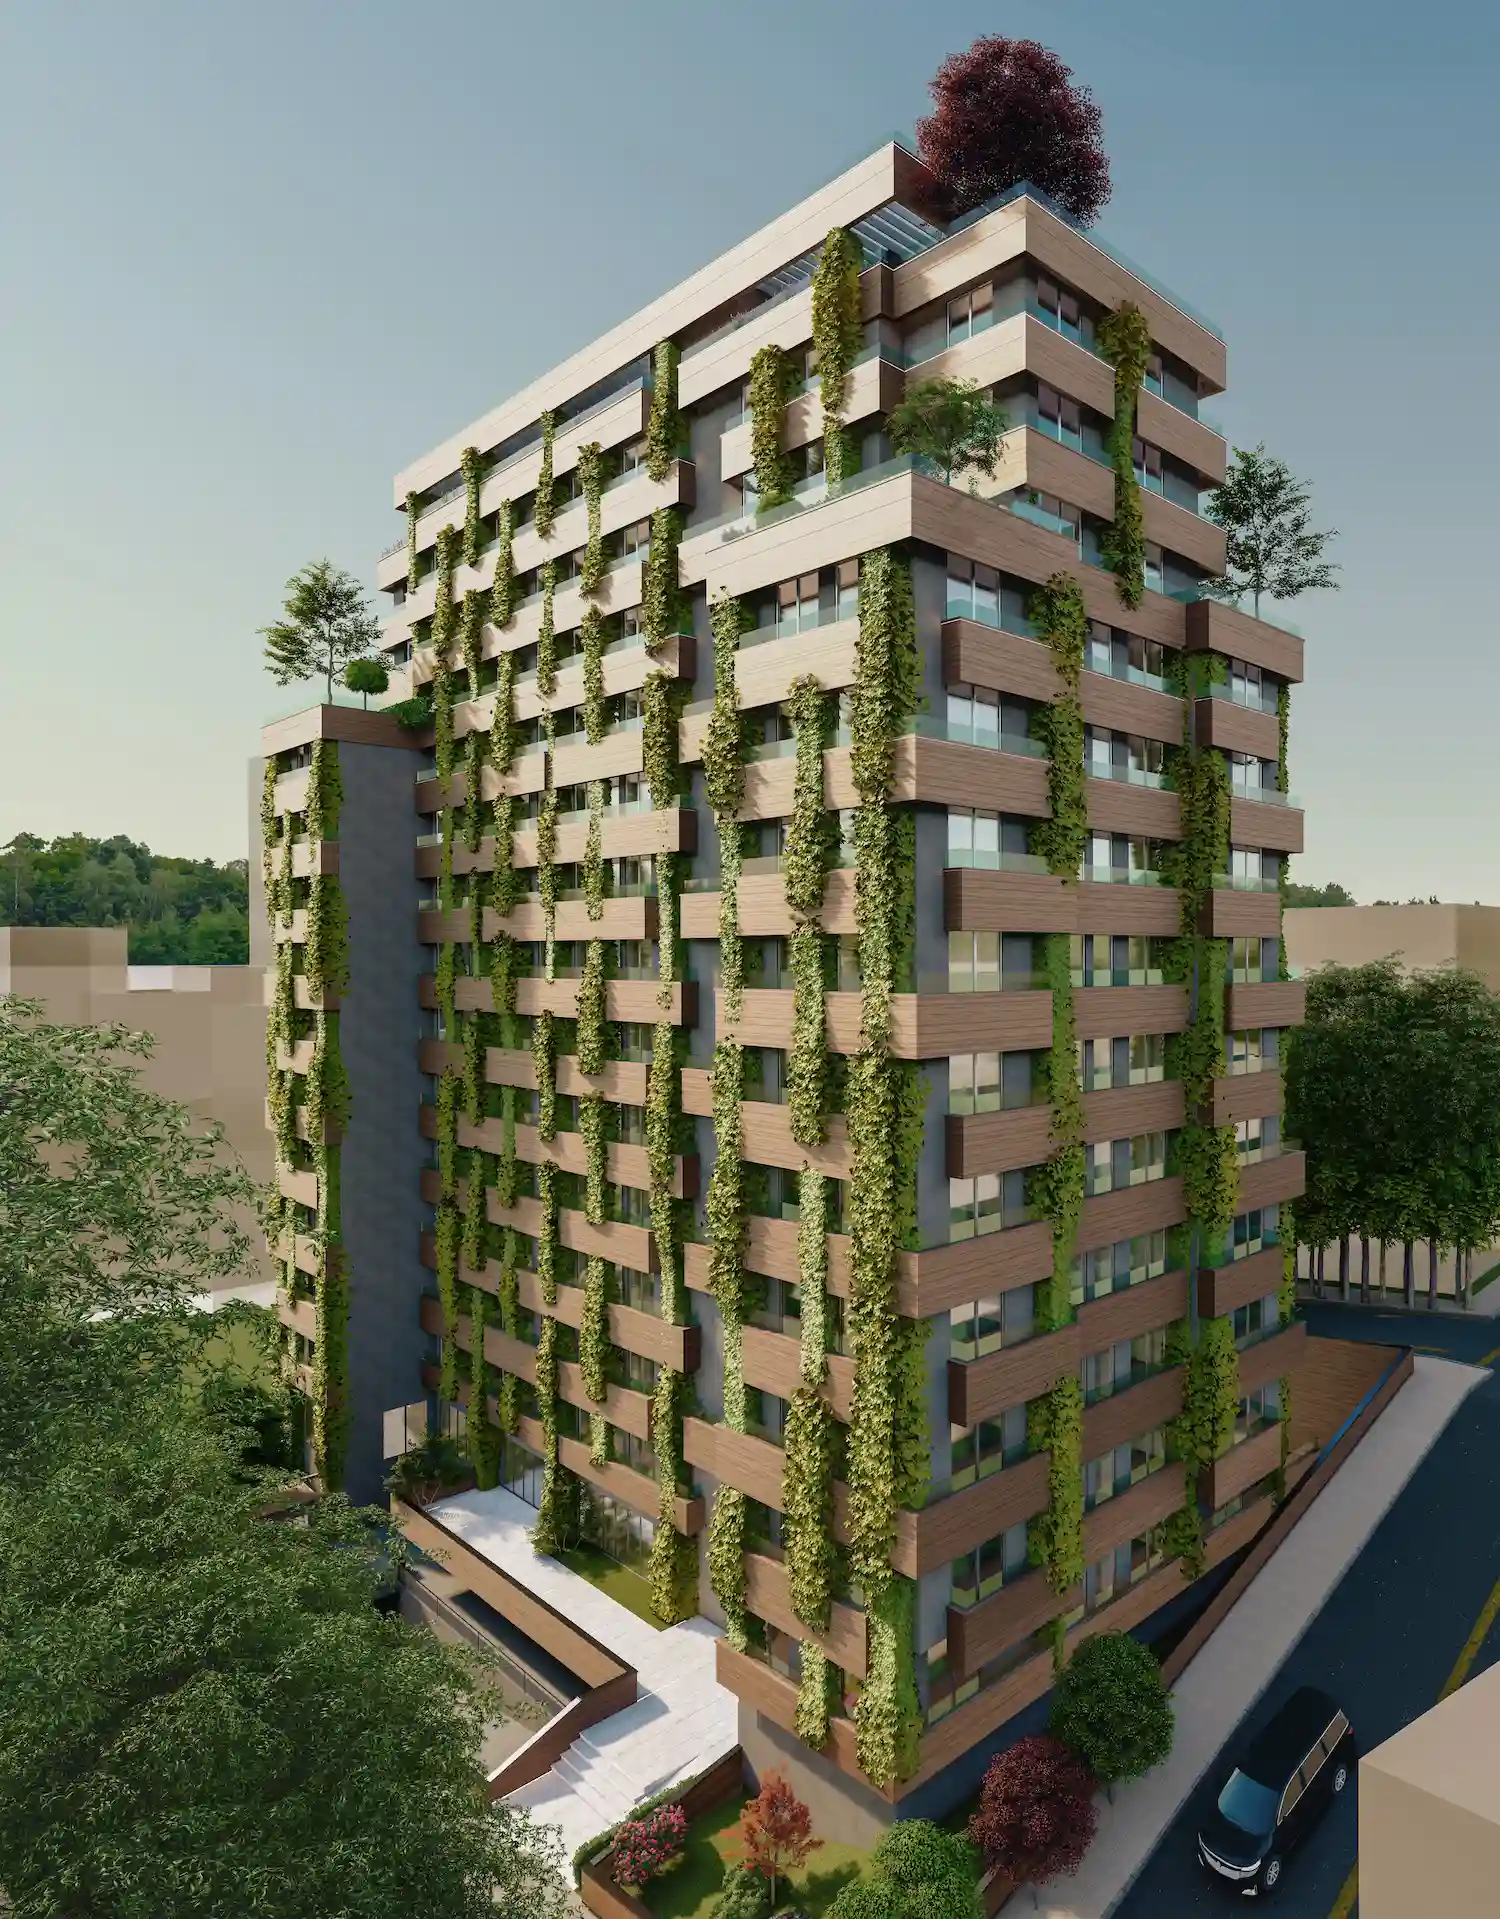
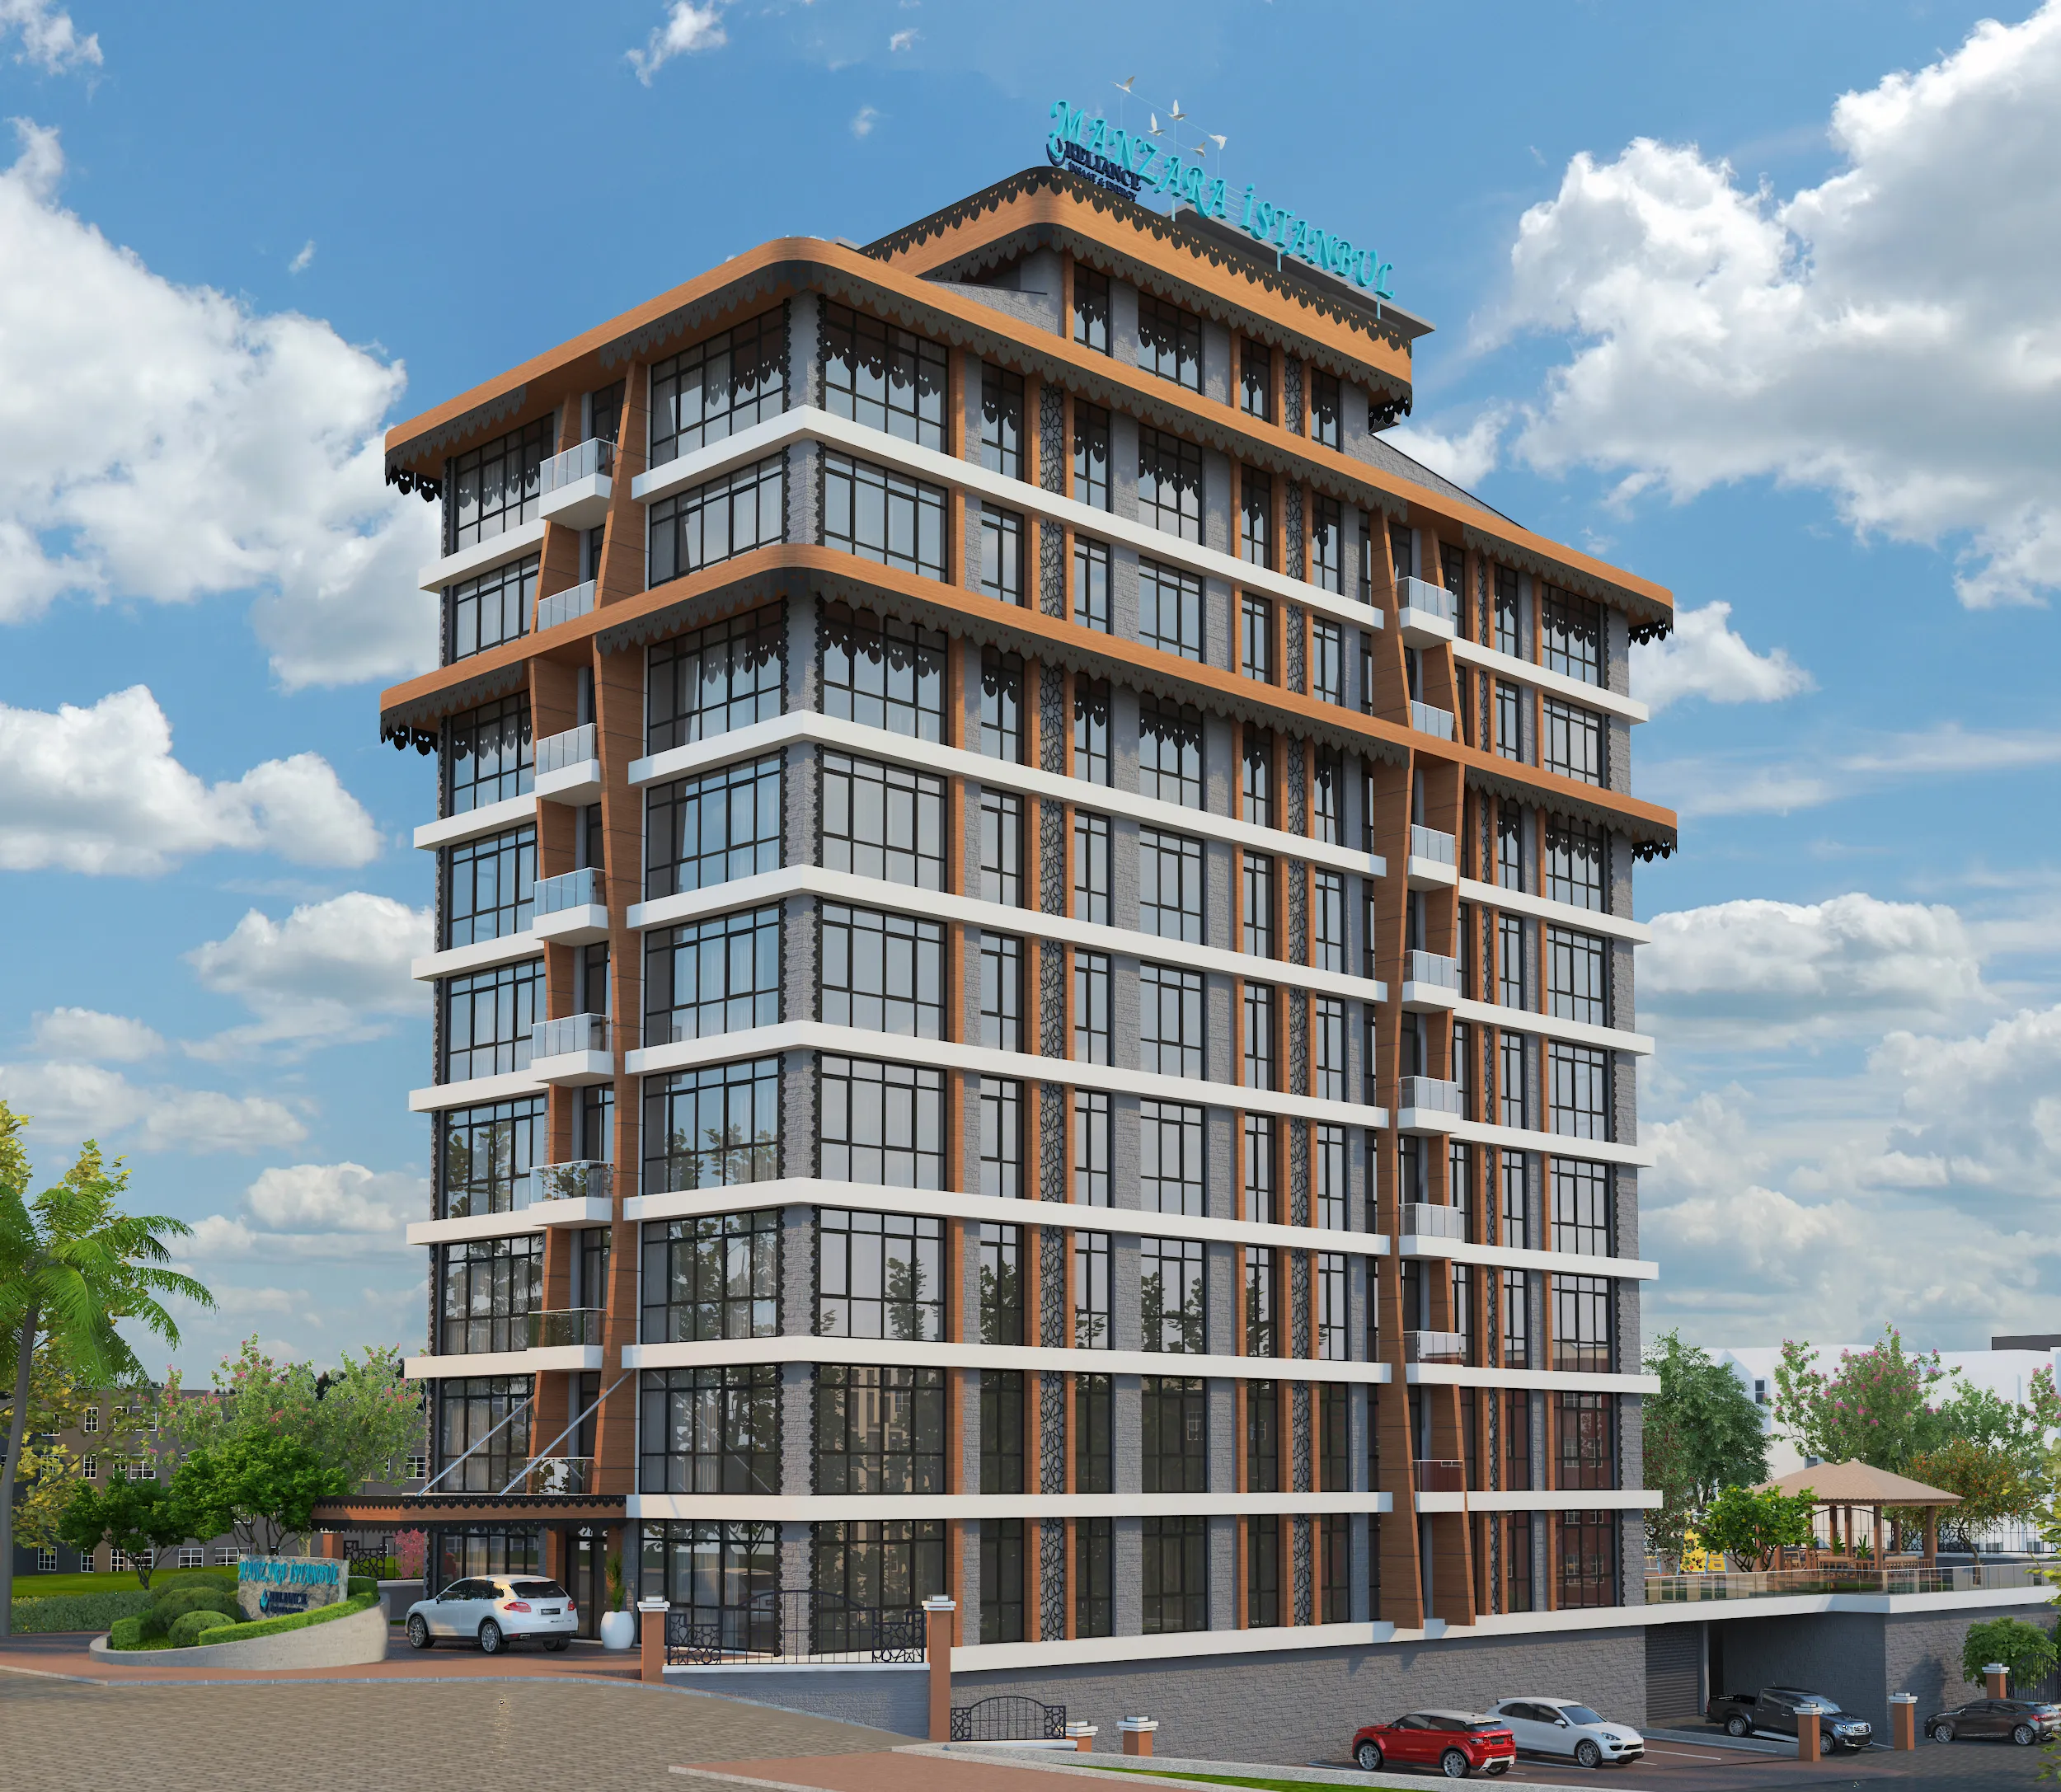
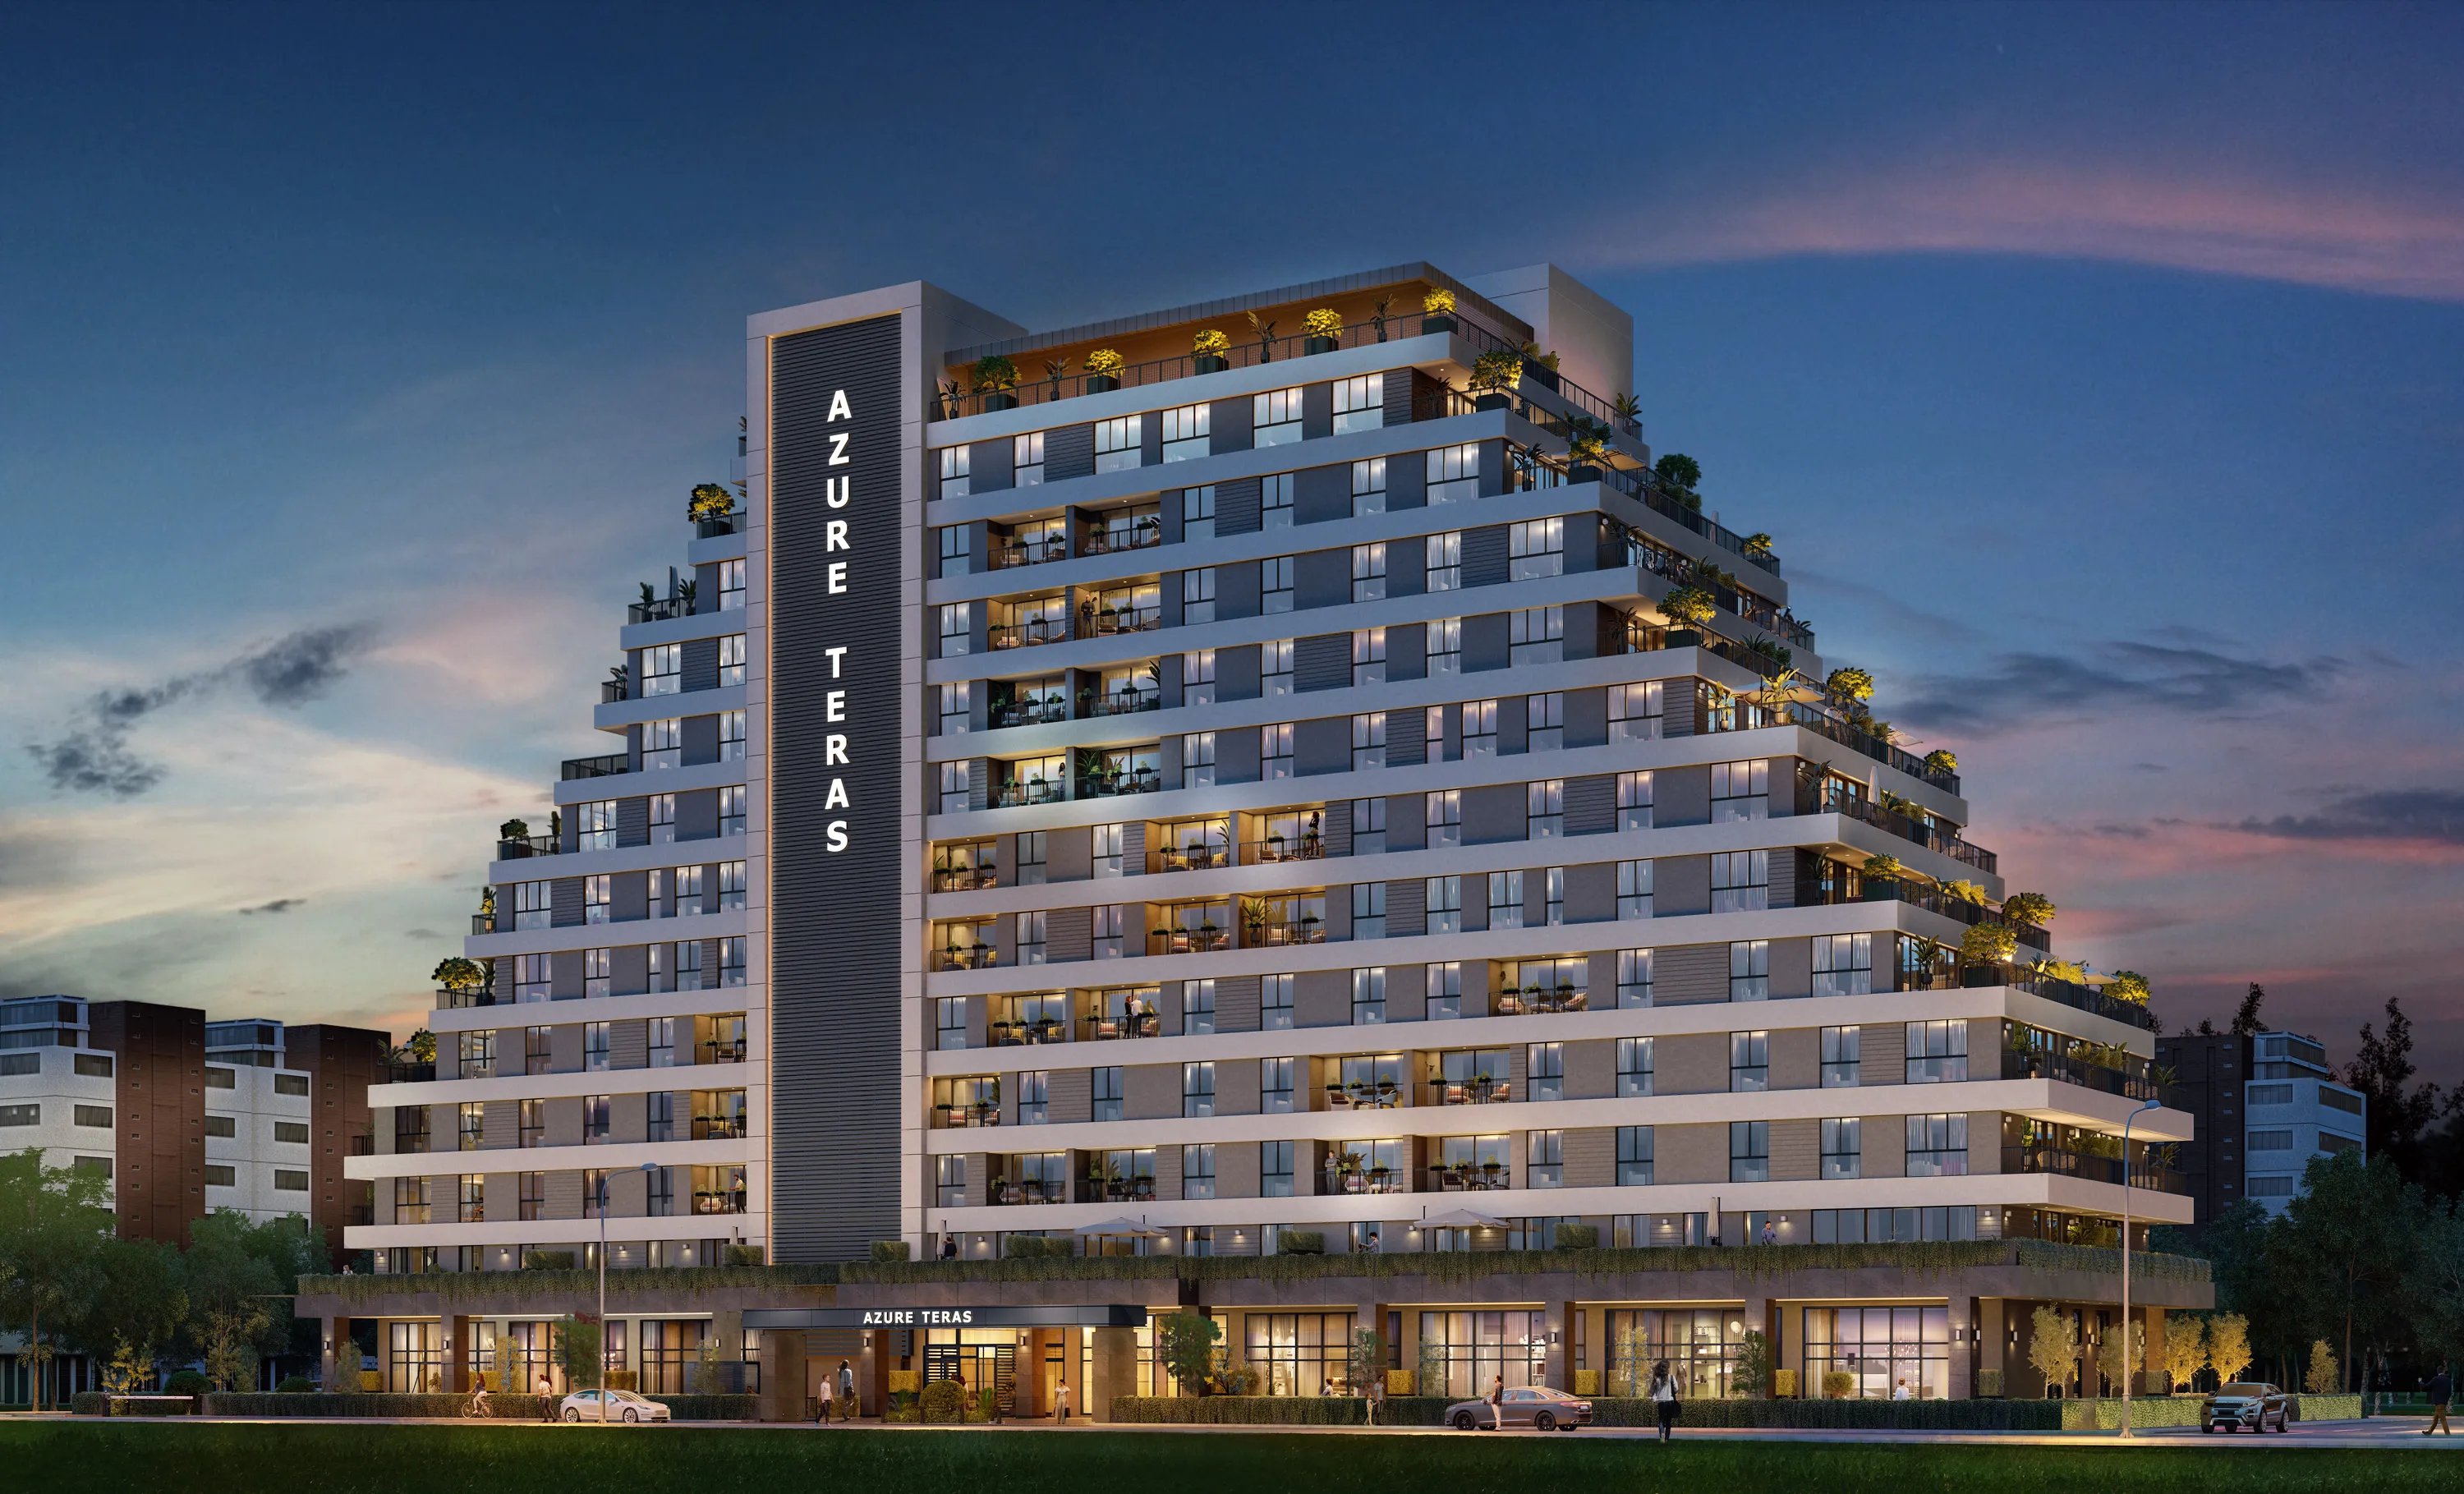
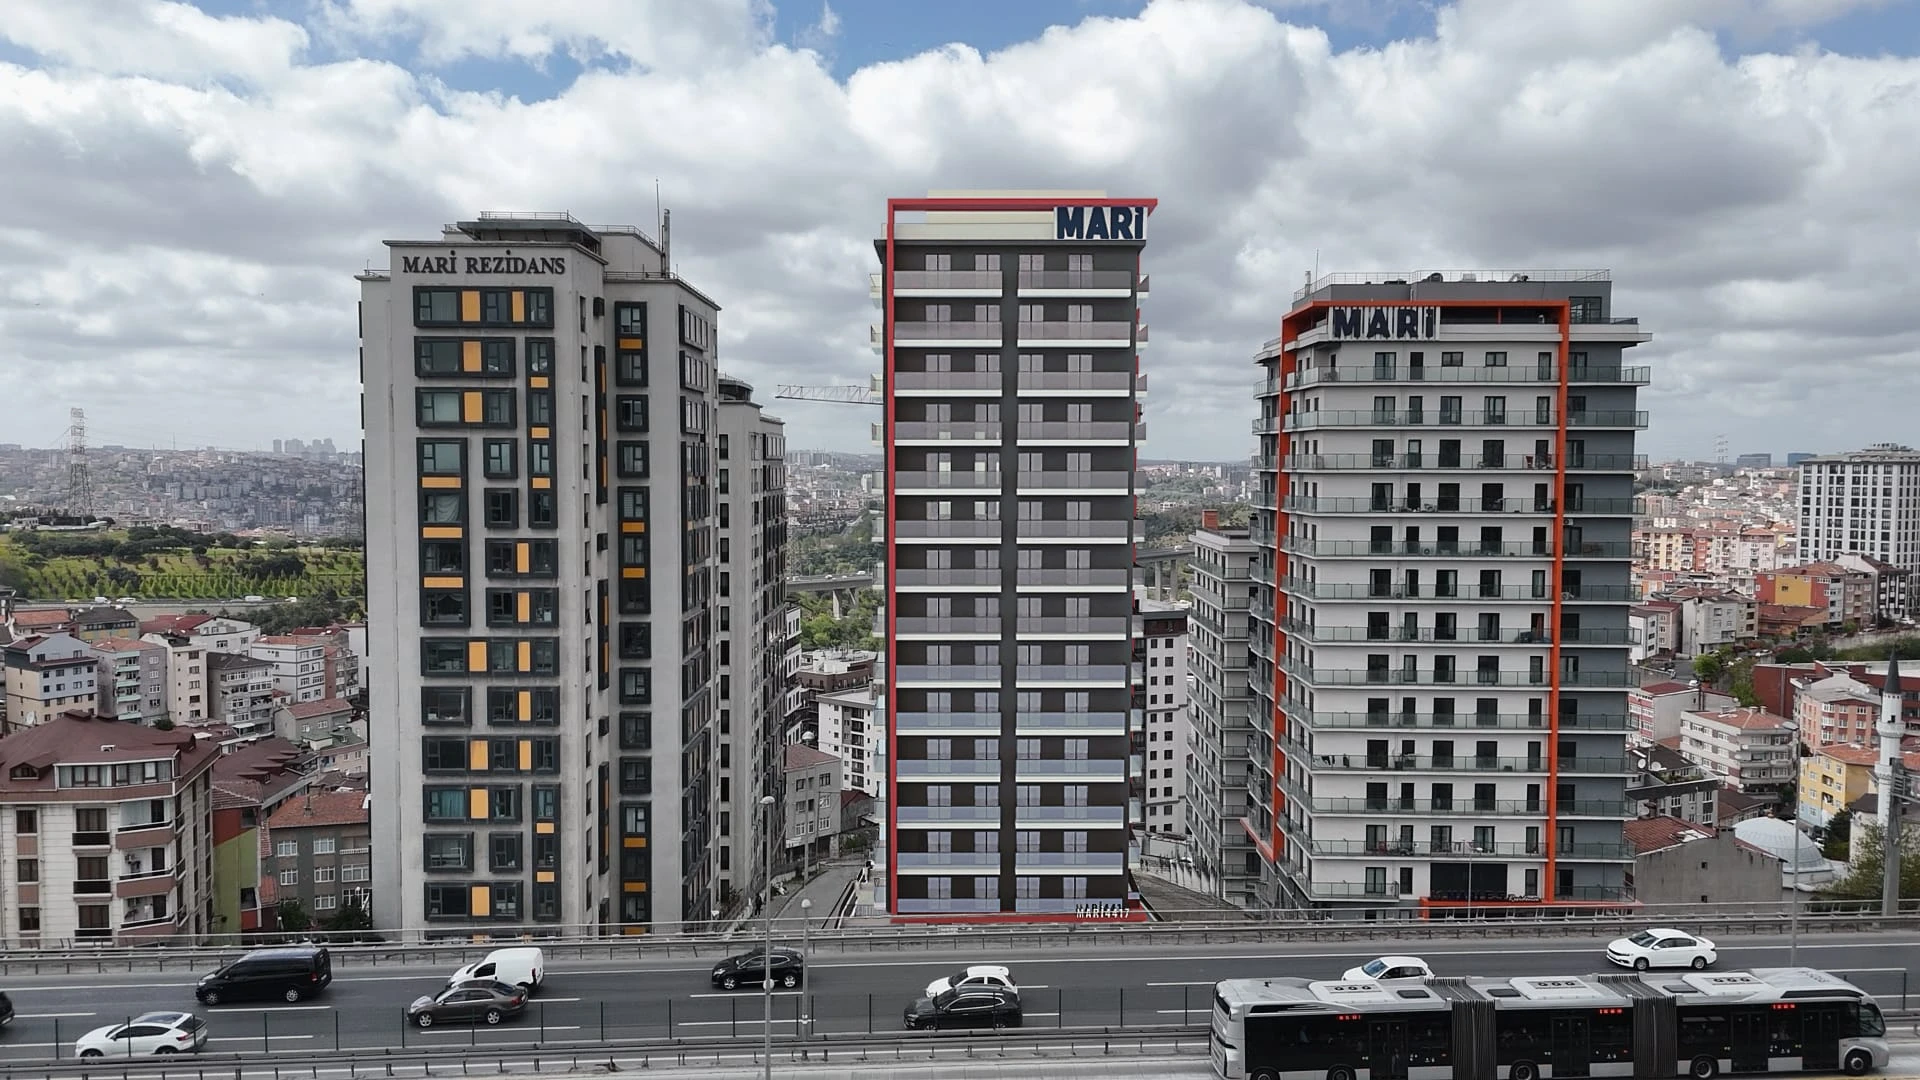
Projects Have same ROI in This Area
.webp)
.webp)
Have Question Or Suggestion ?
Please Share Your Thought, To Make It Real