Return on Investment In Turkey
We are providing a financial metric for real estate investors as it helps them to determine the profitability of their real estate investment in Turkey
769€
Average Income
484€ - 1,053€
Min Income - Max Income
339€
Cash Price
| Year | Annual Increase | Monthly ROI | Annual ROI |
|---|---|---|---|
| 1 | 2,722.12 % | 769€ | 9,224€ |
| 2 | 3,402.65 % | 961€ | 11,530€ |
| 3 | 4,253.31 % | 1,201€ | 14,412€ |
| 4 | 5,316.63 % | 1,501€ | 18,015€ |
| 5 | 6,645.79 % | 1,877€ | 22,519€ |
| 6 | 8,307.24 % | 2,346€ | 28,148€ |
| 7 | 10,384.05 % | 2,932€ | 35,185€ |
| 8 | 12,980.06 % | 3,665€ | 43,982€ |
| 9 | 16,225.08 % | 4,581€ | 54,977€ |
| 10 | 20,281.35 % | 5,727€ | 68,721€ |
306,712€ 90,518%
Total ROI For 10 Years
1,053€
Max Income
339€
Cash Price
| Year | Annual Increase | Monthly ROI | Annual ROI |
|---|---|---|---|
| 1 | 3,730.31 % | 1,053€ | 12,640€ |
| 2 | 4,662.88 % | 1,317€ | 15,800€ |
| 3 | 5,828.61 % | 1,646€ | 19,750€ |
| 4 | 7,285.76 % | 2,057€ | 24,687€ |
| 5 | 9,107.20 % | 2,572€ | 30,859€ |
| 6 | 11,384.00 % | 3,214€ | 38,574€ |
| 7 | 14,230.00 % | 4,018€ | 48,217€ |
| 8 | 17,787.49 % | 5,023€ | 60,271€ |
| 9 | 22,234.37 % | 6,278€ | 75,339€ |
| 10 | 27,792.96 % | 7,848€ | 94,174€ |
420,309€ 124,043%
Total ROI For 10 Years
484€
Min Income
339€
Cash Price
| Year | Annual Increase | Monthly ROI | Annual ROI |
|---|---|---|---|
| 1 | 1,713.93 % | 484€ | 5,807€ |
| 2 | 2,142.41 % | 605€ | 7,259€ |
| 3 | 2,678.01 % | 756€ | 9,074€ |
| 4 | 3,347.51 % | 945€ | 11,343€ |
| 5 | 4,184.39 % | 1,182€ | 14,178€ |
| 6 | 5,230.48 % | 1,477€ | 17,723€ |
| 7 | 6,538.11 % | 1,846€ | 22,154€ |
| 8 | 8,172.63 % | 2,308€ | 27,692€ |
| 9 | 10,215.79 % | 2,885€ | 34,615€ |
| 10 | 12,769.74 % | 3,606€ | 43,269€ |
193,115€ 56,992%
Total ROI For 10 Years
District Classification
Rating
b+
Area map
Statistics
Population
381,110
Social Status
Married : 67%
Unmarried : 26%
area
230 Km2
Price Changes Over Last 5 Years
1 Year Change
17.79%
3 Year Change
202%
5 Year Change
253%
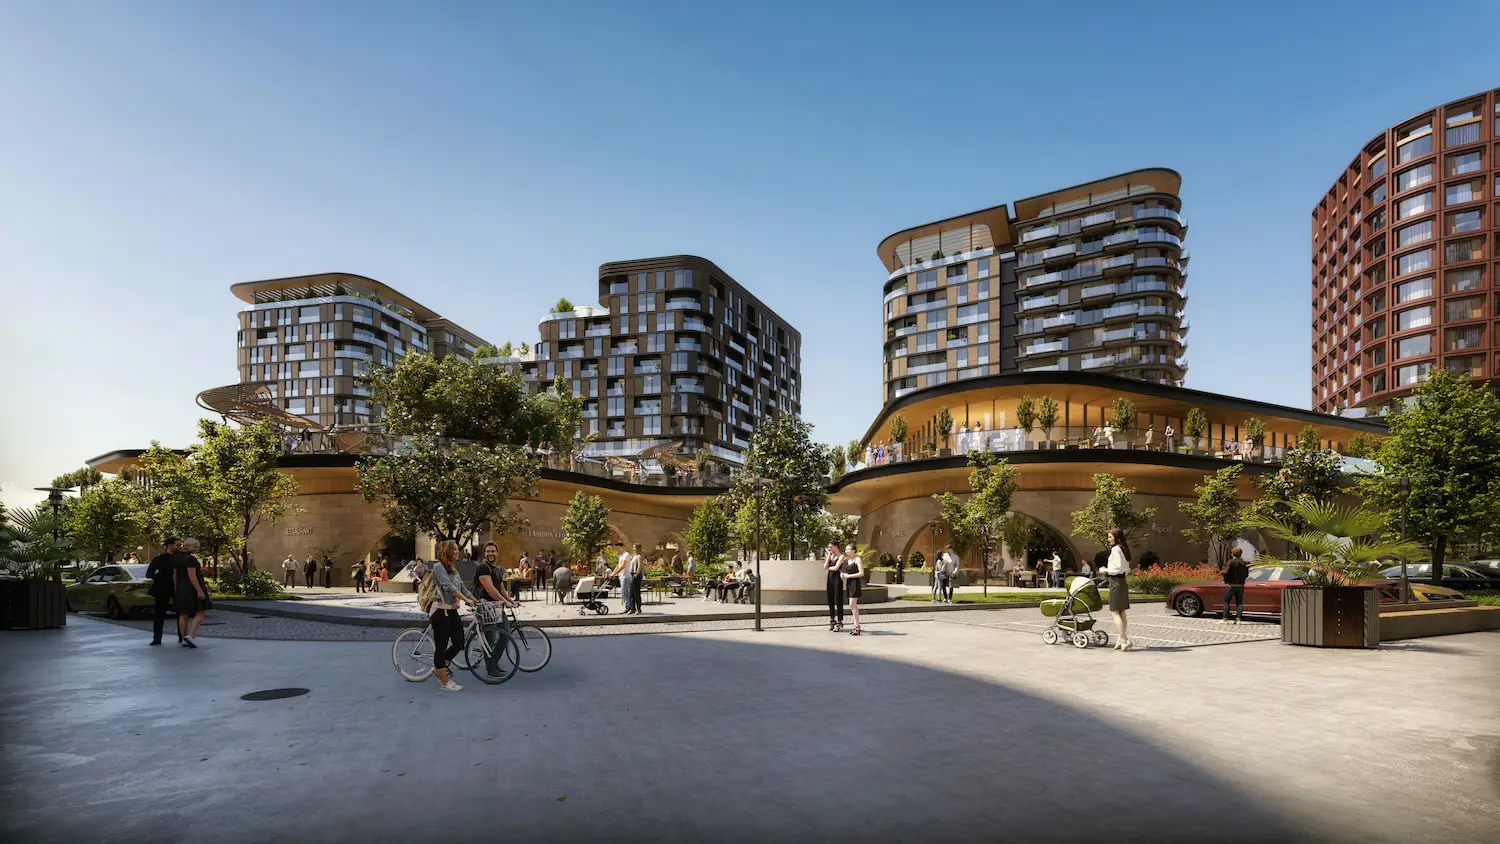
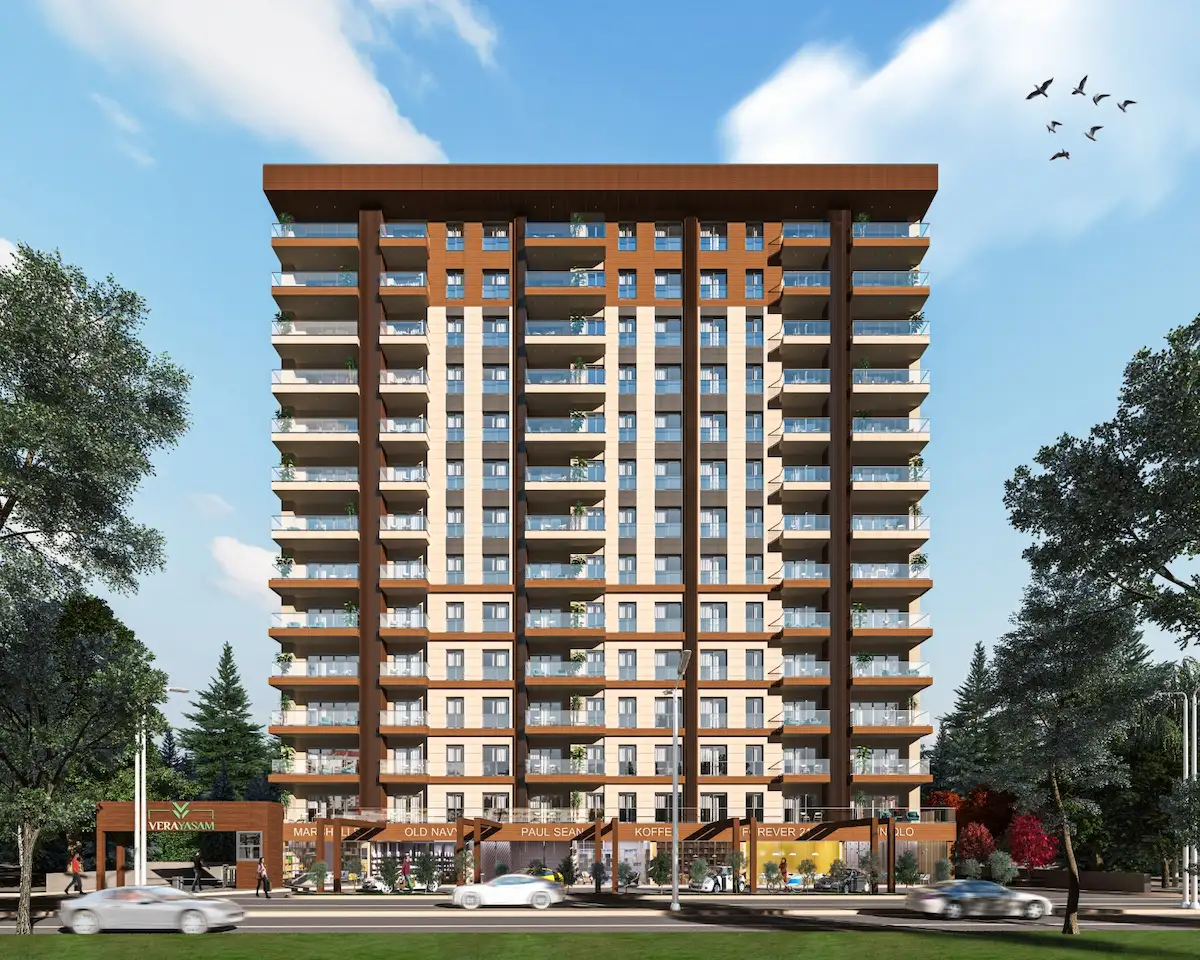
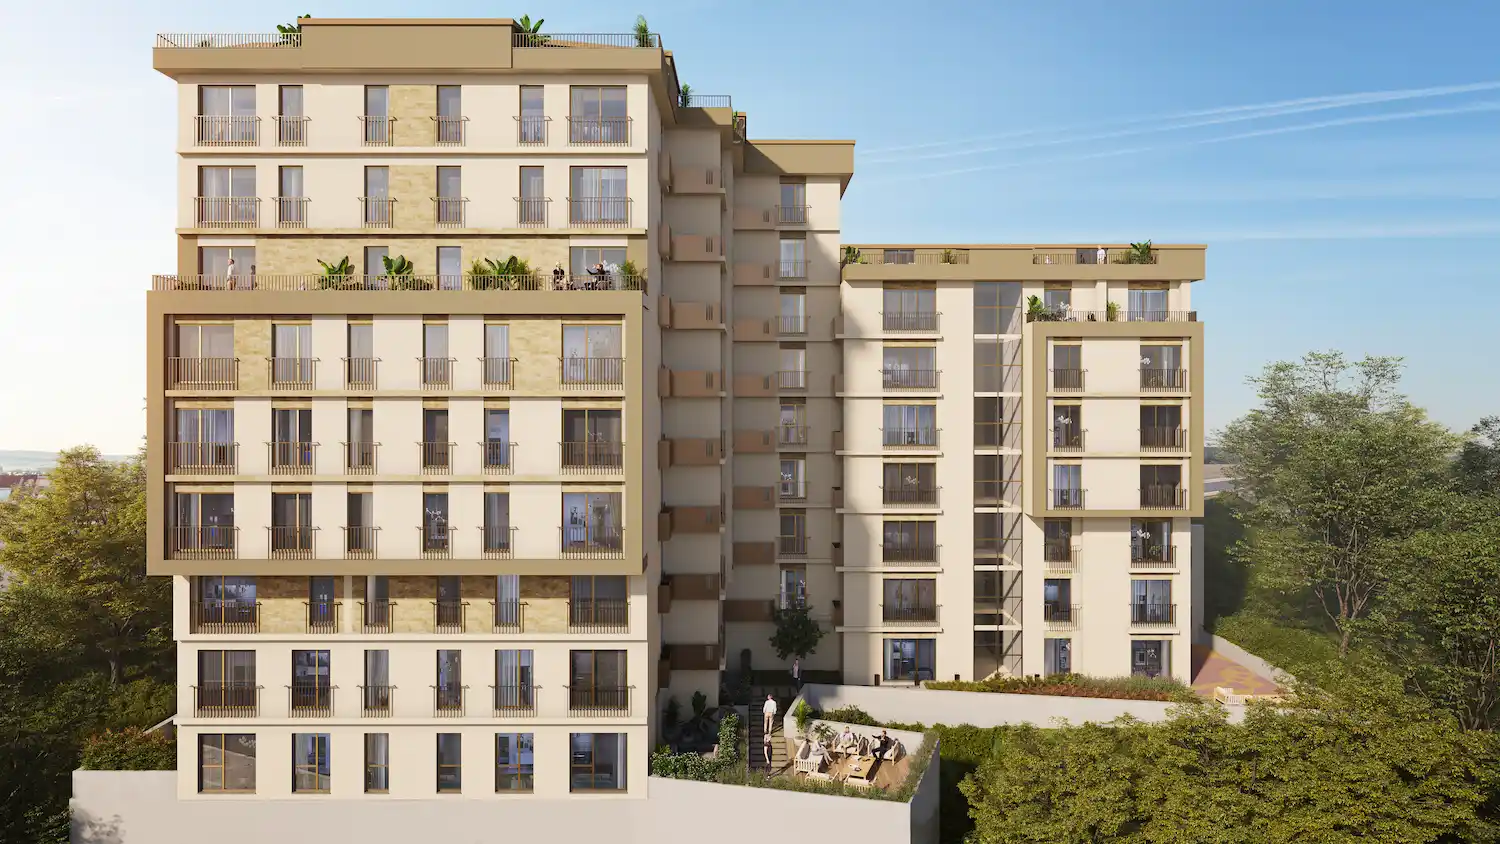
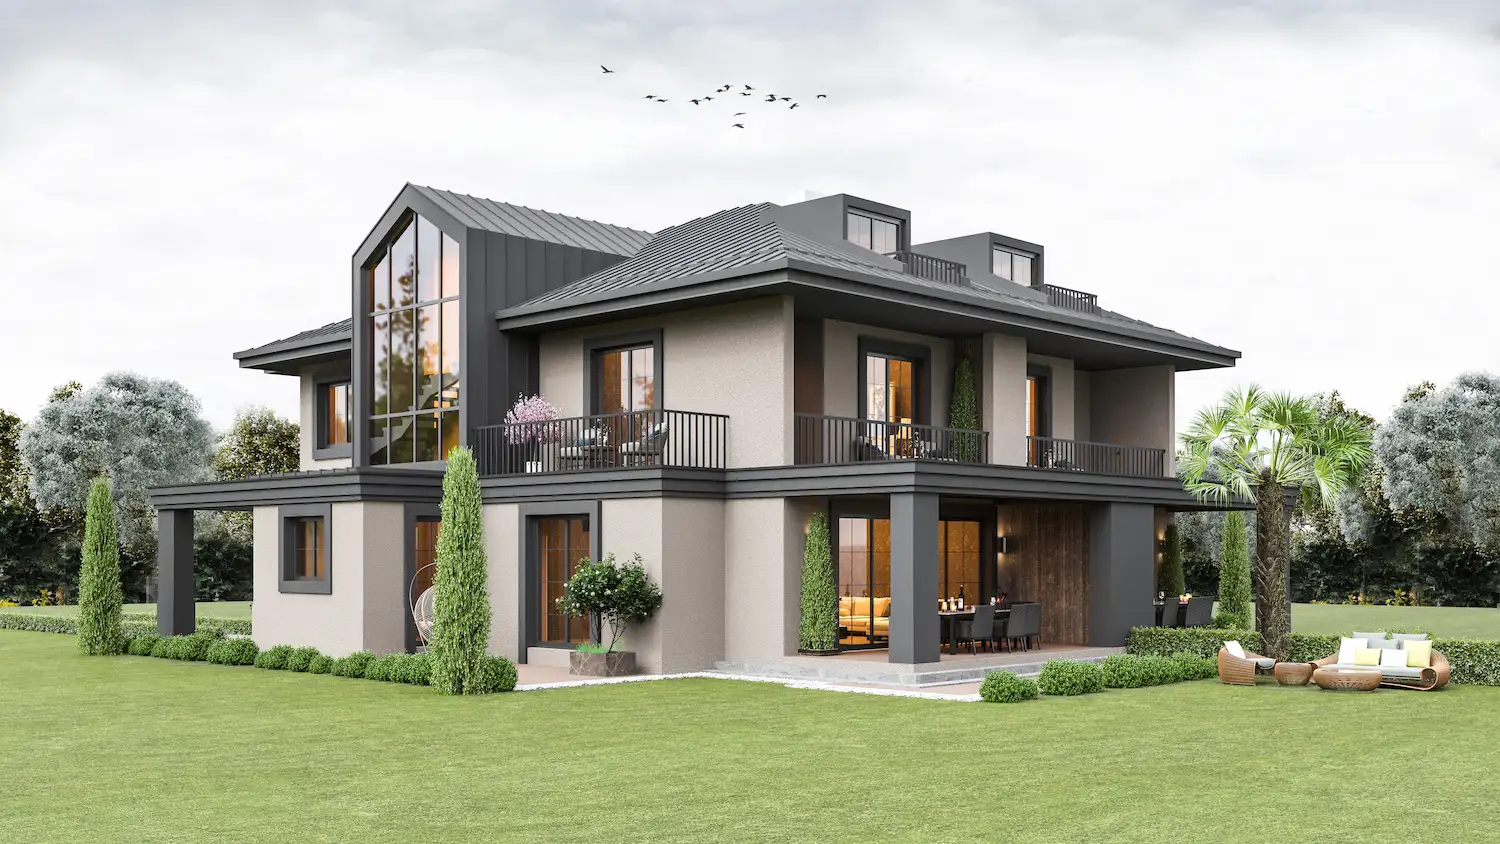
Projects Have same ROI in This Area


Have Question Or Suggestion ?
Please Share Your Thought, To Make It Real


