Return on Investment In Turkey
We are providing a financial metric for real estate investors as it helps them to determine the profitability of their real estate investment in Turkey
773$
Average Income
464$ - 1,082$
Min Income - Max Income
16,614$
Cash Price
| Year | Annual Increase | Monthly ROI | Annual ROI |
|---|---|---|---|
| 1 | 55.81 % | 773$ | 9,273$ |
| 2 | 69.77 % | 966$ | 11,591$ |
| 3 | 87.21 % | 1,207$ | 14,488$ |
| 4 | 109.01 % | 1,509$ | 18,110$ |
| 5 | 136.26 % | 1,887$ | 22,638$ |
| 6 | 170.33 % | 2,358$ | 28,297$ |
| 7 | 212.91 % | 2,948$ | 35,372$ |
| 8 | 266.14 % | 3,685$ | 44,215$ |
| 9 | 332.67 % | 4,606$ | 55,268$ |
| 10 | 415.84 % | 5,757$ | 69,086$ |
308,338$ 1,855%
Total ROI For 10 Years
1,082$
Max Income
16,614$
Cash Price
| Year | Annual Increase | Monthly ROI | Annual ROI |
|---|---|---|---|
| 1 | 78.14 % | 1,082$ | 12,982$ |
| 2 | 97.67 % | 1,352$ | 16,227$ |
| 3 | 122.09 % | 1,690$ | 20,284$ |
| 4 | 152.61 % | 2,113$ | 25,355$ |
| 5 | 190.77 % | 2,641$ | 31,693$ |
| 6 | 238.46 % | 3,301$ | 39,616$ |
| 7 | 298.07 % | 4,127$ | 49,521$ |
| 8 | 372.59 % | 5,158$ | 61,901$ |
| 9 | 465.74 % | 6,448$ | 77,376$ |
| 10 | 582.17 % | 8,060$ | 96,720$ |
431,673$ 2,598%
Total ROI For 10 Years
464$
Min Income
16,614$
Cash Price
| Year | Annual Increase | Monthly ROI | Annual ROI |
|---|---|---|---|
| 1 | 33.49 % | 464$ | 5,564$ |
| 2 | 41.86 % | 580$ | 6,954$ |
| 3 | 52.32 % | 724$ | 8,693$ |
| 4 | 65.41 % | 906$ | 10,866$ |
| 5 | 81.76 % | 1,132$ | 13,583$ |
| 6 | 102.20 % | 1,415$ | 16,978$ |
| 7 | 127.75 % | 1,769$ | 21,223$ |
| 8 | 159.68 % | 2,211$ | 26,529$ |
| 9 | 199.60 % | 2,763$ | 33,161$ |
| 10 | 249.50 % | 3,454$ | 41,451$ |
185,003$ 1,113%
Total ROI For 10 Years
District Classification
Rating
a
Area map
Statistics
Population
448,882
Social Status
Married : 56%
Unmarried : 46%
area
52 Km2
Price Changes Over Last 5 Years
1 Year Change
13.64%
3 Year Change
339%
5 Year Change
370.8%
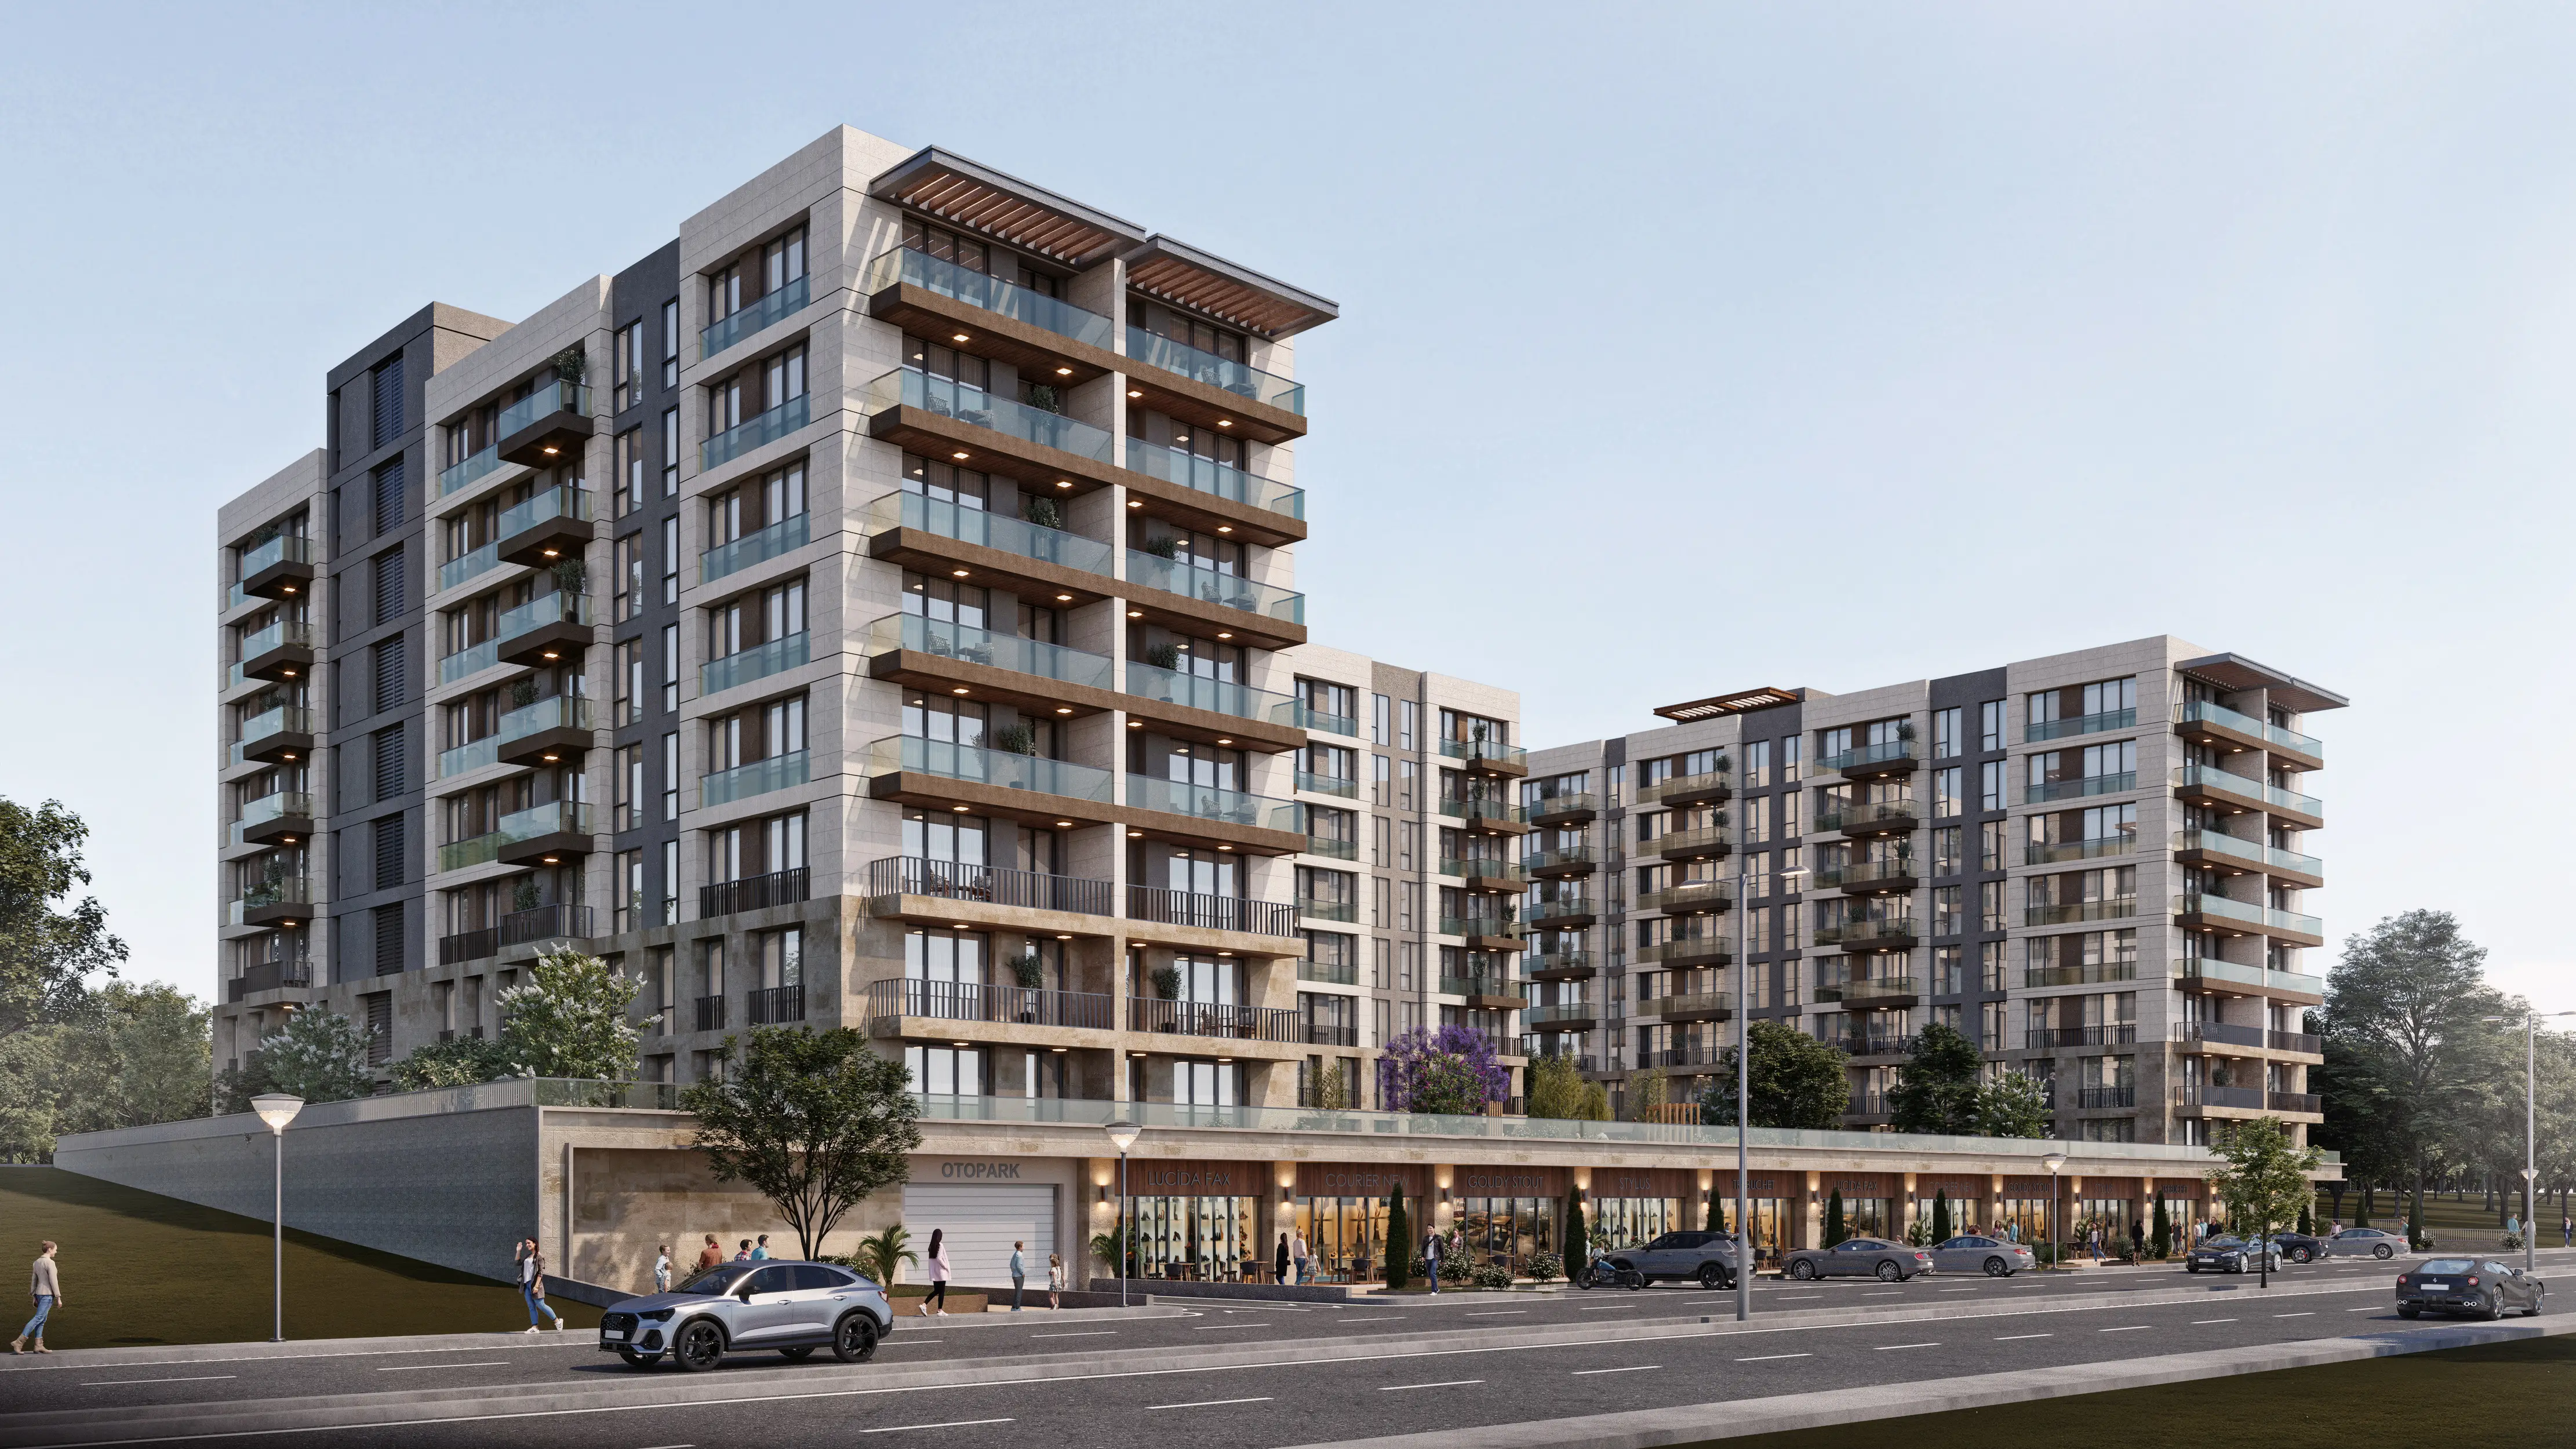
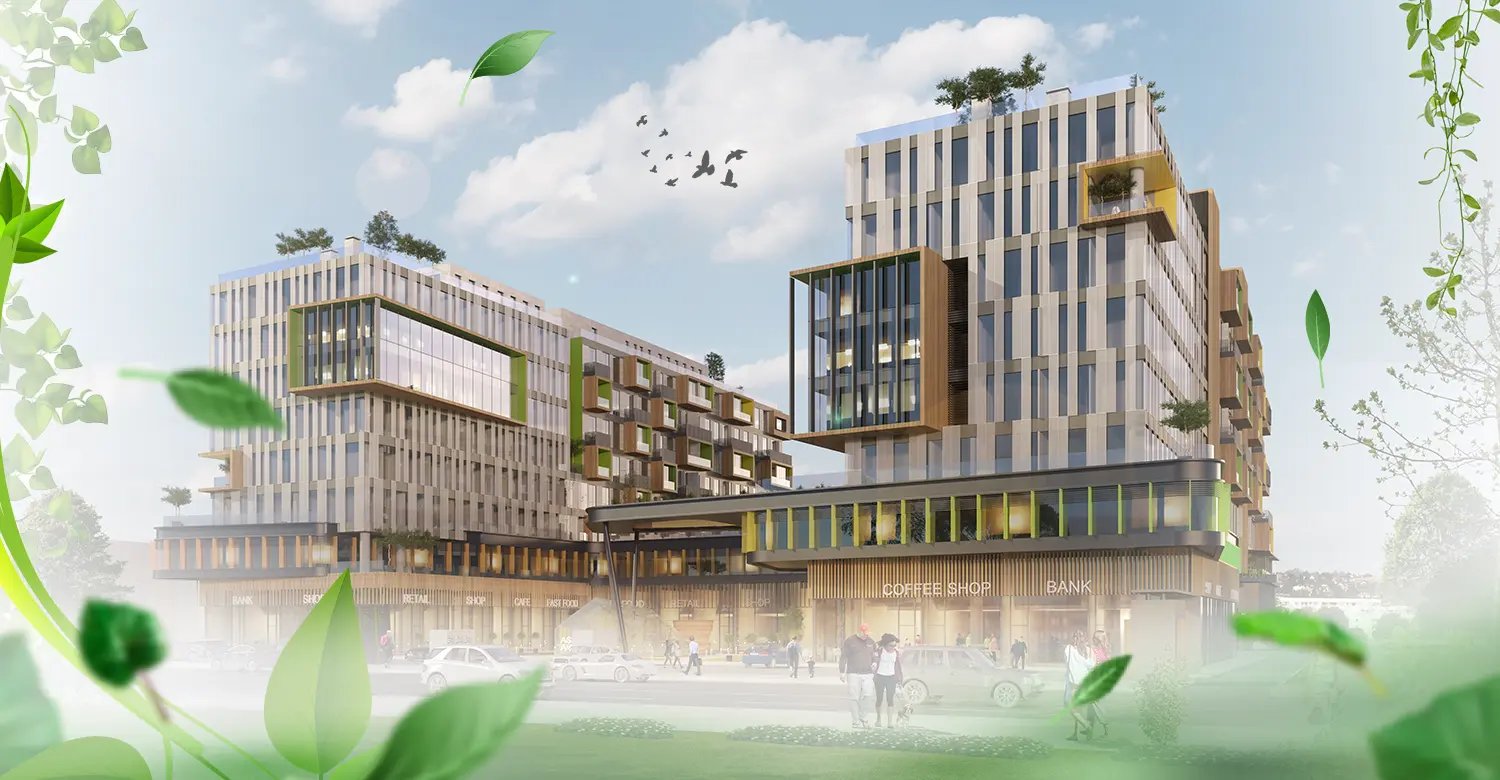
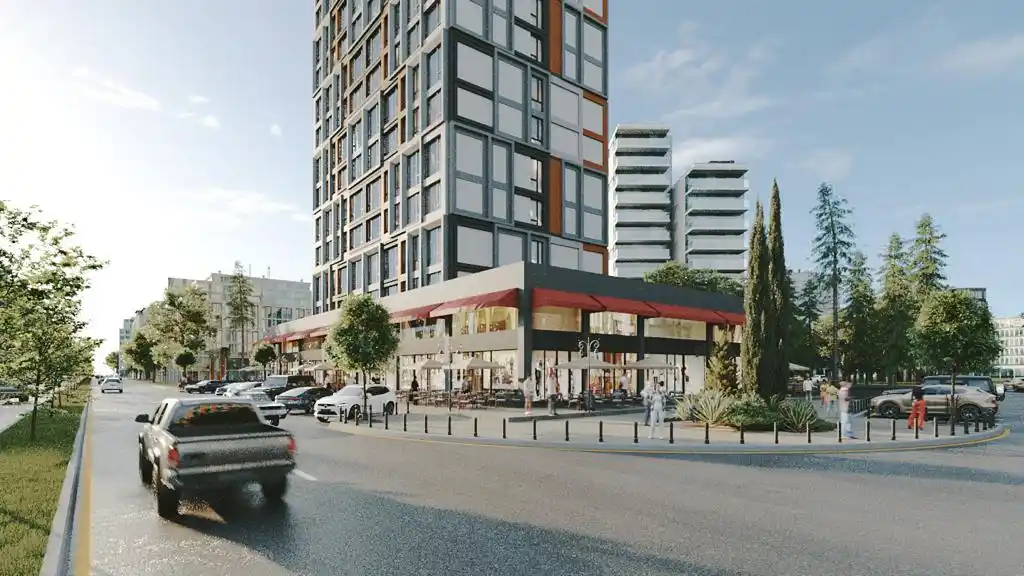
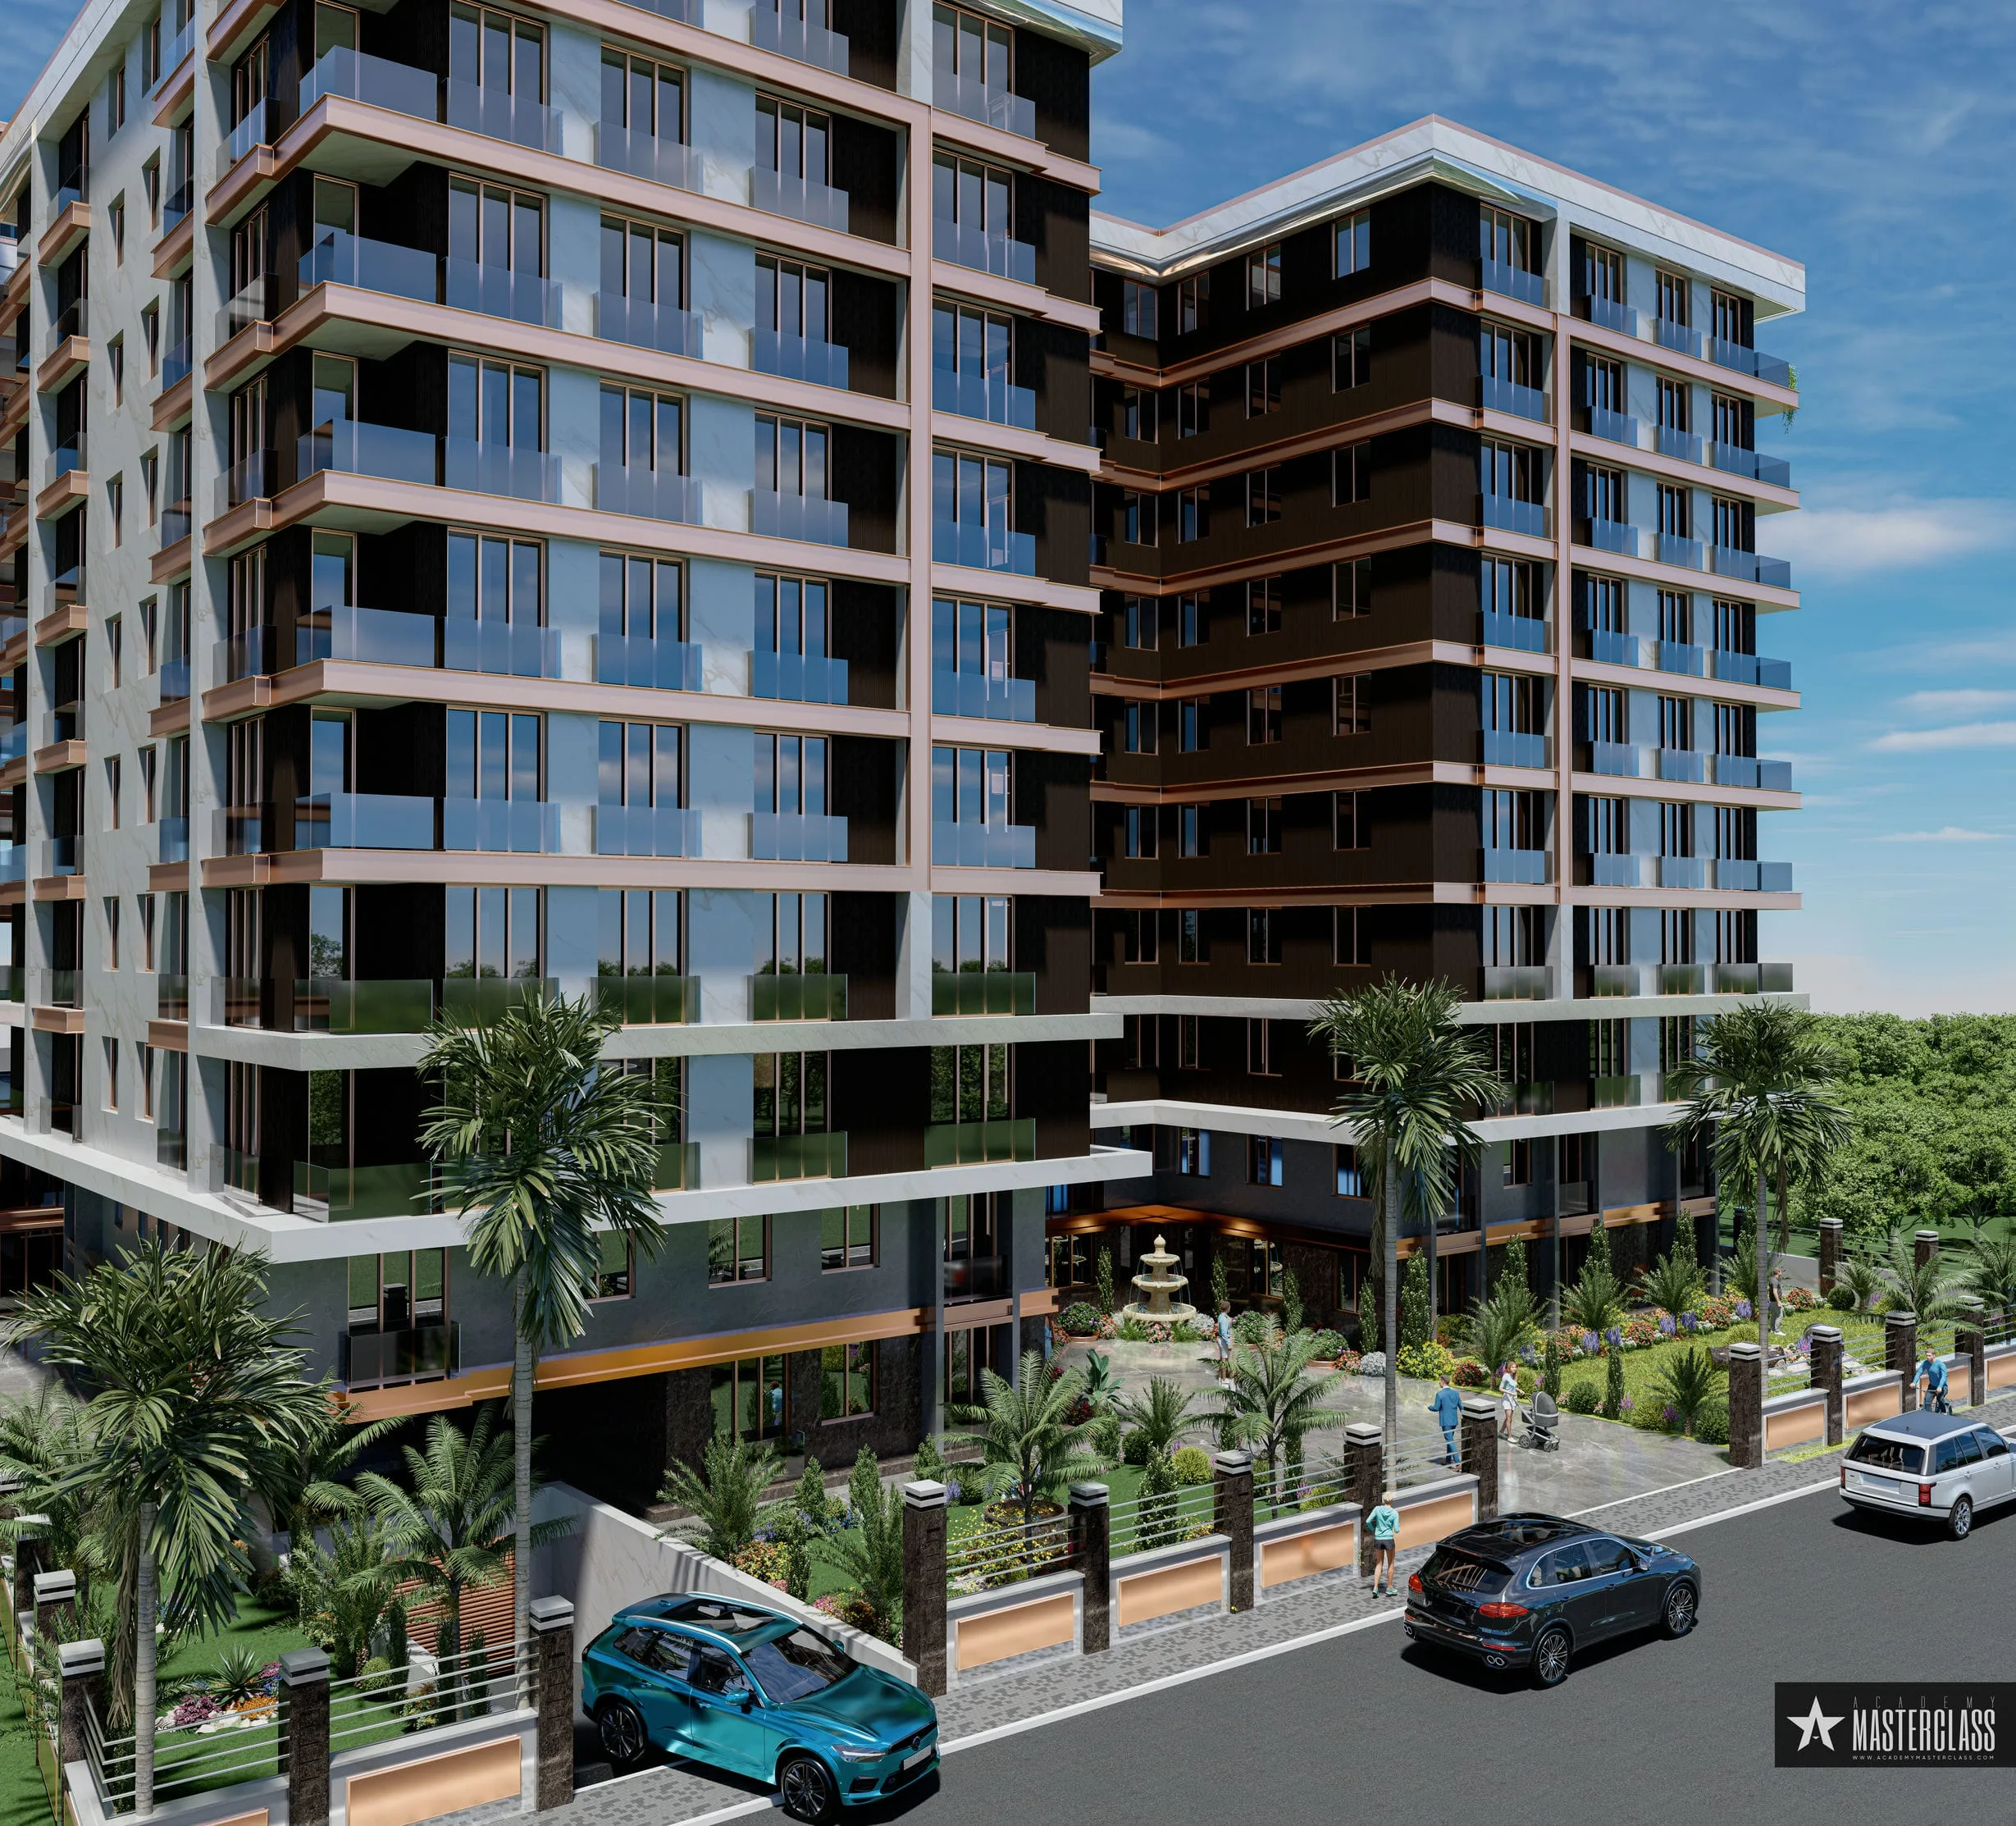
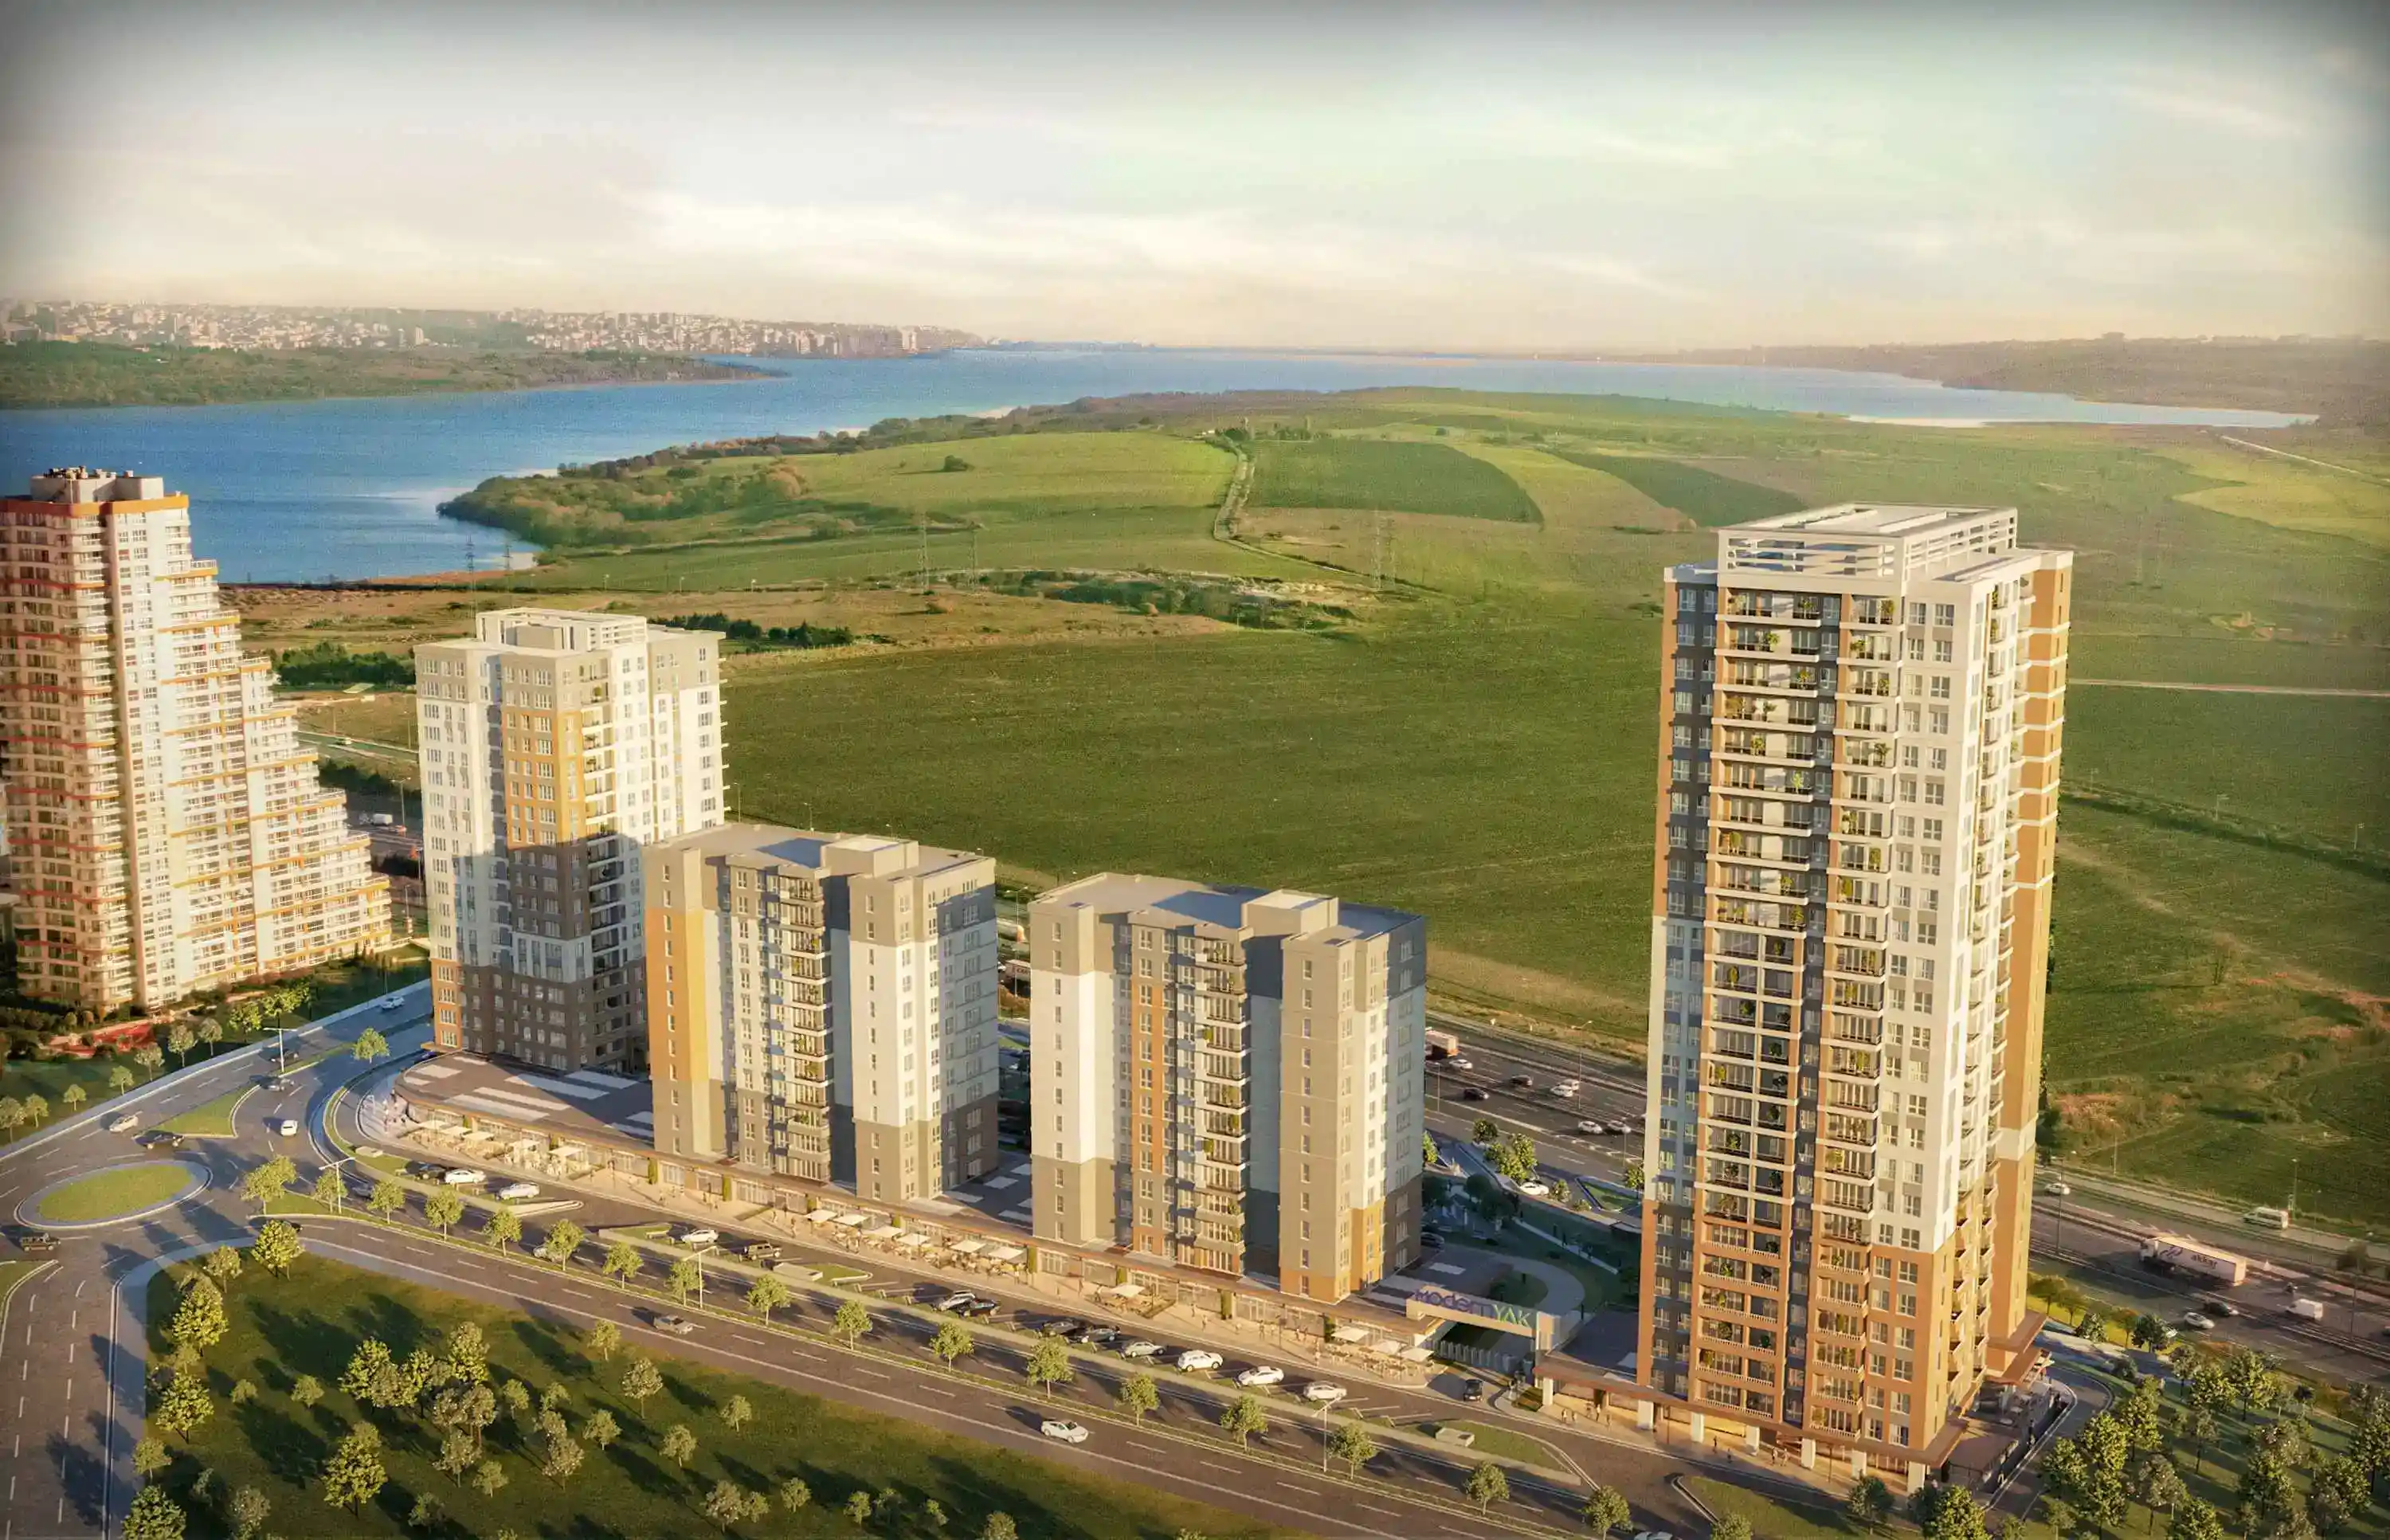
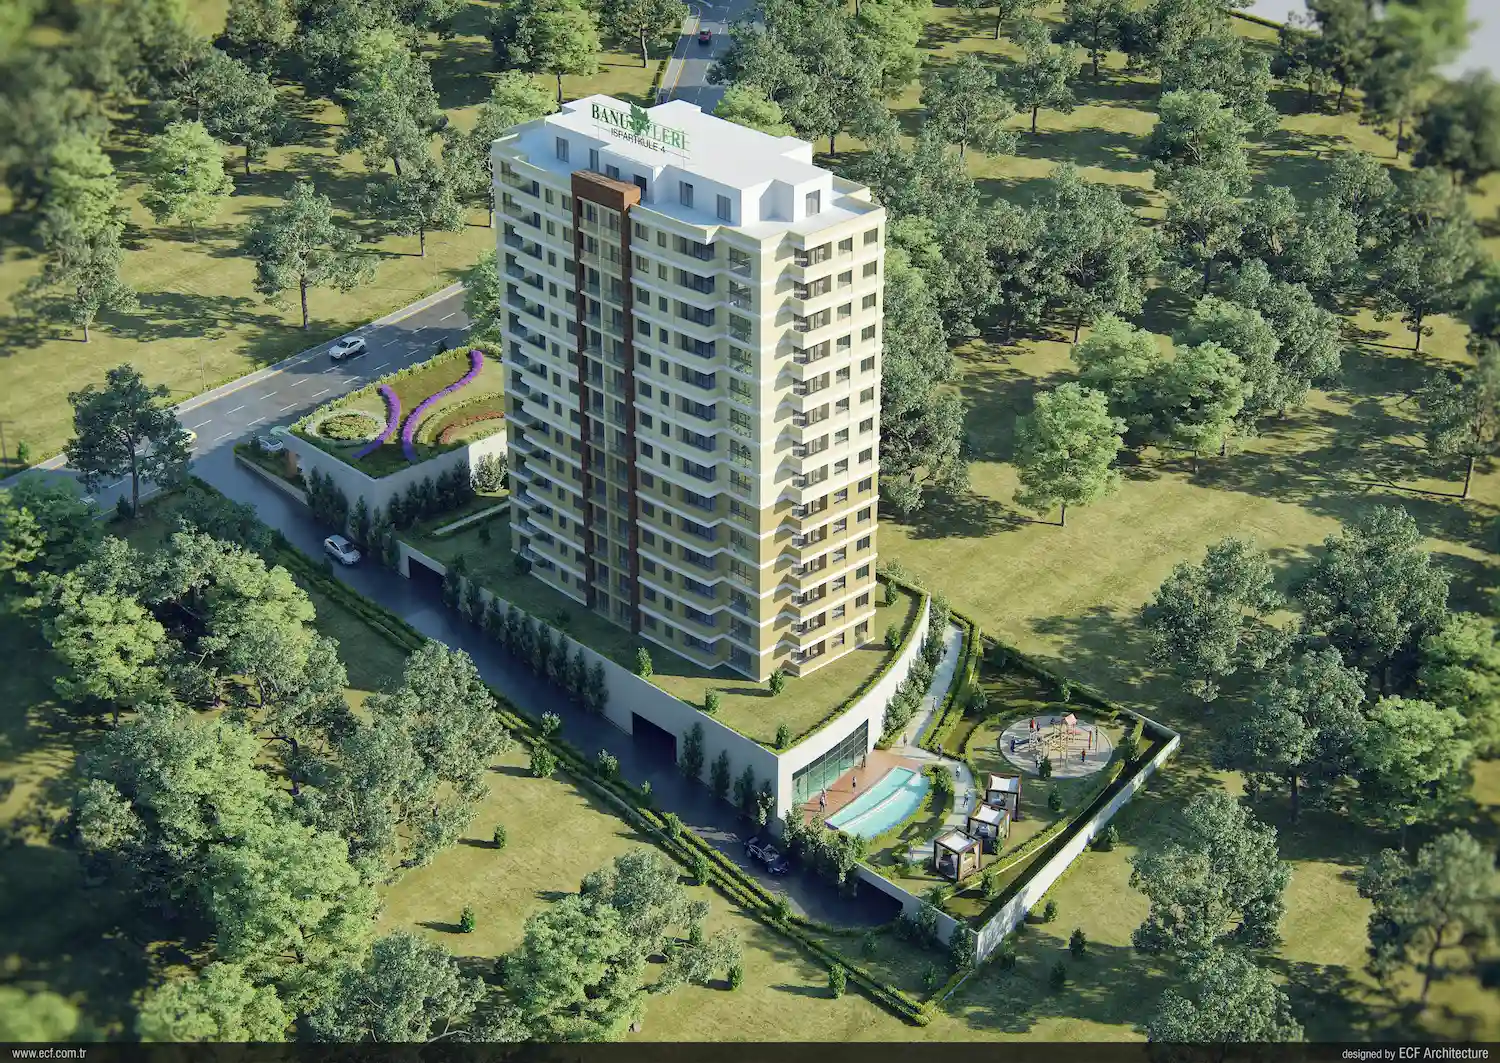
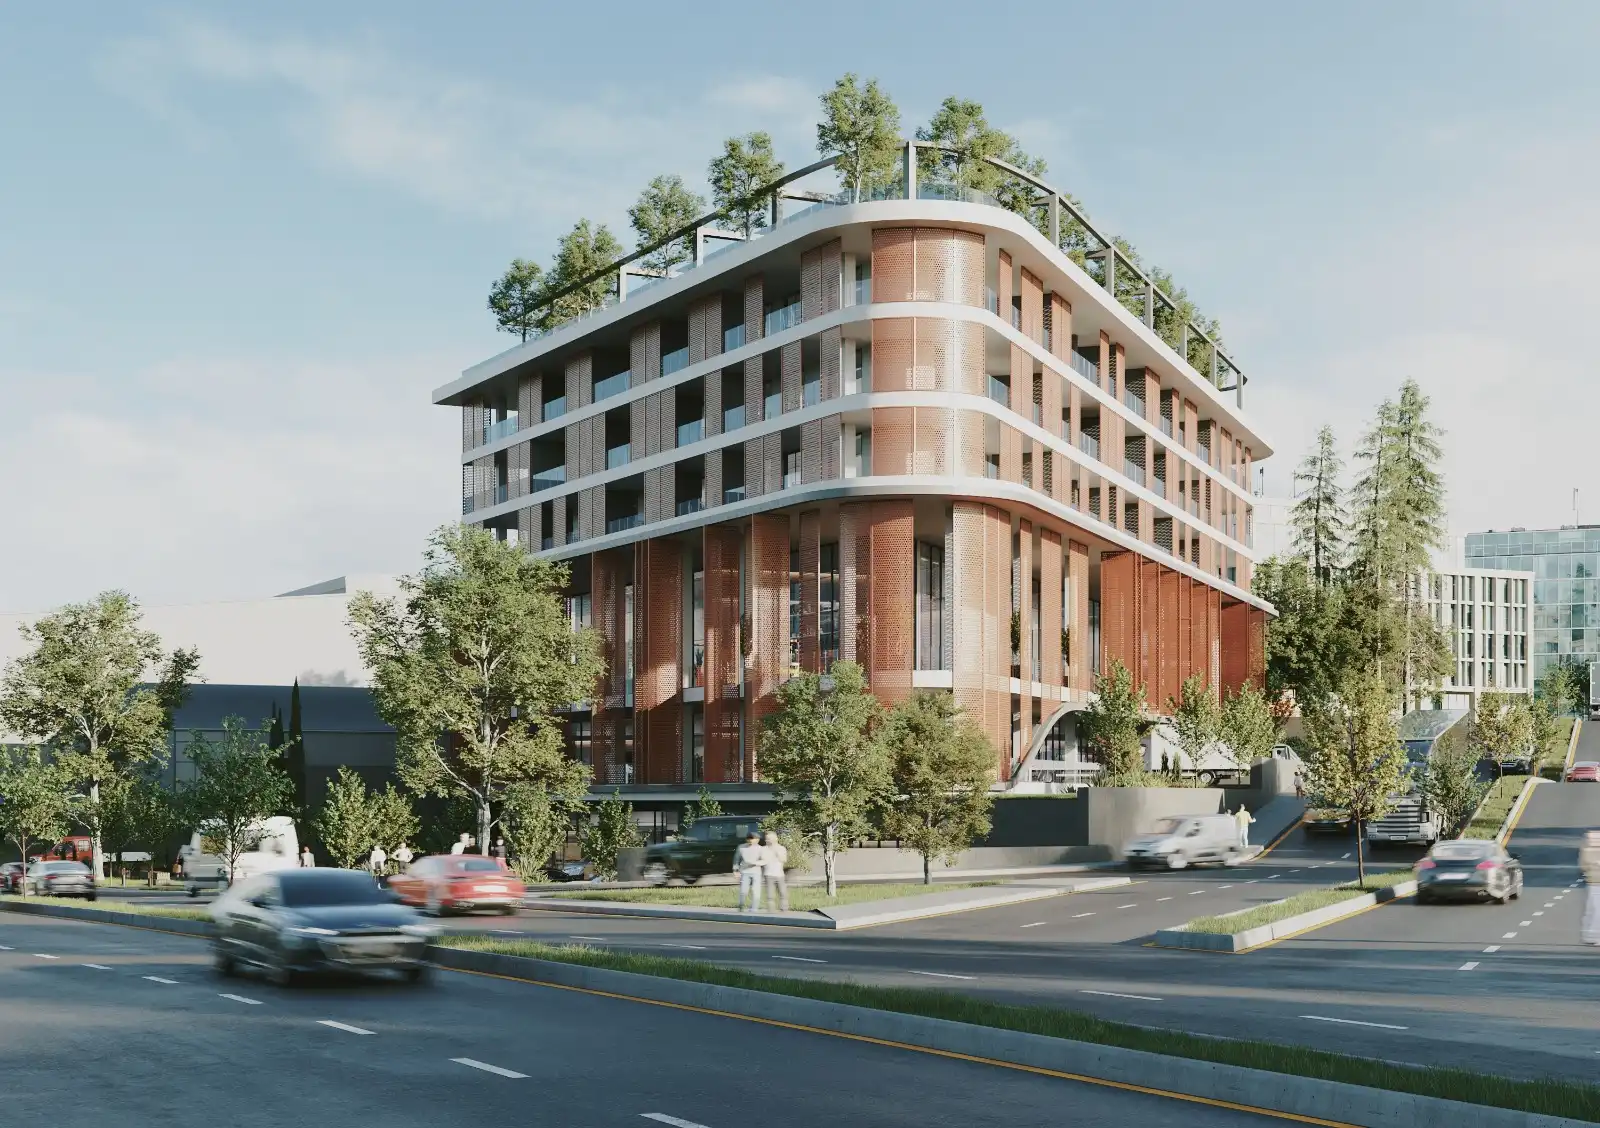
Projects Have same ROI in This Area
.webp)
Have Question Or Suggestion ?
Please Share Your Thought, To Make It Real


