Return on Investment In Turkey
We are providing a financial metric for real estate investors as it helps them to determine the profitability of their real estate investment in Turkey
619$
Average Income
464$ - 774$
Min Income - Max Income
72,904$
Cash Price
| Year | Annual Increase | Monthly ROI | Annual ROI |
|---|---|---|---|
| 1 | 10.19 % | 619$ | 7,431$ |
| 2 | 12.74 % | 774$ | 9,289$ |
| 3 | 15.93 % | 968$ | 11,611$ |
| 4 | 19.91 % | 1,209$ | 14,514$ |
| 5 | 24.88 % | 1,512$ | 18,142$ |
| 6 | 31.11 % | 1,890$ | 22,677$ |
| 7 | 38.88 % | 2,362$ | 28,347$ |
| 8 | 48.60 % | 2,953$ | 35,433$ |
| 9 | 60.75 % | 3,691$ | 44,292$ |
| 10 | 75.94 % | 4,614$ | 55,365$ |
247,100$ 338%
Total ROI For 10 Years
774$
Max Income
72,904$
Cash Price
| Year | Annual Increase | Monthly ROI | Annual ROI |
|---|---|---|---|
| 1 | 12.74 % | 774$ | 9,289$ |
| 2 | 15.93 % | 968$ | 11,611$ |
| 3 | 19.91 % | 1,209$ | 14,514$ |
| 4 | 24.88 % | 1,512$ | 18,142$ |
| 5 | 31.11 % | 1,890$ | 22,677$ |
| 6 | 38.88 % | 2,362$ | 28,347$ |
| 7 | 48.60 % | 2,953$ | 35,433$ |
| 8 | 60.75 % | 3,691$ | 44,292$ |
| 9 | 75.94 % | 4,614$ | 55,365$ |
| 10 | 94.93 % | 5,767$ | 69,206$ |
308,874$ 423%
Total ROI For 10 Years
464$
Min Income
72,904$
Cash Price
| Year | Annual Increase | Monthly ROI | Annual ROI |
|---|---|---|---|
| 1 | 7.64 % | 464$ | 5,573$ |
| 2 | 9.56 % | 581$ | 6,966$ |
| 3 | 11.94 % | 726$ | 8,708$ |
| 4 | 14.93 % | 907$ | 10,885$ |
| 5 | 18.66 % | 1,134$ | 13,606$ |
| 6 | 23.33 % | 1,417$ | 17,008$ |
| 7 | 29.16 % | 1,772$ | 21,260$ |
| 8 | 36.45 % | 2,215$ | 26,575$ |
| 9 | 45.57 % | 2,768$ | 33,219$ |
| 10 | 56.96 % | 3,460$ | 41,523$ |
185,325$ 254%
Total ROI For 10 Years
District Classification
Rating
a
Area map
Statistics
Population
448,882
Social Status
Married : 56%
Unmarried : 46%
area
52 Km2
Price Changes Over Last 5 Years
1 Year Change
13.64%
3 Year Change
339%
5 Year Change
370.8%
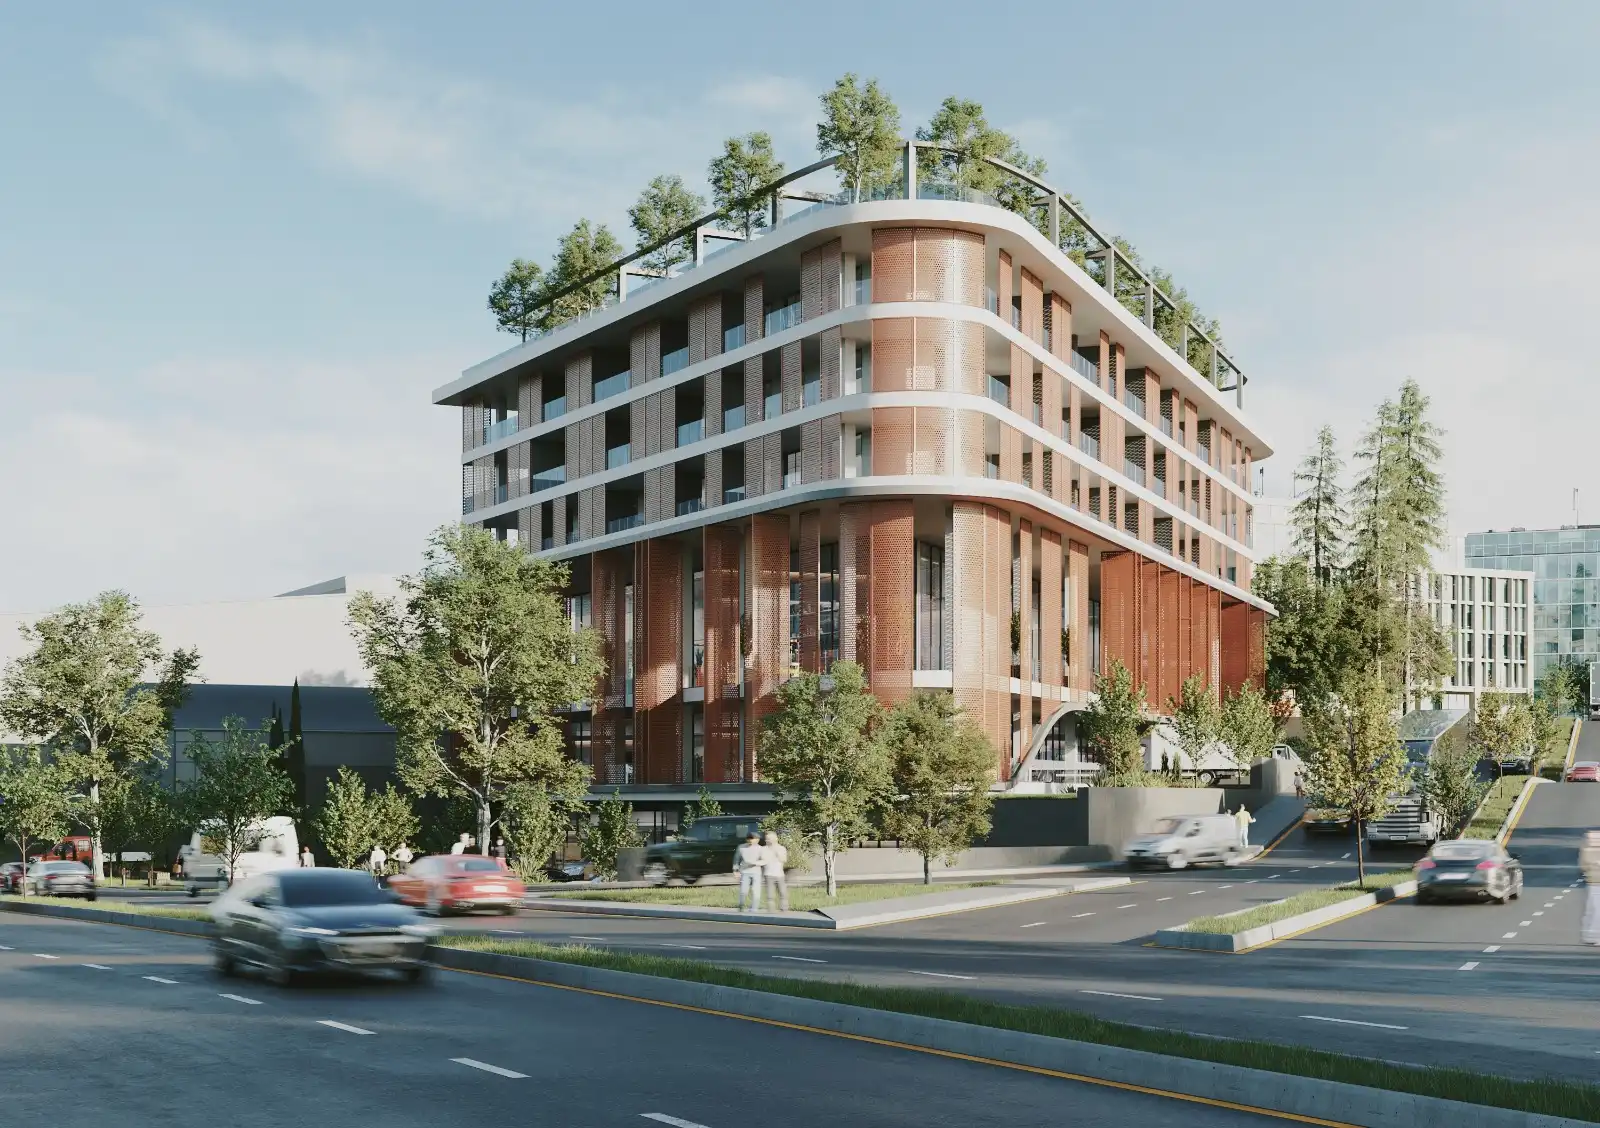
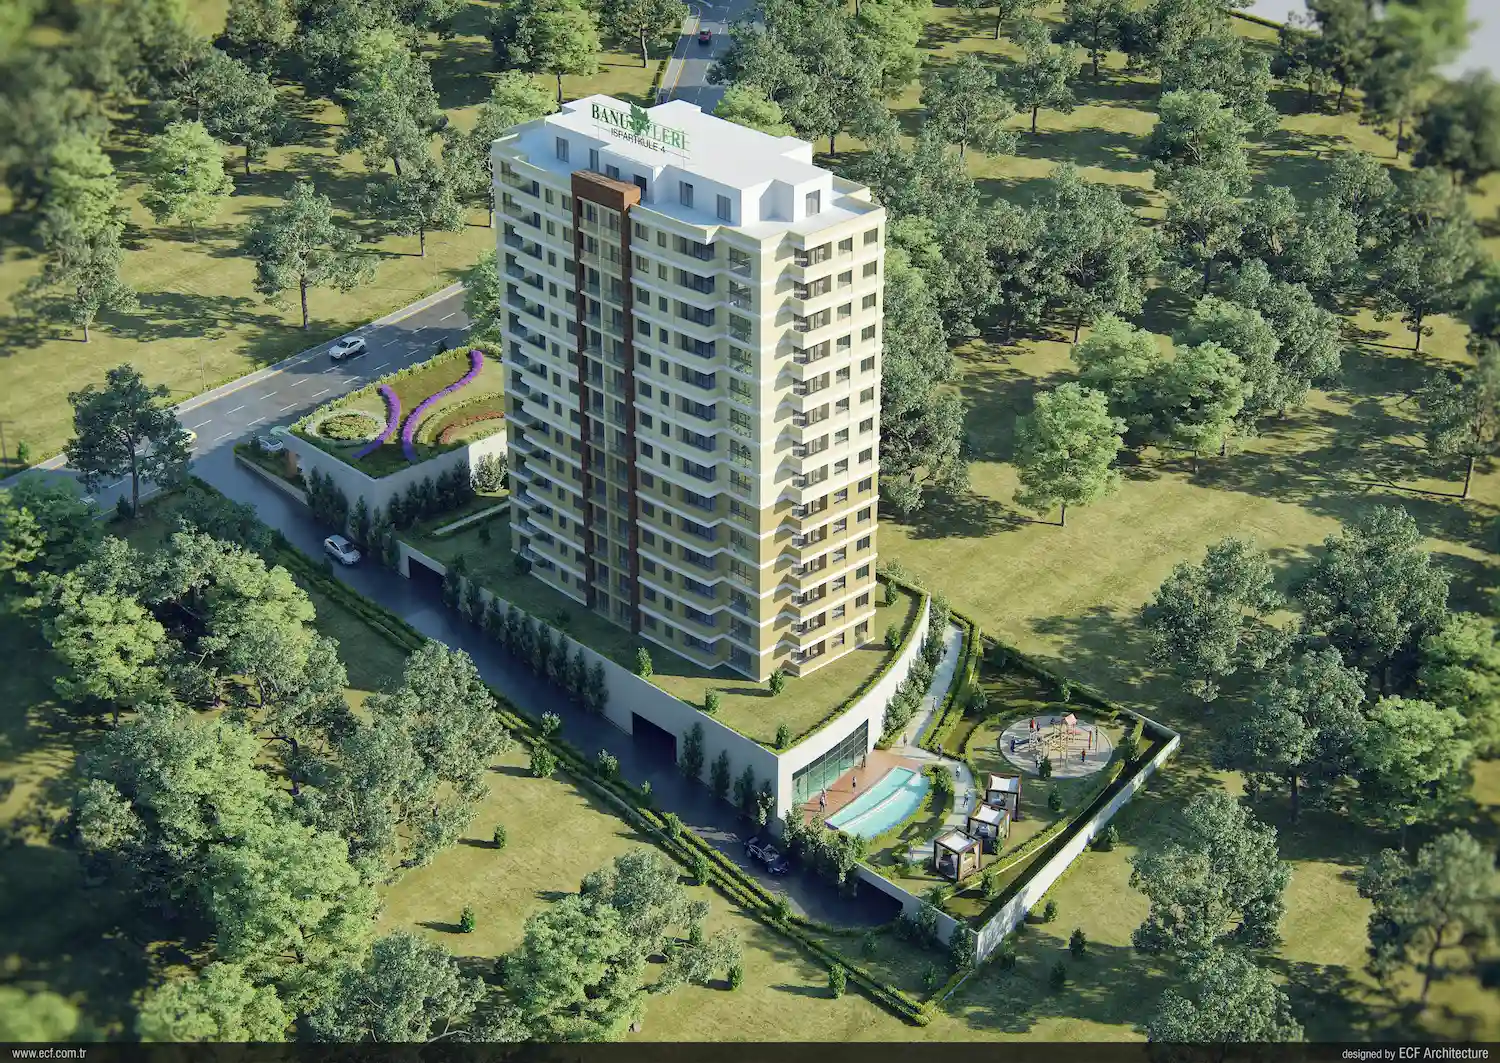
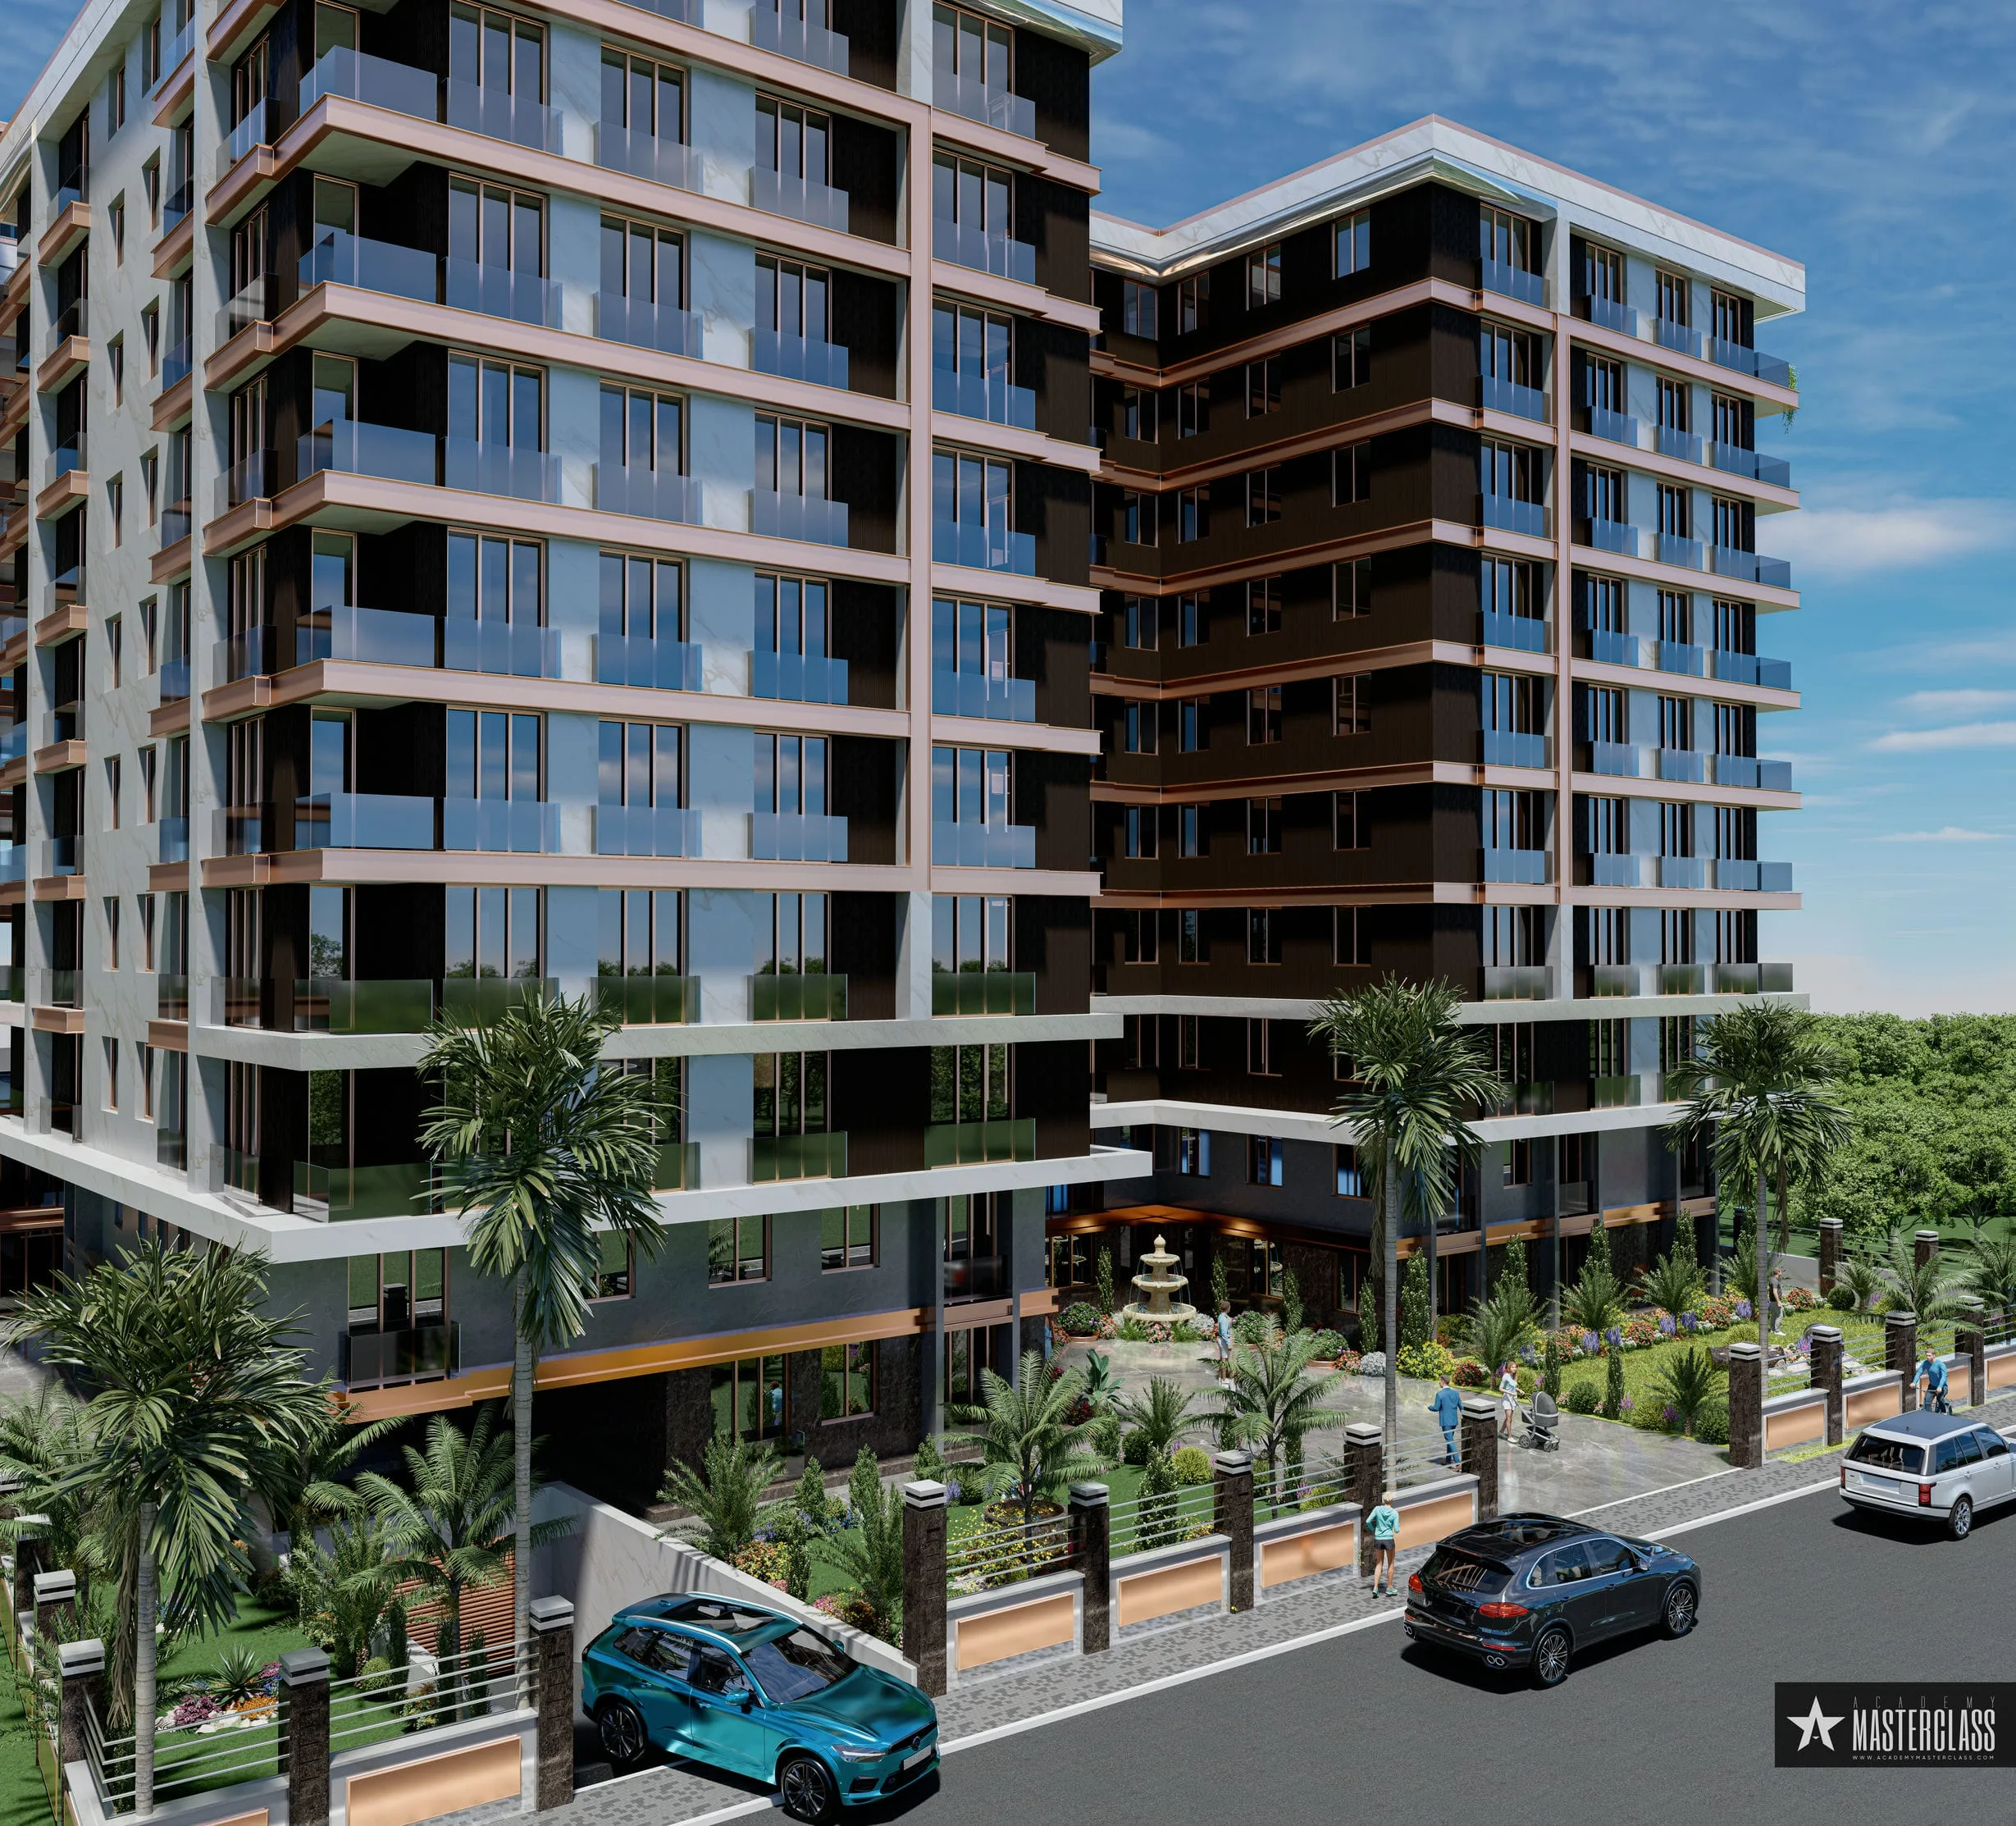
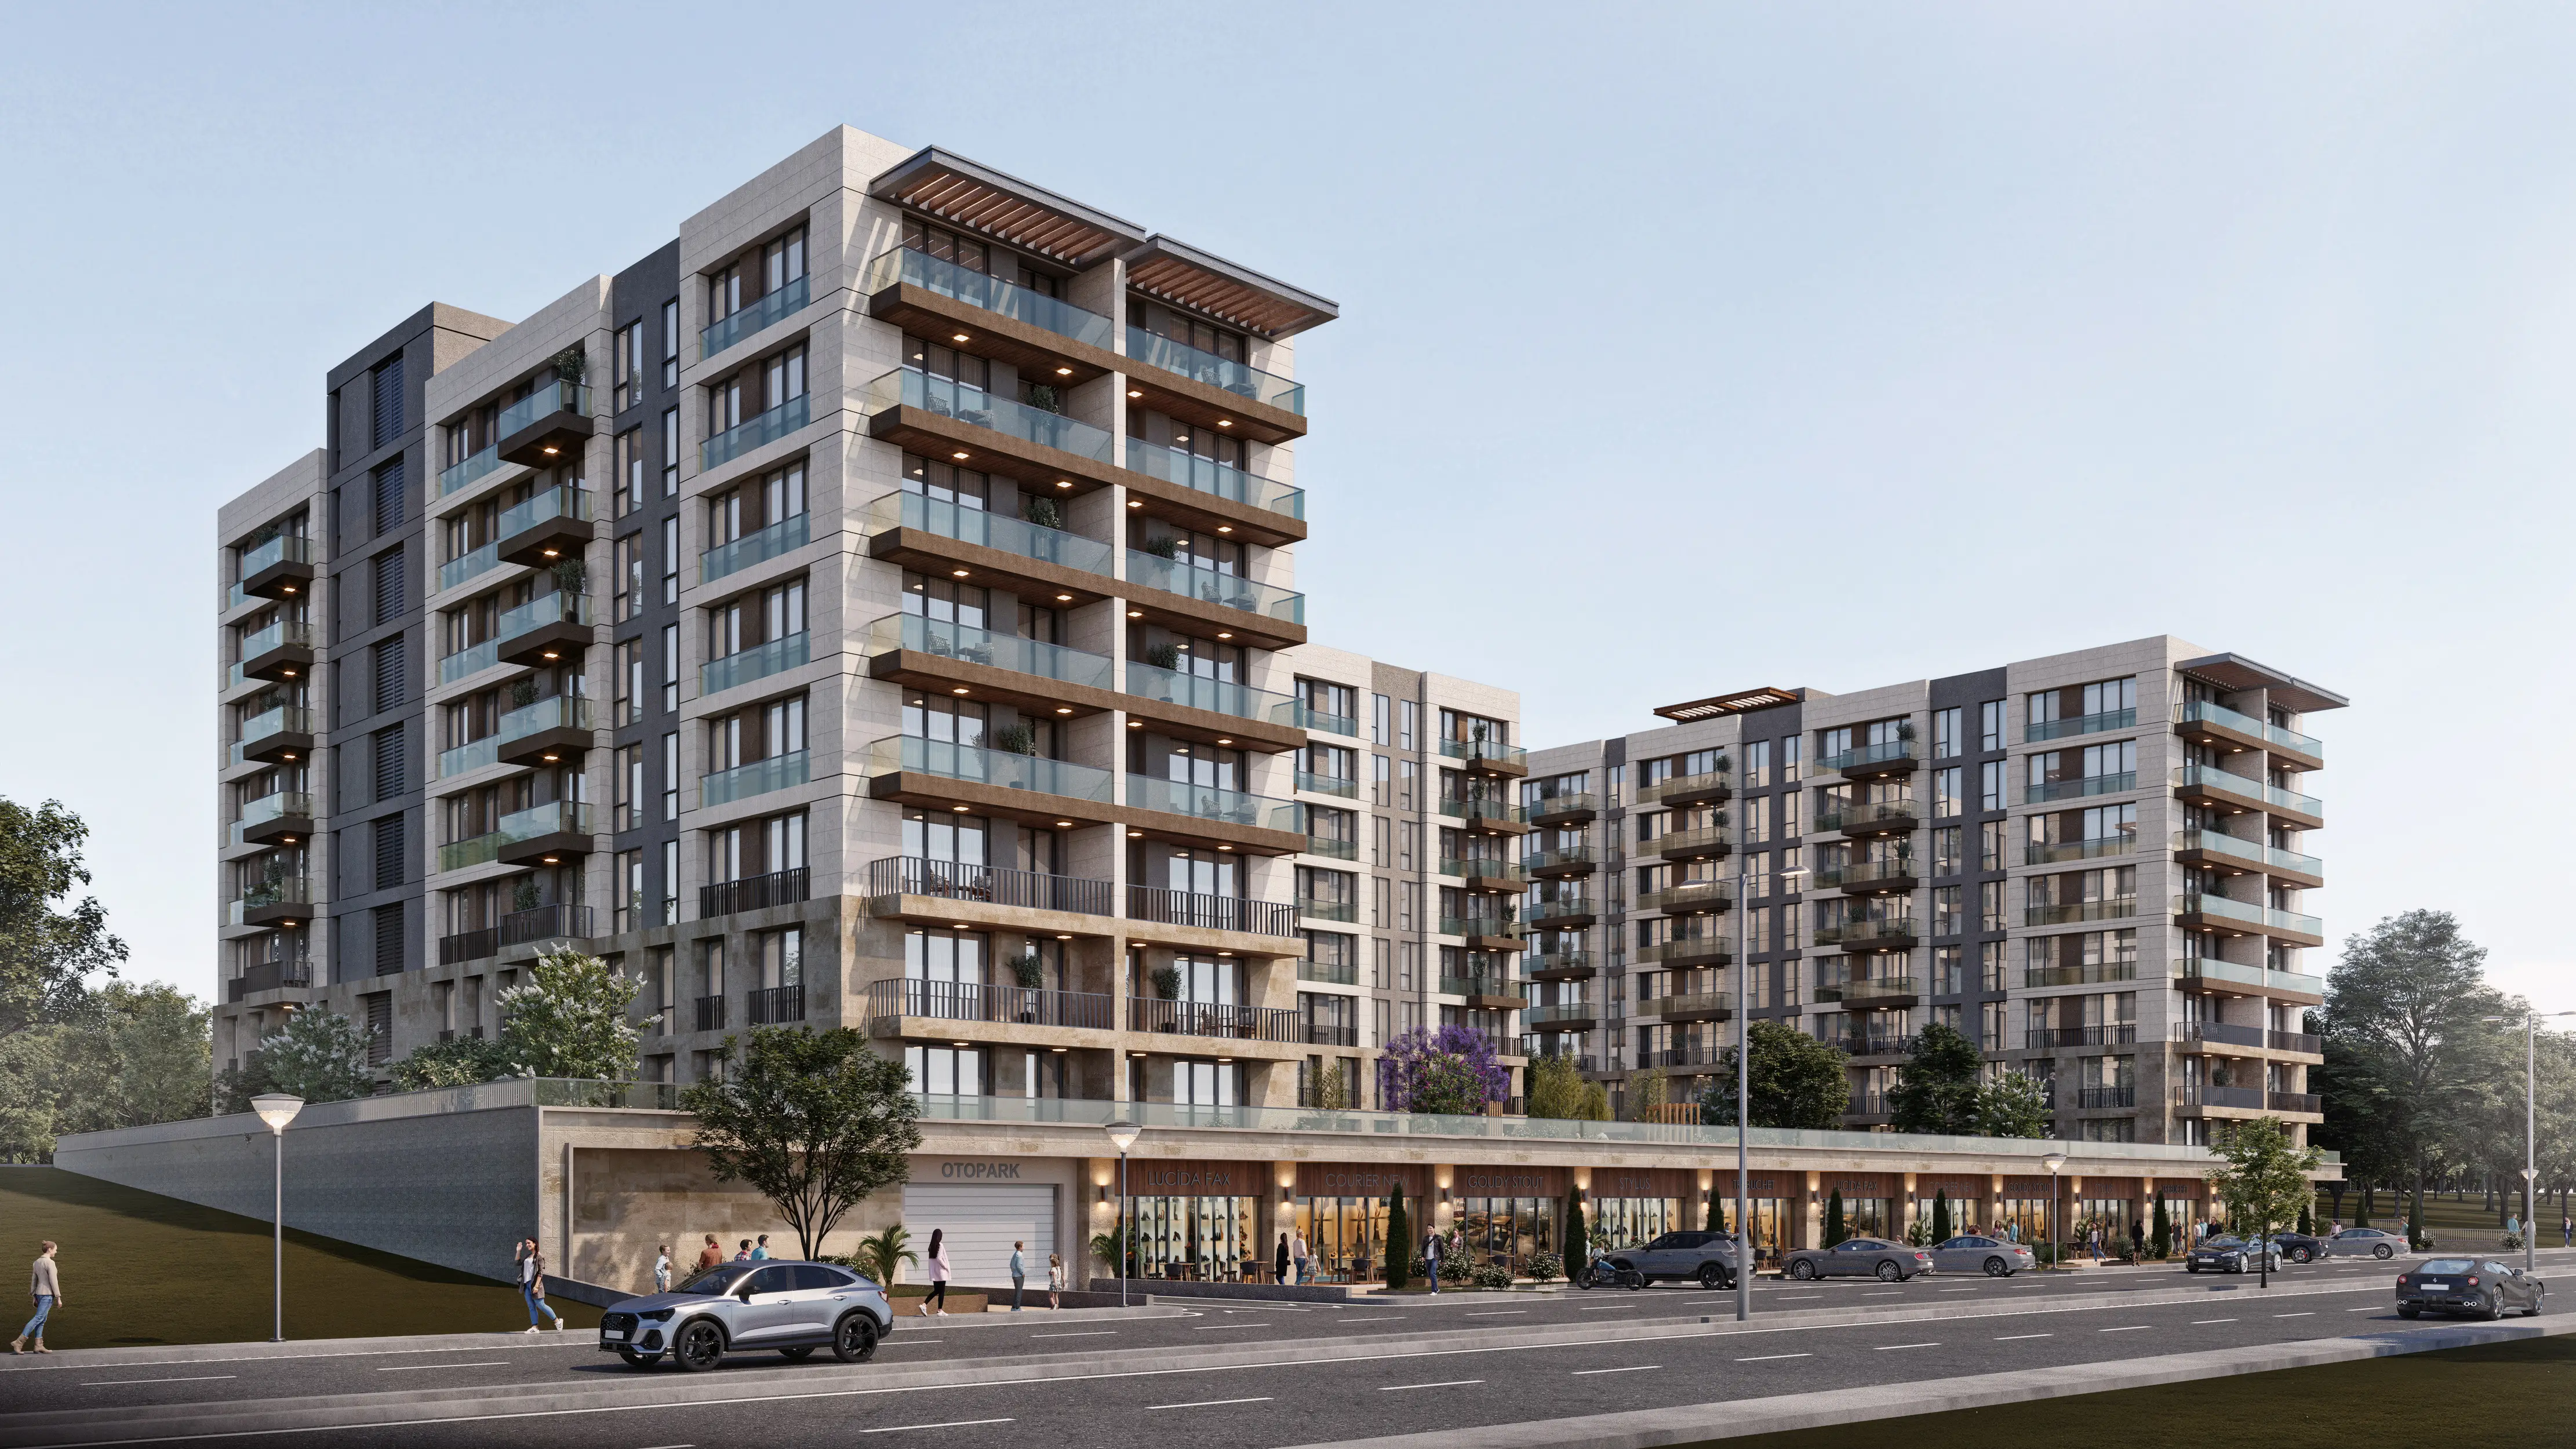
Projects Have same ROI in This Area

.webp)

Have Question Or Suggestion ?
Please Share Your Thought, To Make It Real


