Return on Investment In Turkey
We are providing a financial metric for real estate investors as it helps them to determine the profitability of their real estate investment in Turkey
371$
Average Income
216$ - 525$
Min Income - Max Income
114,295$
Cash Price
| Year | Annual Increase | Monthly ROI | Annual ROI |
|---|---|---|---|
| 1 | 3.89 % | 371$ | 4,451$ |
| 2 | 4.87 % | 464$ | 5,564$ |
| 3 | 6.08 % | 580$ | 6,954$ |
| 4 | 7.61 % | 724$ | 8,693$ |
| 5 | 9.51 % | 906$ | 10,866$ |
| 6 | 11.88 % | 1,132$ | 13,583$ |
| 7 | 14.85 % | 1,415$ | 16,978$ |
| 8 | 18.57 % | 1,769$ | 21,223$ |
| 9 | 23.21 % | 2,211$ | 26,529$ |
| 10 | 29.01 % | 2,763$ | 33,161$ |
148,002$ 129%
Total ROI For 10 Years
525$
Max Income
114,295$
Cash Price
| Year | Annual Increase | Monthly ROI | Annual ROI |
|---|---|---|---|
| 1 | 5.52 % | 525$ | 6,305$ |
| 2 | 6.90 % | 657$ | 7,882$ |
| 3 | 8.62 % | 821$ | 9,852$ |
| 4 | 10.77 % | 1,026$ | 12,315$ |
| 5 | 13.47 % | 1,283$ | 15,394$ |
| 6 | 16.84 % | 1,604$ | 19,242$ |
| 7 | 21.04 % | 2,004$ | 24,053$ |
| 8 | 26.31 % | 2,506$ | 30,066$ |
| 9 | 32.88 % | 3,132$ | 37,583$ |
| 10 | 41.10 % | 3,915$ | 46,978$ |
209,670$ 183%
Total ROI For 10 Years
216$
Min Income
114,295$
Cash Price
| Year | Annual Increase | Monthly ROI | Annual ROI |
|---|---|---|---|
| 1 | 2.27 % | 216$ | 2,596$ |
| 2 | 2.84 % | 270$ | 3,245$ |
| 3 | 3.55 % | 338$ | 4,057$ |
| 4 | 4.44 % | 423$ | 5,071$ |
| 5 | 5.55 % | 528$ | 6,339$ |
| 6 | 6.93 % | 660$ | 7,923$ |
| 7 | 8.67 % | 825$ | 9,904$ |
| 8 | 10.83 % | 1,032$ | 12,380$ |
| 9 | 13.54 % | 1,290$ | 15,475$ |
| 10 | 16.92 % | 1,612$ | 19,344$ |
86,335$ 75%
Total ROI For 10 Years
District Classification
Rating
b+
Area map
Statistics
Population
846,000
Social Status
Married : 53%
Unmarried : 47%
area
42 Km2
Price Changes Over Last 5 Years
1 Year Change
13.27%
3 Year Change
255.2%
5 Year Change
315.6%
Projects Have same ROI in This Area
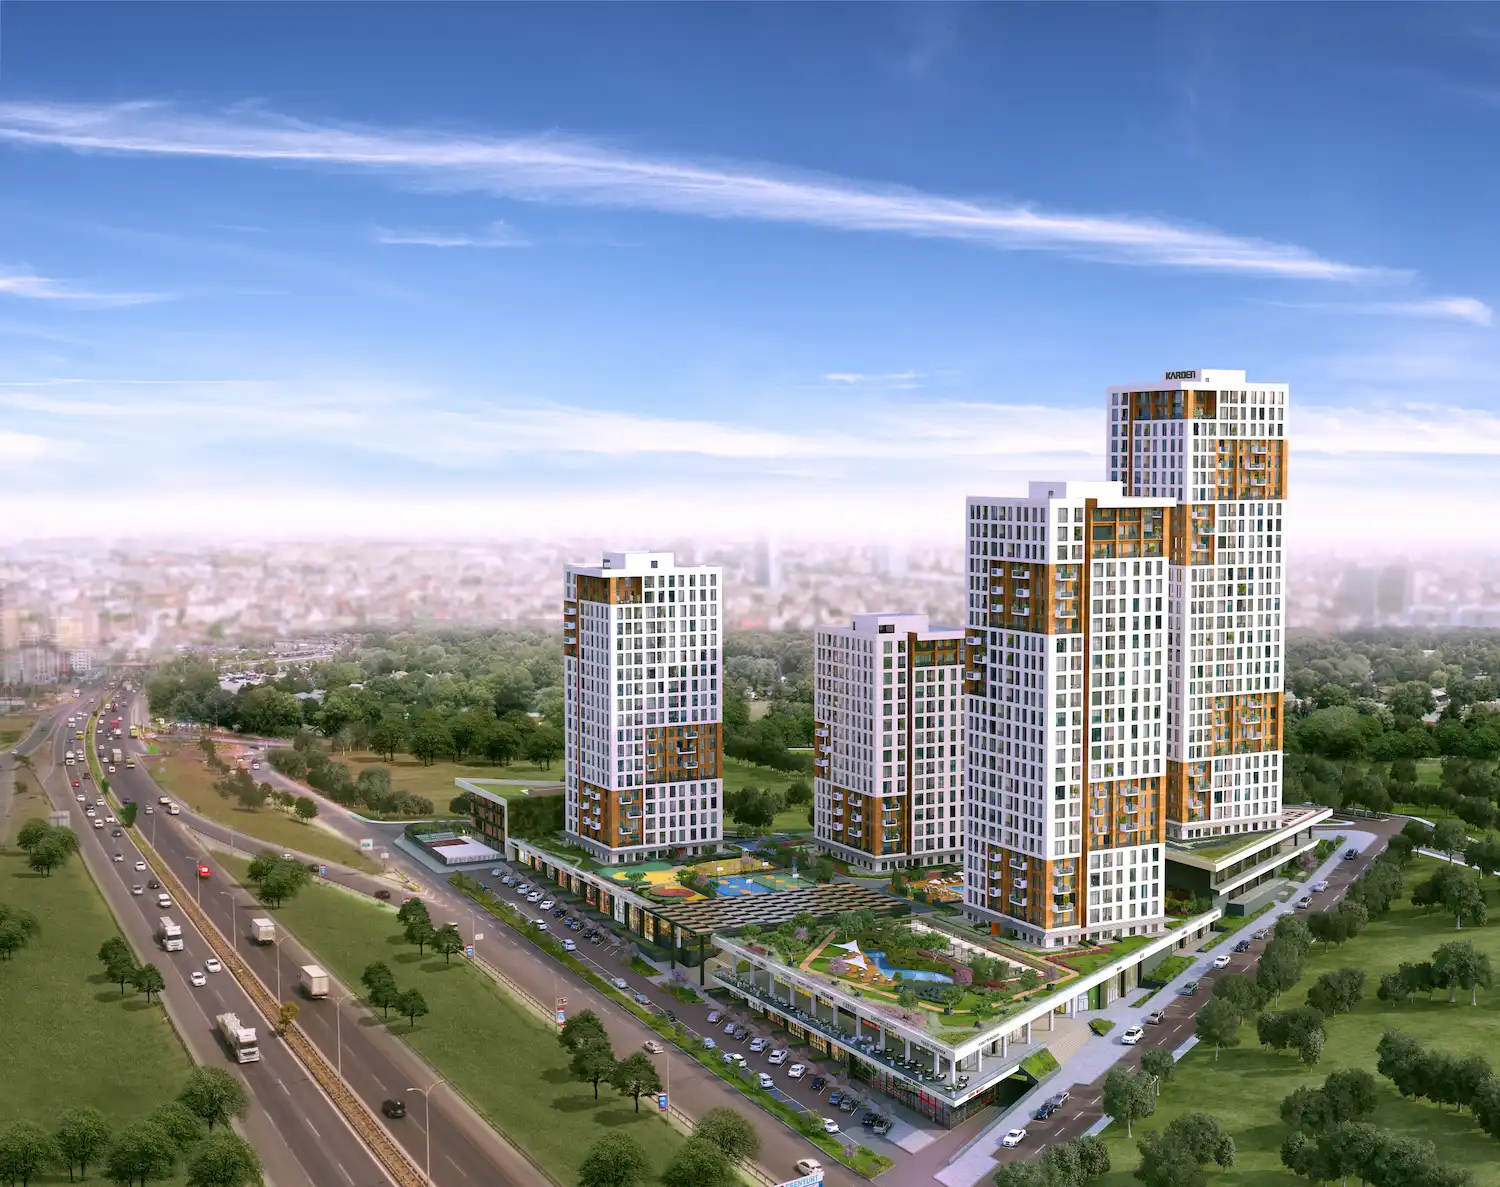
.webp)
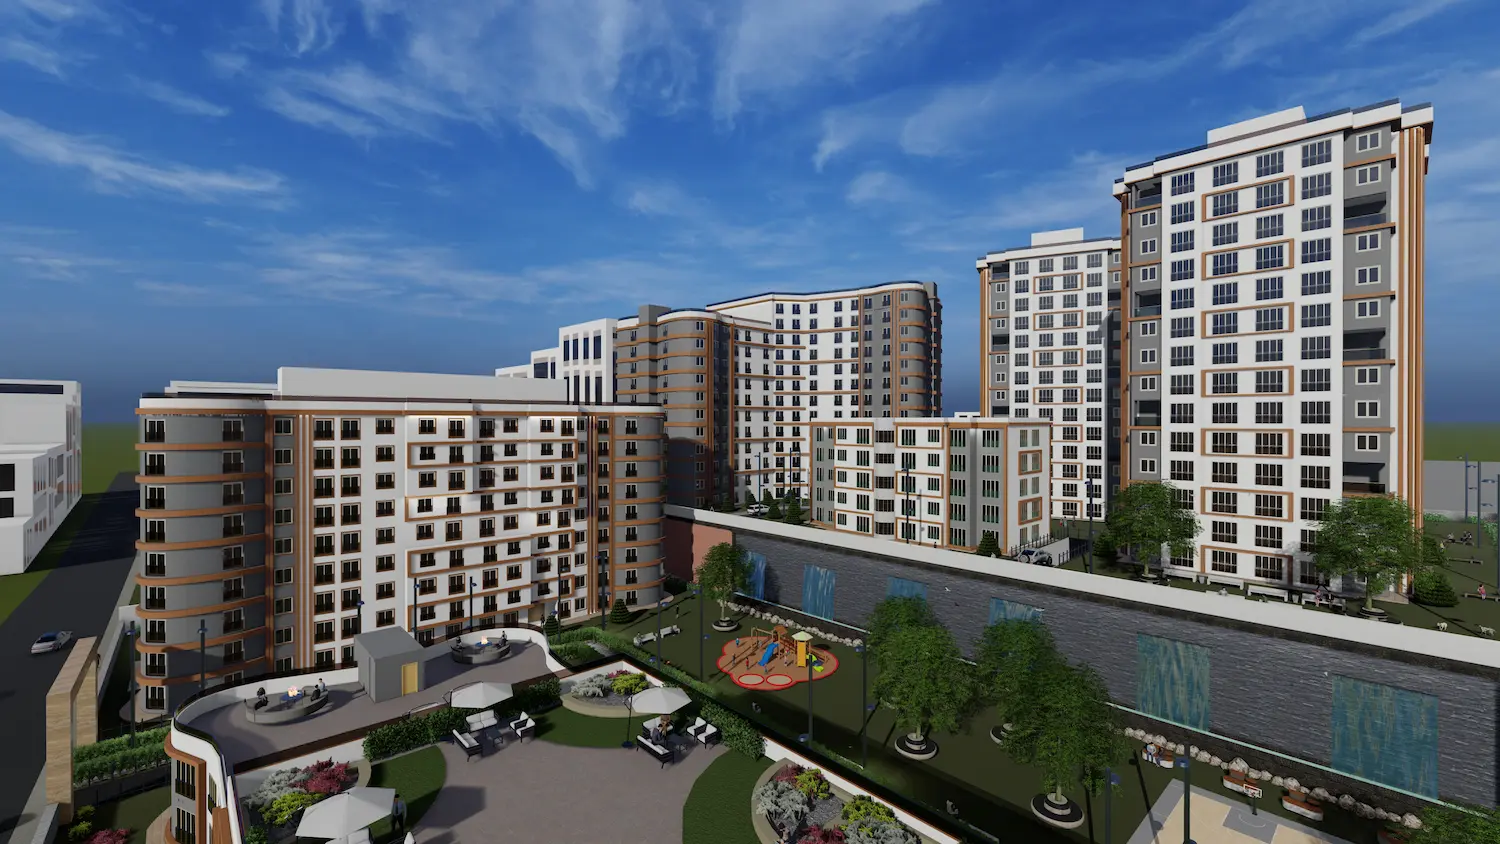

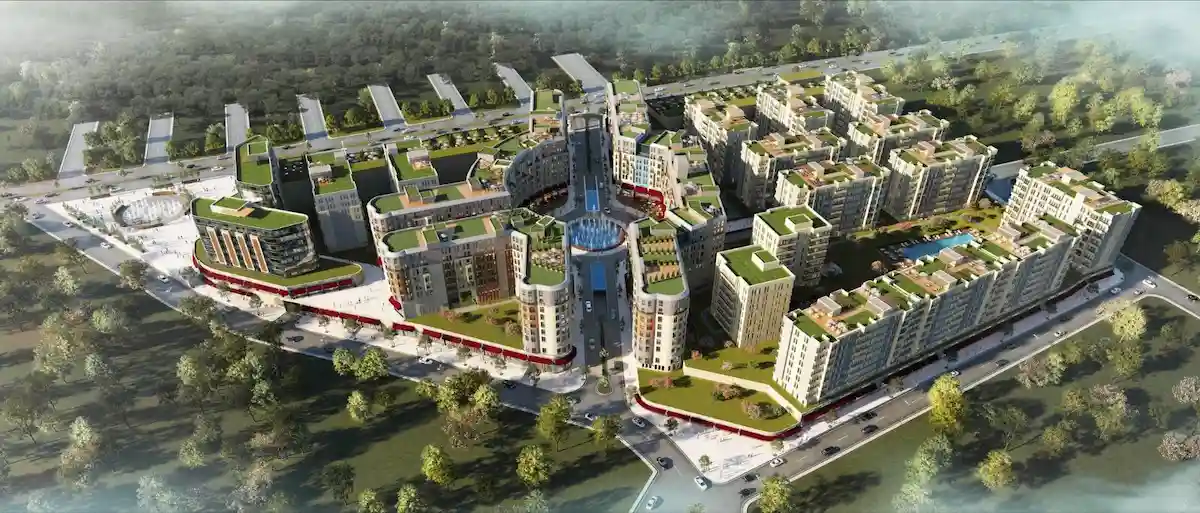
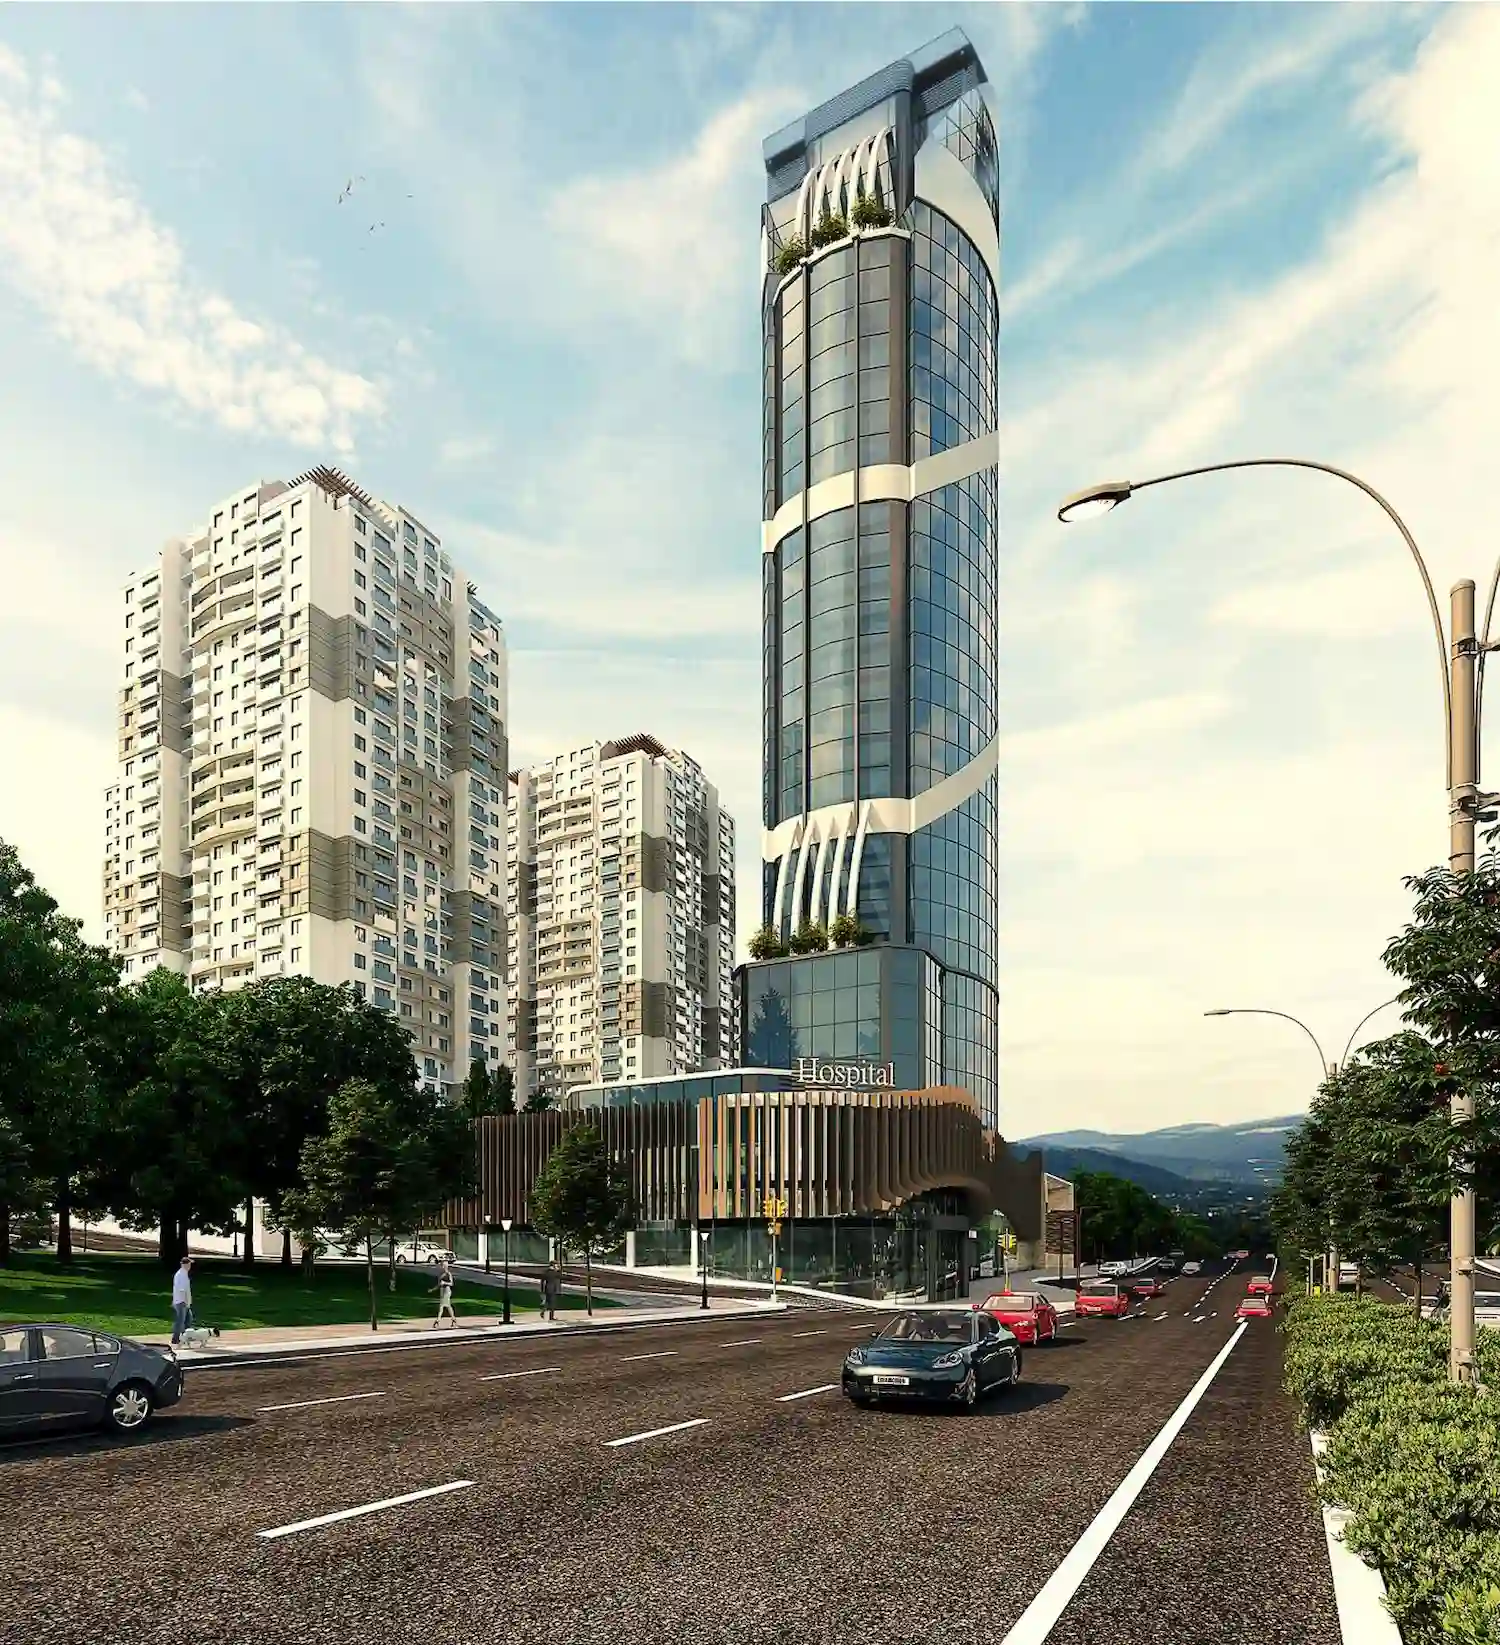
.webp)


.webp)
Have Question Or Suggestion ?
Please Share Your Thought, To Make It Real


