Return on Investment In Turkey
We are providing a financial metric for real estate investors as it helps them to determine the profitability of their real estate investment in Turkey
836$
Average Income
526$ - 1,146$
Min Income - Max Income
123,064$
Cash Price
| Year | Annual Increase | Monthly ROI | Annual ROI |
|---|---|---|---|
| 1 | 8.15 % | 836$ | 10,033$ |
| 2 | 10.19 % | 1,045$ | 12,542$ |
| 3 | 12.74 % | 1,306$ | 15,677$ |
| 4 | 15.92 % | 1,633$ | 19,596$ |
| 5 | 19.90 % | 2,041$ | 24,495$ |
| 6 | 24.88 % | 2,552$ | 30,619$ |
| 7 | 31.10 % | 3,190$ | 38,274$ |
| 8 | 38.88 % | 3,987$ | 47,843$ |
| 9 | 48.60 % | 4,984$ | 59,803$ |
| 10 | 60.74 % | 6,230$ | 74,754$ |
333,638$ 271%
Total ROI For 10 Years
1,146$
Max Income
123,064$
Cash Price
| Year | Annual Increase | Monthly ROI | Annual ROI |
|---|---|---|---|
| 1 | 11.17 % | 1,146$ | 13,749$ |
| 2 | 13.97 % | 1,432$ | 17,187$ |
| 3 | 17.46 % | 1,790$ | 21,483$ |
| 4 | 21.82 % | 2,238$ | 26,854$ |
| 5 | 27.28 % | 2,797$ | 33,568$ |
| 6 | 34.10 % | 3,497$ | 41,960$ |
| 7 | 42.62 % | 4,371$ | 52,450$ |
| 8 | 53.28 % | 5,464$ | 65,562$ |
| 9 | 66.59 % | 6,829$ | 81,953$ |
| 10 | 83.24 % | 8,537$ | 102,441$ |
457,207$ 371%
Total ROI For 10 Years
526$
Min Income
123,064$
Cash Price
| Year | Annual Increase | Monthly ROI | Annual ROI |
|---|---|---|---|
| 1 | 5.13 % | 526$ | 6,317$ |
| 2 | 6.42 % | 658$ | 7,897$ |
| 3 | 8.02 % | 823$ | 9,871$ |
| 4 | 10.03 % | 1,028$ | 12,338$ |
| 5 | 12.53 % | 1,285$ | 15,423$ |
| 6 | 15.67 % | 1,607$ | 19,279$ |
| 7 | 19.58 % | 2,008$ | 24,099$ |
| 8 | 24.48 % | 2,510$ | 30,123$ |
| 9 | 30.60 % | 3,138$ | 37,654$ |
| 10 | 38.25 % | 3,922$ | 47,067$ |
210,068$ 170%
Total ROI For 10 Years
District Classification
Rating
b+
Area map
Statistics
Population
381,110
Social Status
Married : 67%
Unmarried : 26%
area
230 Km2
Price Changes Over Last 5 Years
1 Year Change
17.79%
3 Year Change
202%
5 Year Change
253%
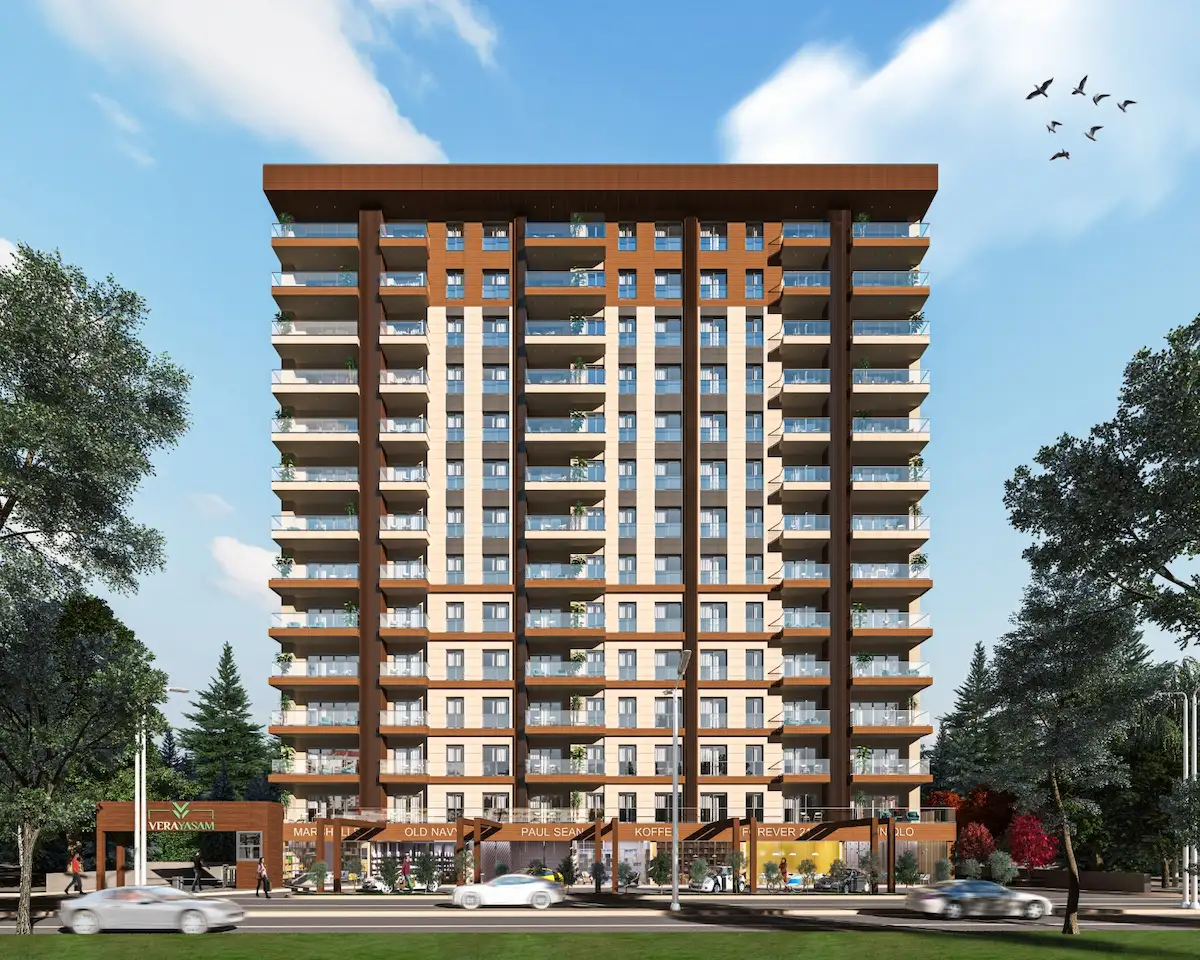
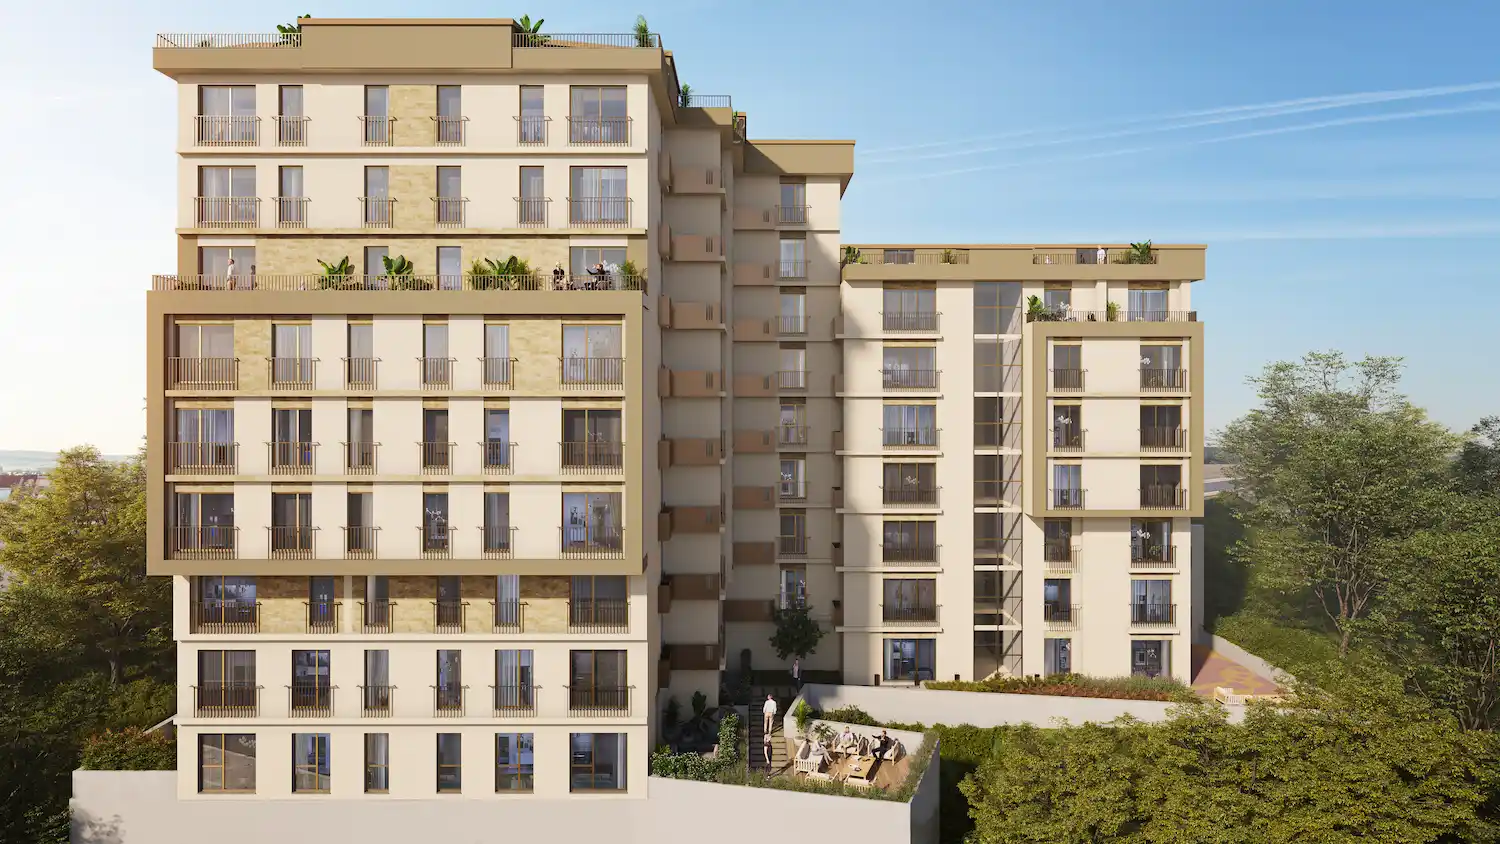
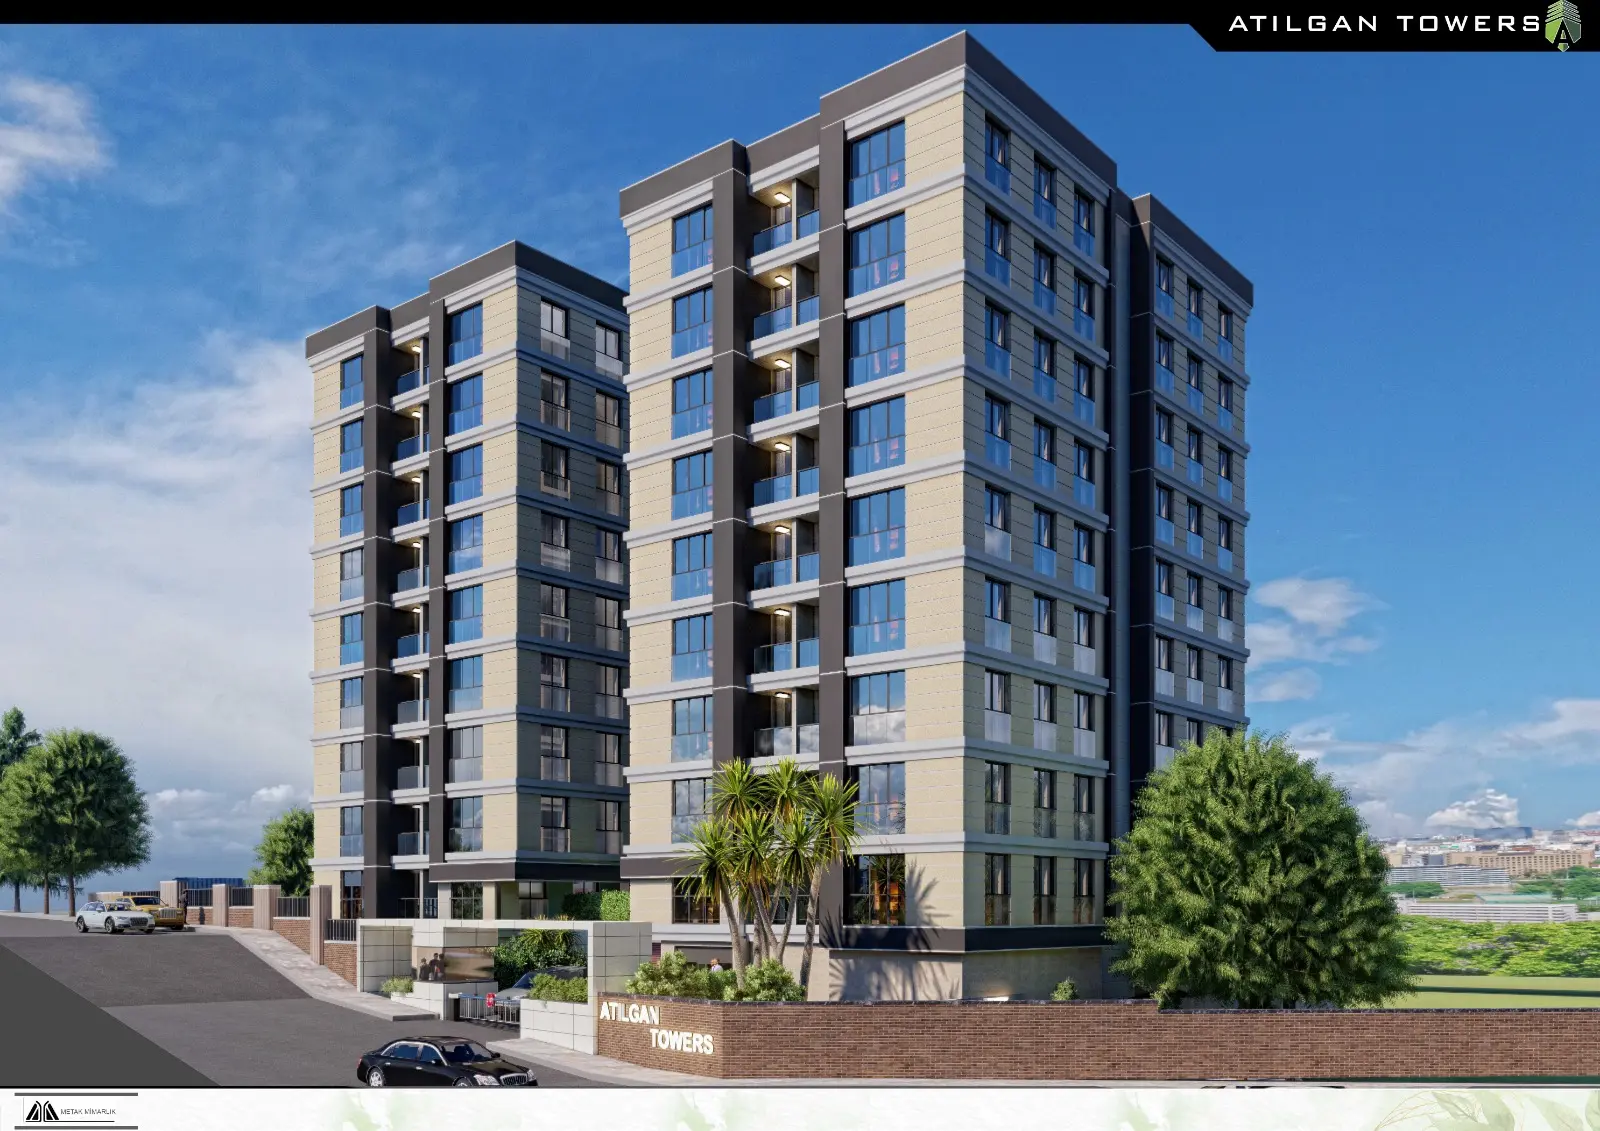
Projects Have same ROI in This Area
.webp)


Have Question Or Suggestion ?
Please Share Your Thought, To Make It Real


