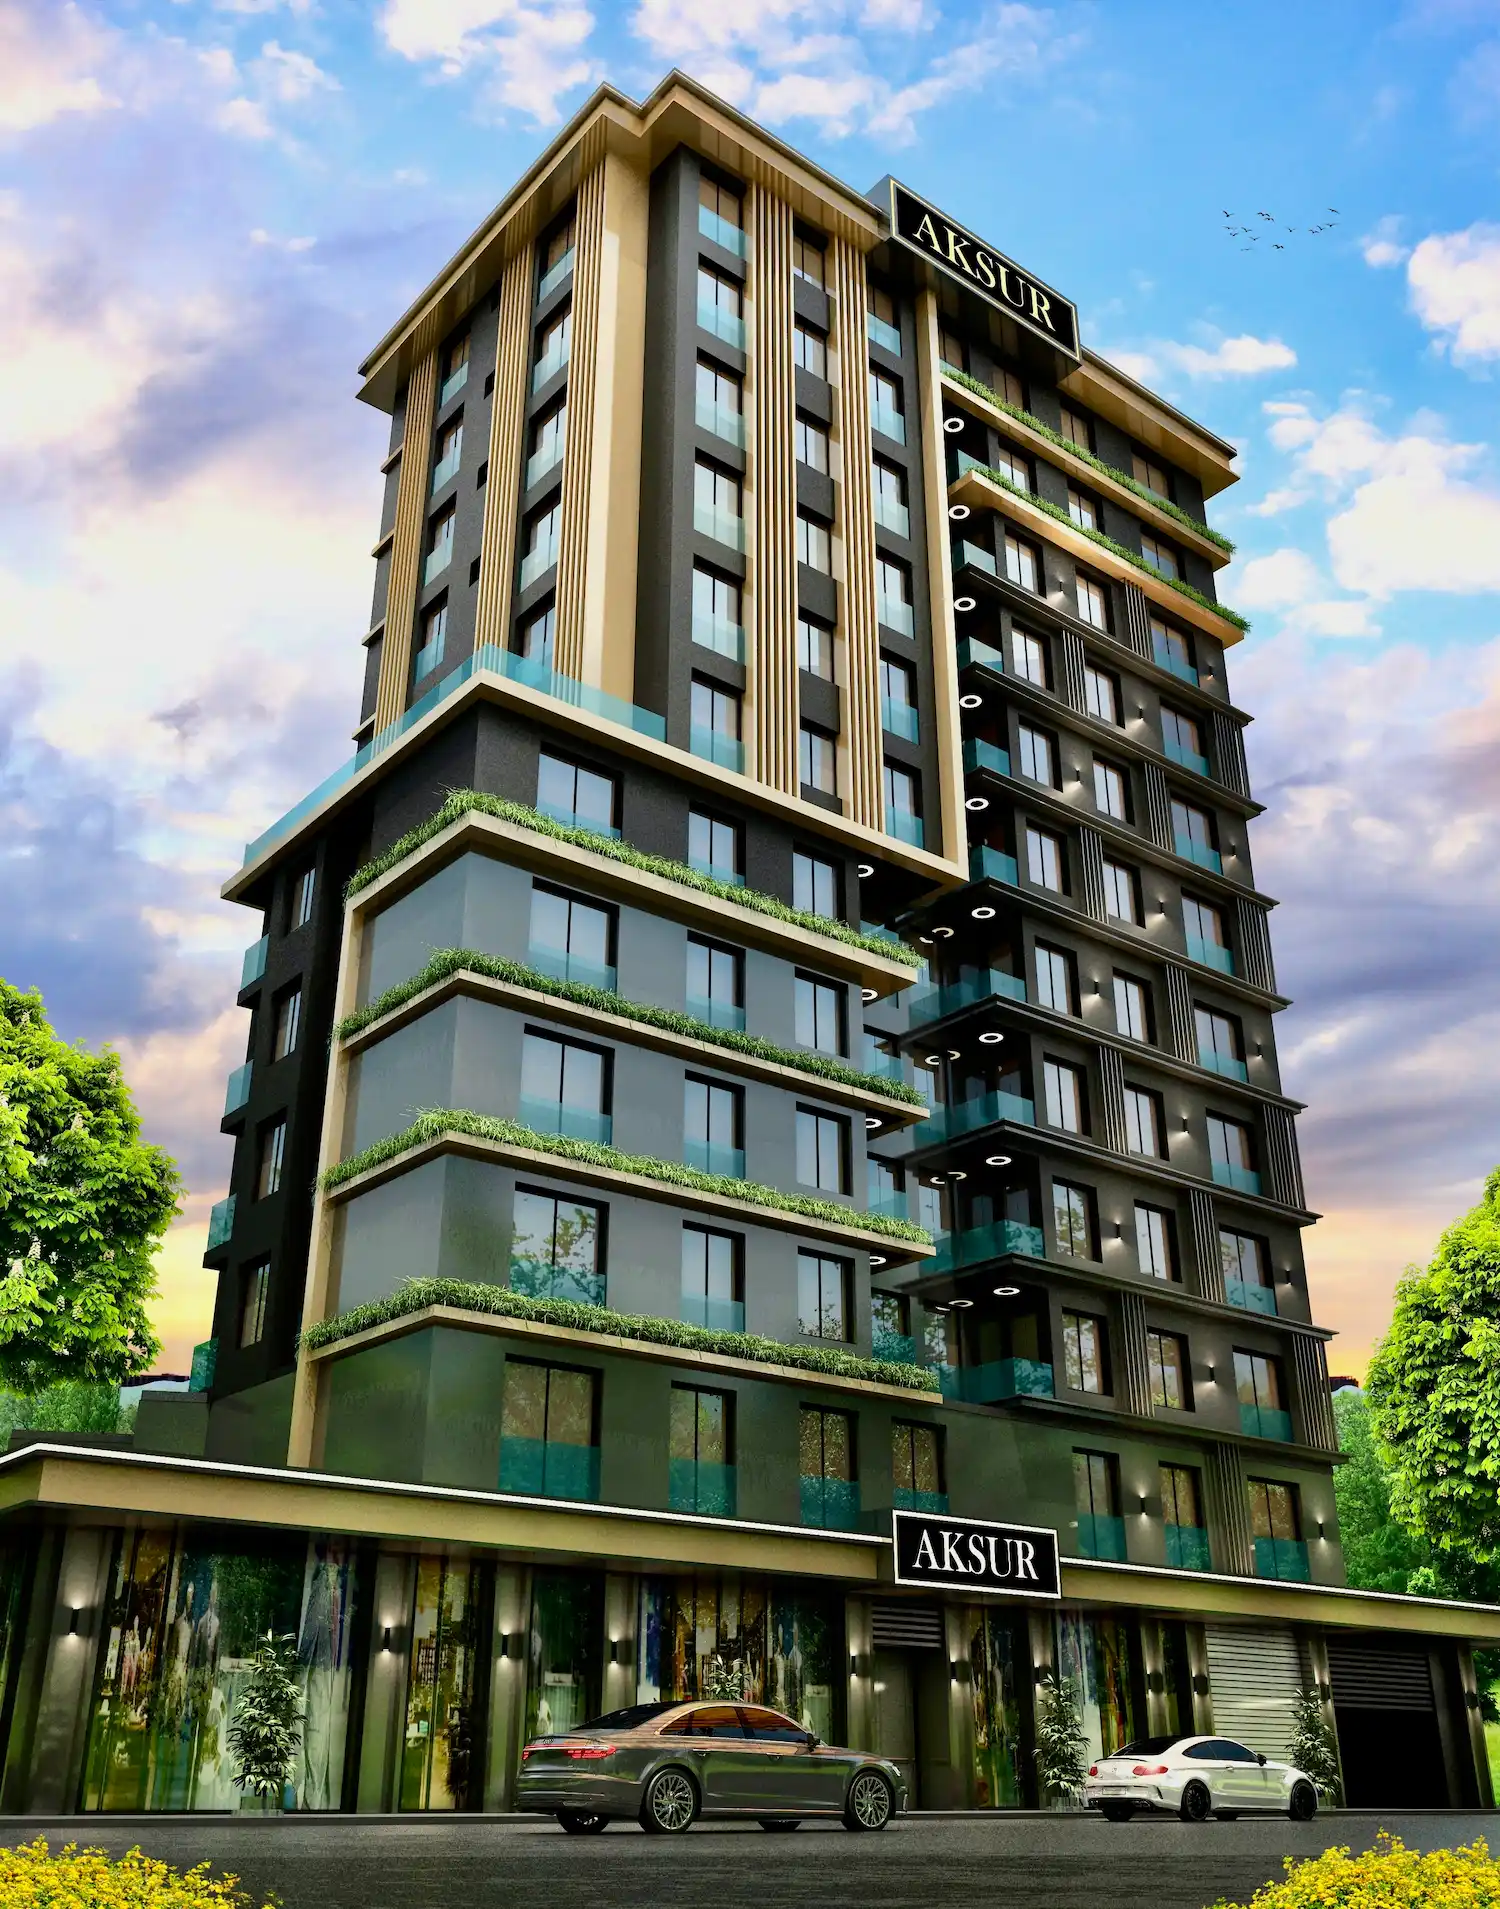
Return on Investment In Turkey
We are providing a financial metric for real estate investors as it helps them to determine the profitability of their real estate investment in Turkey
831$
Average Income
523$ - 1,138$
Min Income - Max Income
179,099$
Cash Price
| Year | Annual Increase | Monthly ROI | Annual ROI |
|---|---|---|---|
| 1 | 5.56 % | 831$ | 9,967$ |
| 2 | 6.96 % | 1,038$ | 12,458$ |
| 3 | 8.70 % | 1,298$ | 15,573$ |
| 4 | 10.87 % | 1,622$ | 19,466$ |
| 5 | 13.59 % | 2,028$ | 24,333$ |
| 6 | 16.98 % | 2,535$ | 30,416$ |
| 7 | 21.23 % | 3,168$ | 38,020$ |
| 8 | 26.54 % | 3,960$ | 47,525$ |
| 9 | 33.17 % | 4,951$ | 59,407$ |
| 10 | 41.46 % | 6,188$ | 74,258$ |
331,424$ 185%
Total ROI For 10 Years
1,138$
Max Income
179,099$
Cash Price
| Year | Annual Increase | Monthly ROI | Annual ROI |
|---|---|---|---|
| 1 | 7.63 % | 1,138$ | 13,658$ |
| 2 | 9.53 % | 1,423$ | 17,073$ |
| 3 | 11.92 % | 1,778$ | 21,341$ |
| 4 | 14.89 % | 2,223$ | 26,676$ |
| 5 | 18.62 % | 2,779$ | 33,345$ |
| 6 | 23.27 % | 3,473$ | 41,681$ |
| 7 | 29.09 % | 4,342$ | 52,102$ |
| 8 | 36.36 % | 5,427$ | 65,127$ |
| 9 | 45.45 % | 6,784$ | 81,409$ |
| 10 | 56.82 % | 8,480$ | 101,761$ |
454,173$ 253%
Total ROI For 10 Years
523$
Min Income
179,099$
Cash Price
| Year | Annual Increase | Monthly ROI | Annual ROI |
|---|---|---|---|
| 1 | 3.50 % | 523$ | 6,275$ |
| 2 | 4.38 % | 654$ | 7,844$ |
| 3 | 5.47 % | 817$ | 9,805$ |
| 4 | 6.84 % | 1,021$ | 12,257$ |
| 5 | 8.55 % | 1,277$ | 15,321$ |
| 6 | 10.69 % | 1,596$ | 19,151$ |
| 7 | 13.37 % | 1,995$ | 23,939$ |
| 8 | 16.71 % | 2,494$ | 29,923$ |
| 9 | 20.88 % | 3,117$ | 37,404$ |
| 10 | 26.11 % | 3,896$ | 46,755$ |
208,674$ 116%
Total ROI For 10 Years
District Classification
Rating
b+
Area map
Statistics
Population
381,110
Social Status
Married : 67%
Unmarried : 26%
area
230 Km2
Price Changes Over Last 5 Years
1 Year Change
17.79%
3 Year Change
202%
5 Year Change
253%
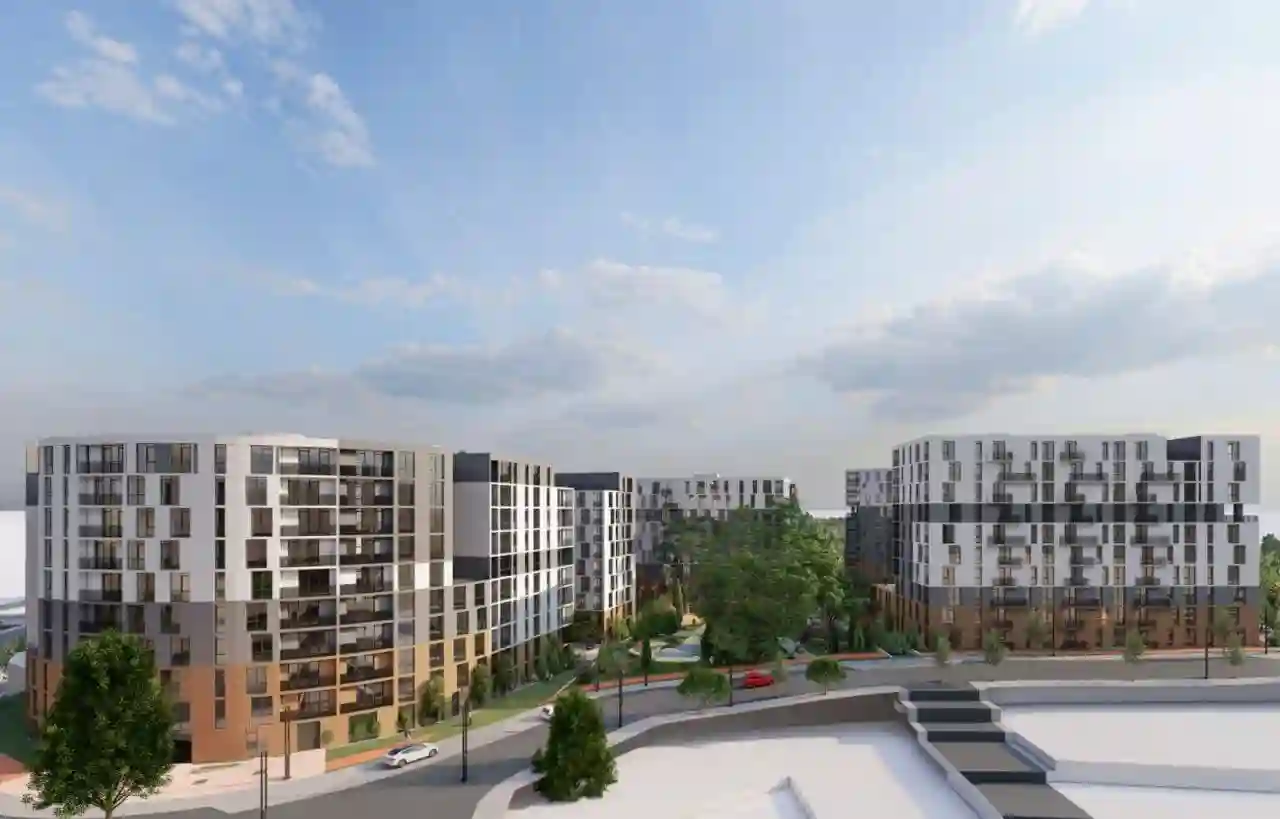
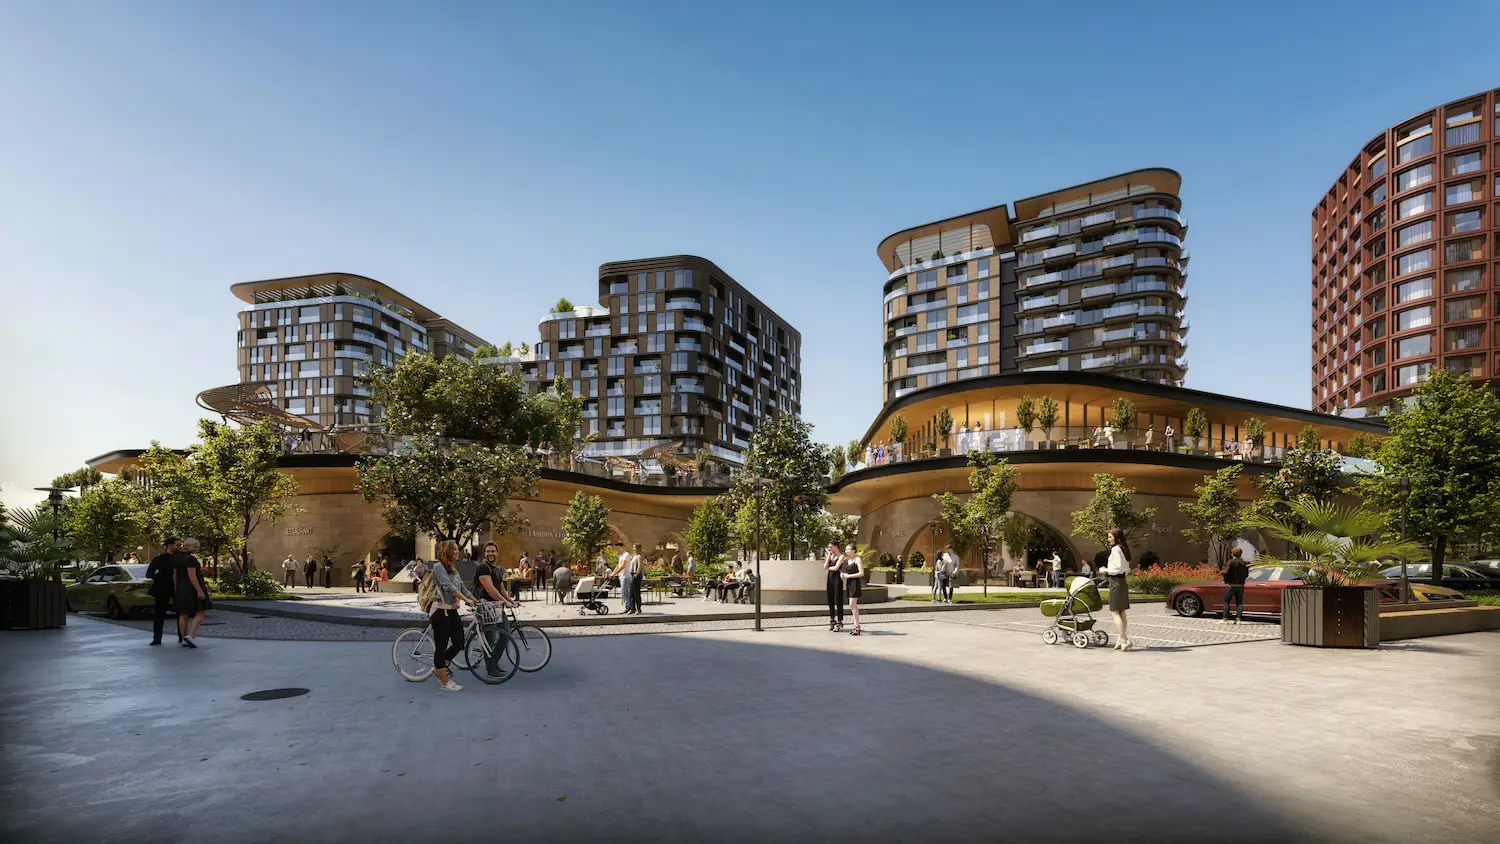
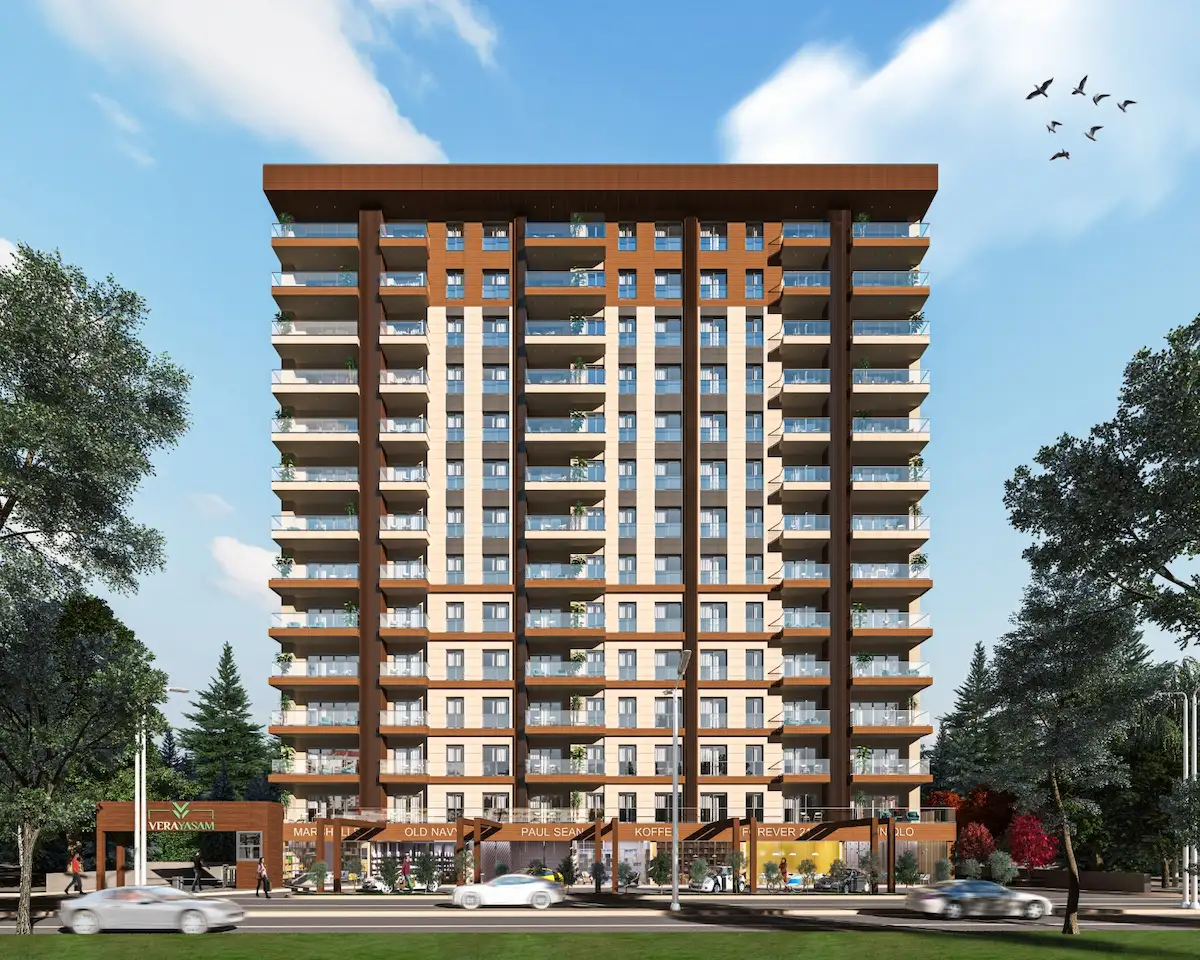
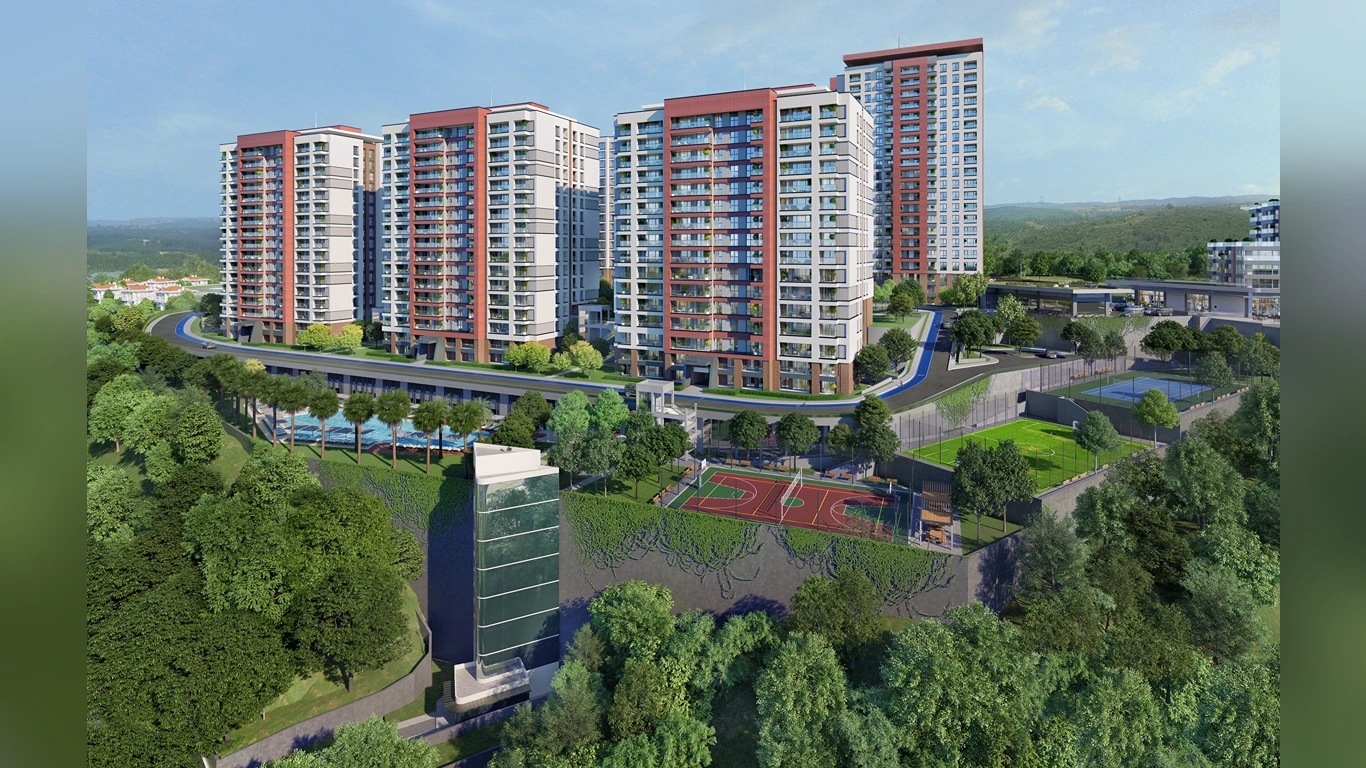
Projects Have same ROI in This Area


Have Question Or Suggestion ?
Please Share Your Thought, To Make It Real


