Return on Investment In Turkey
We are providing a financial metric for real estate investors as it helps them to determine the profitability of their real estate investment in Turkey
1,236$
Average Income
927$ - 1,545$
Min Income - Max Income
185,582$
Cash Price
| Year | Annual Increase | Monthly ROI | Annual ROI |
|---|---|---|---|
| 1 | 7.99 % | 1,236$ | 14,829$ |
| 2 | 9.99 % | 1,545$ | 18,536$ |
| 3 | 12.49 % | 1,931$ | 23,170$ |
| 4 | 15.61 % | 2,414$ | 28,963$ |
| 5 | 19.51 % | 3,017$ | 36,204$ |
| 6 | 24.39 % | 3,771$ | 45,255$ |
| 7 | 30.48 % | 4,714$ | 56,568$ |
| 8 | 38.10 % | 5,893$ | 70,710$ |
| 9 | 47.63 % | 7,366$ | 88,388$ |
| 10 | 59.53 % | 9,207$ | 110,485$ |
493,107$ 265%
Total ROI For 10 Years
1,545$
Max Income
185,582$
Cash Price
| Year | Annual Increase | Monthly ROI | Annual ROI |
|---|---|---|---|
| 1 | 9.99 % | 1,545$ | 18,536$ |
| 2 | 12.49 % | 1,931$ | 23,170$ |
| 3 | 15.61 % | 2,414$ | 28,963$ |
| 4 | 19.51 % | 3,017$ | 36,204$ |
| 5 | 24.39 % | 3,771$ | 45,255$ |
| 6 | 30.48 % | 4,714$ | 56,568$ |
| 7 | 38.10 % | 5,893$ | 70,710$ |
| 8 | 47.63 % | 7,366$ | 88,388$ |
| 9 | 59.53 % | 9,207$ | 110,485$ |
| 10 | 74.42 % | 11,509$ | 138,106$ |
616,384$ 332%
Total ROI For 10 Years
927$
Min Income
185,582$
Cash Price
| Year | Annual Increase | Monthly ROI | Annual ROI |
|---|---|---|---|
| 1 | 5.99 % | 927$ | 11,122$ |
| 2 | 7.49 % | 1,159$ | 13,902$ |
| 3 | 9.36 % | 1,448$ | 17,378$ |
| 4 | 11.70 % | 1,810$ | 21,722$ |
| 5 | 14.63 % | 2,263$ | 27,153$ |
| 6 | 18.29 % | 2,828$ | 33,941$ |
| 7 | 22.86 % | 3,536$ | 42,426$ |
| 8 | 28.58 % | 4,419$ | 53,033$ |
| 9 | 35.72 % | 5,524$ | 66,291$ |
| 10 | 44.65 % | 6,905$ | 82,863$ |
369,830$ 199%
Total ROI For 10 Years
District Classification
Rating
b+
Area map
Statistics
Population
381,110
Social Status
Married : 67%
Unmarried : 26%
area
230 Km2
Price Changes Over Last 5 Years
1 Year Change
17.79%
3 Year Change
202%
5 Year Change
253%
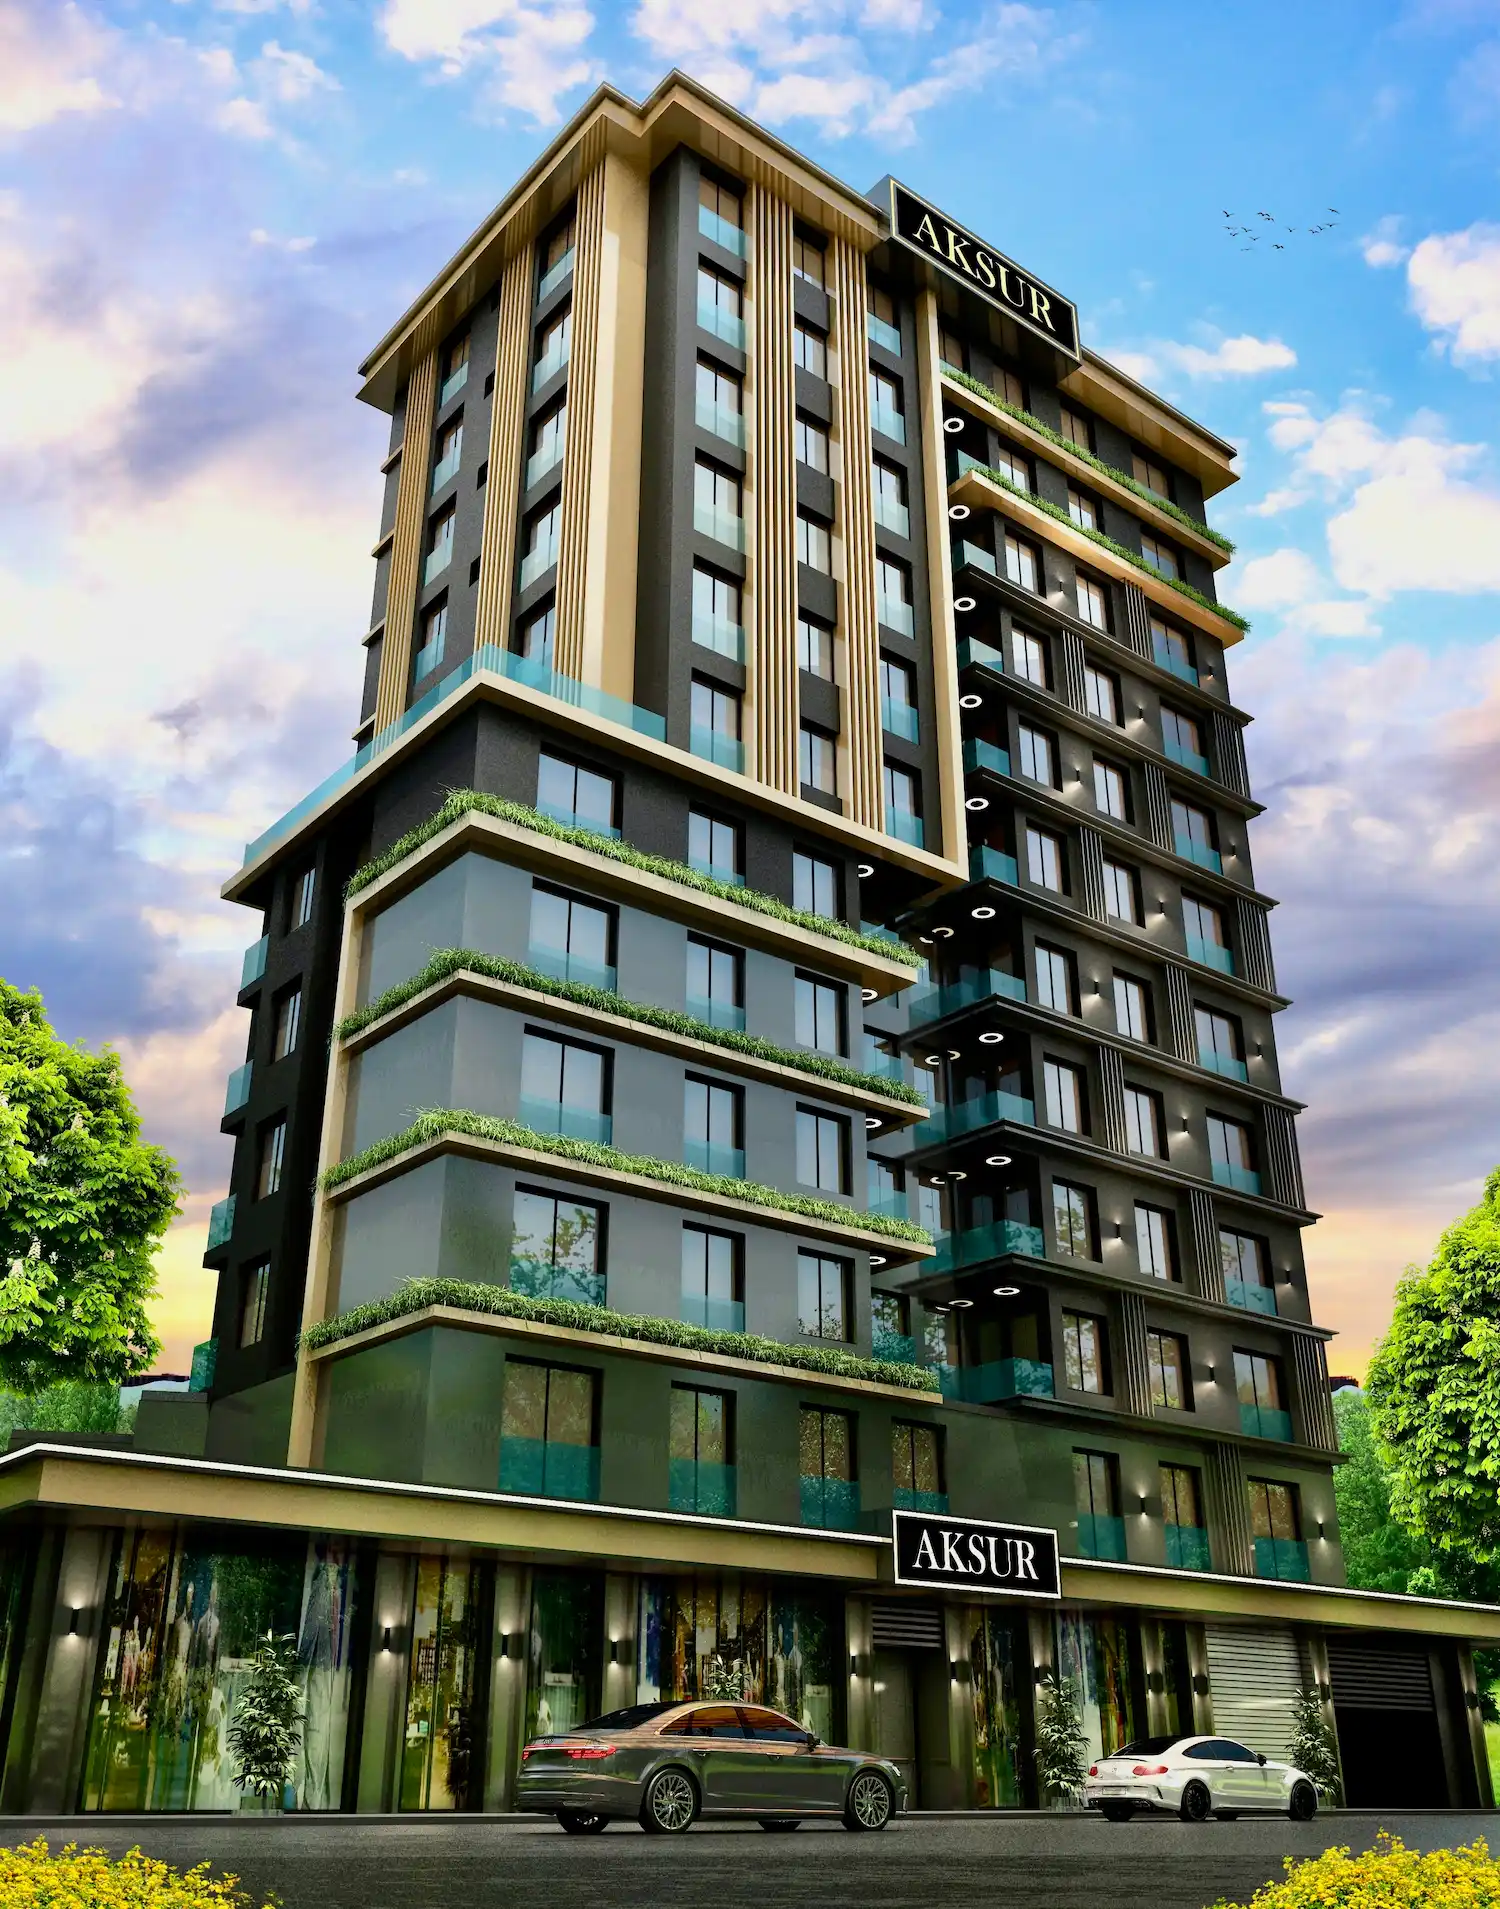
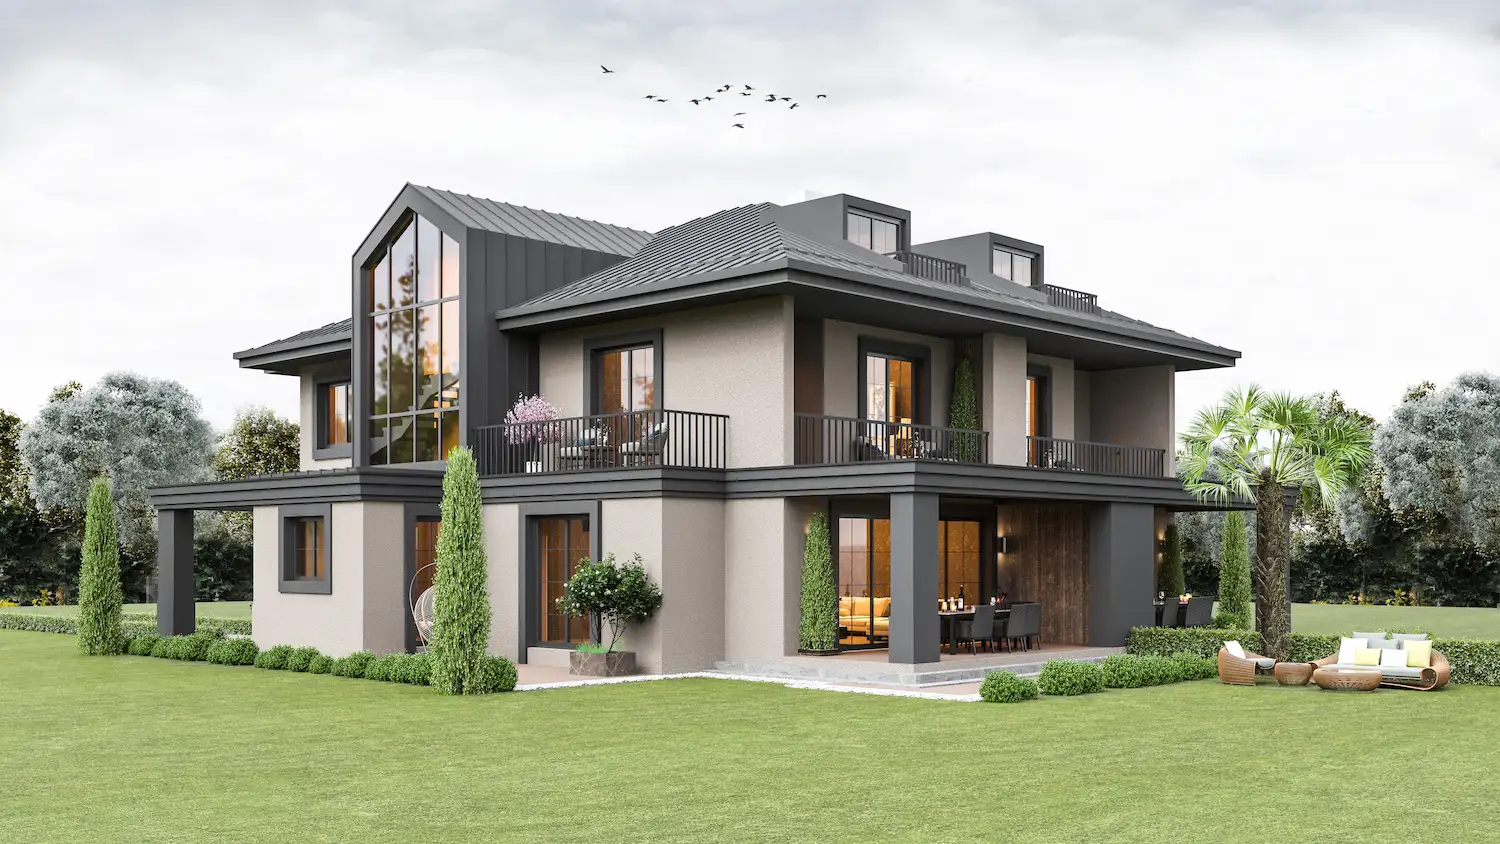
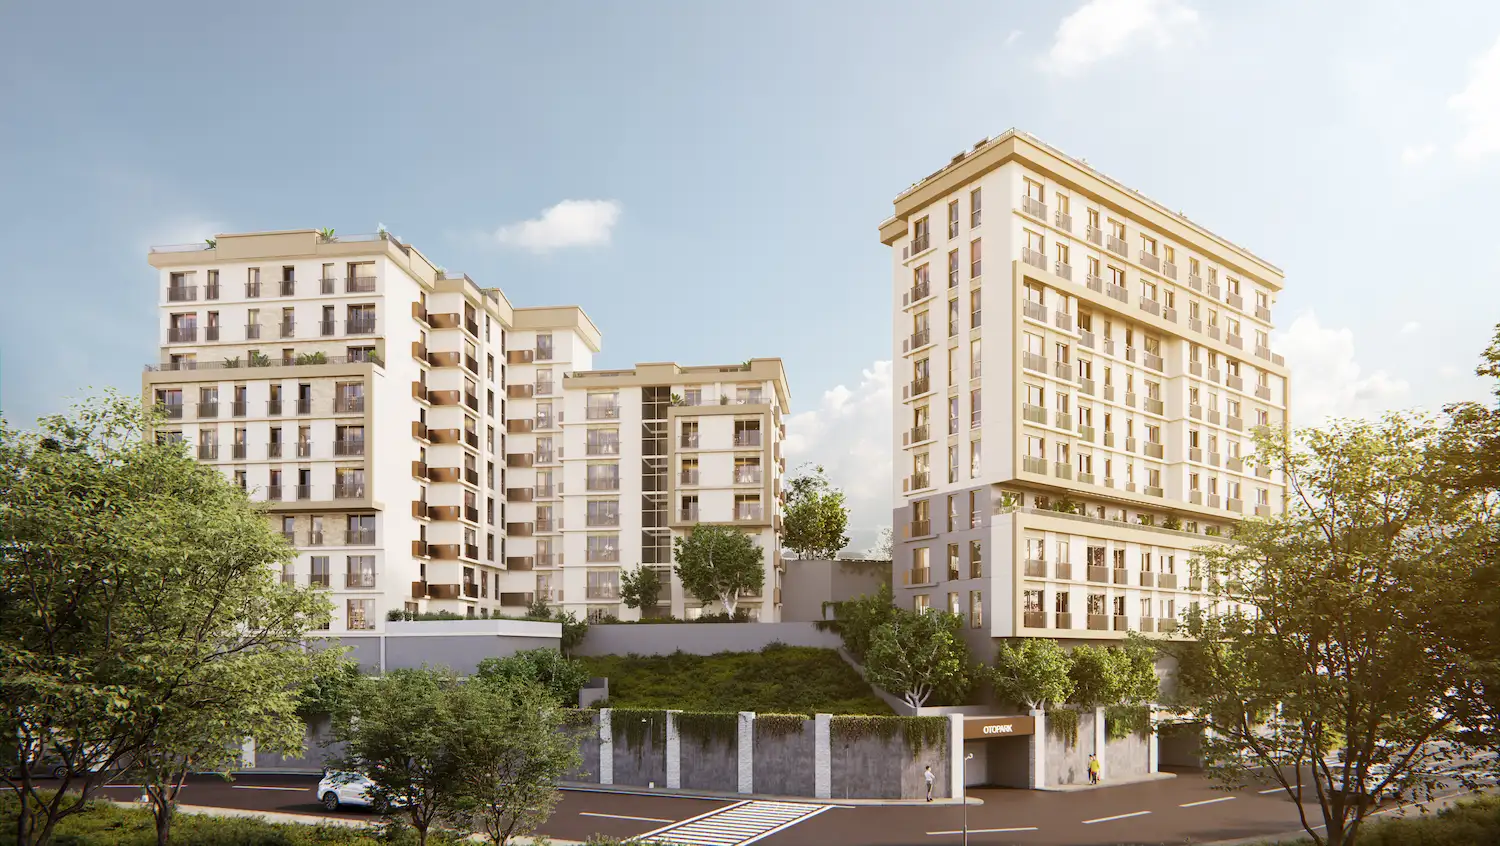
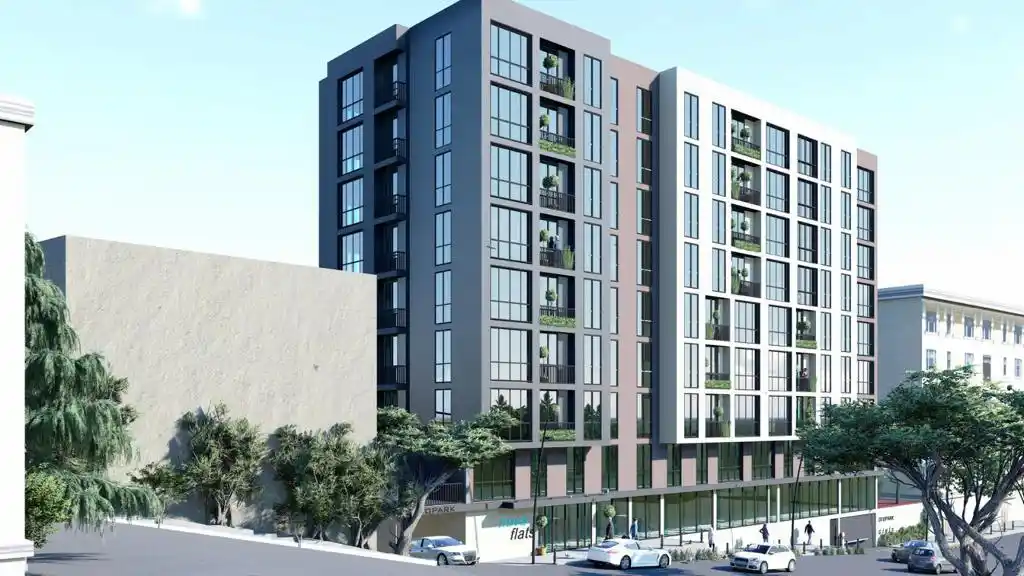
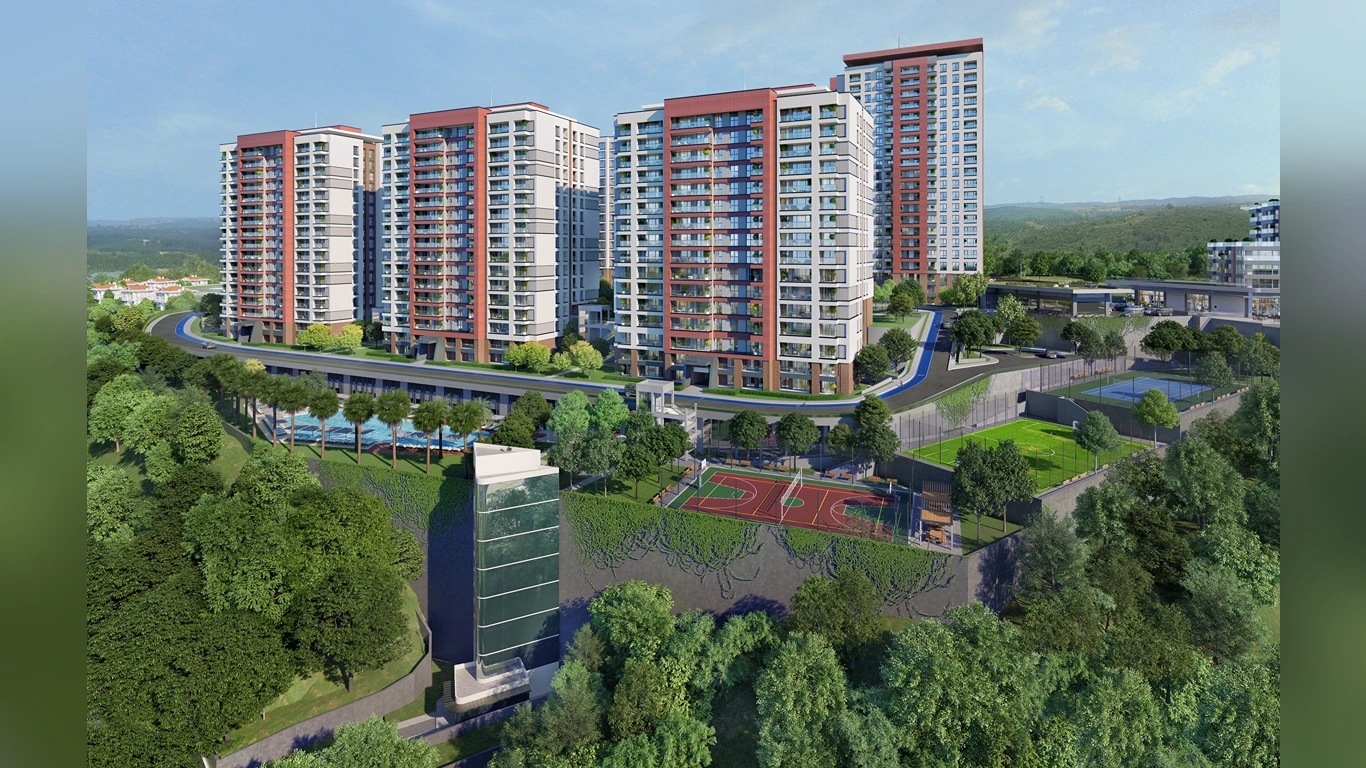
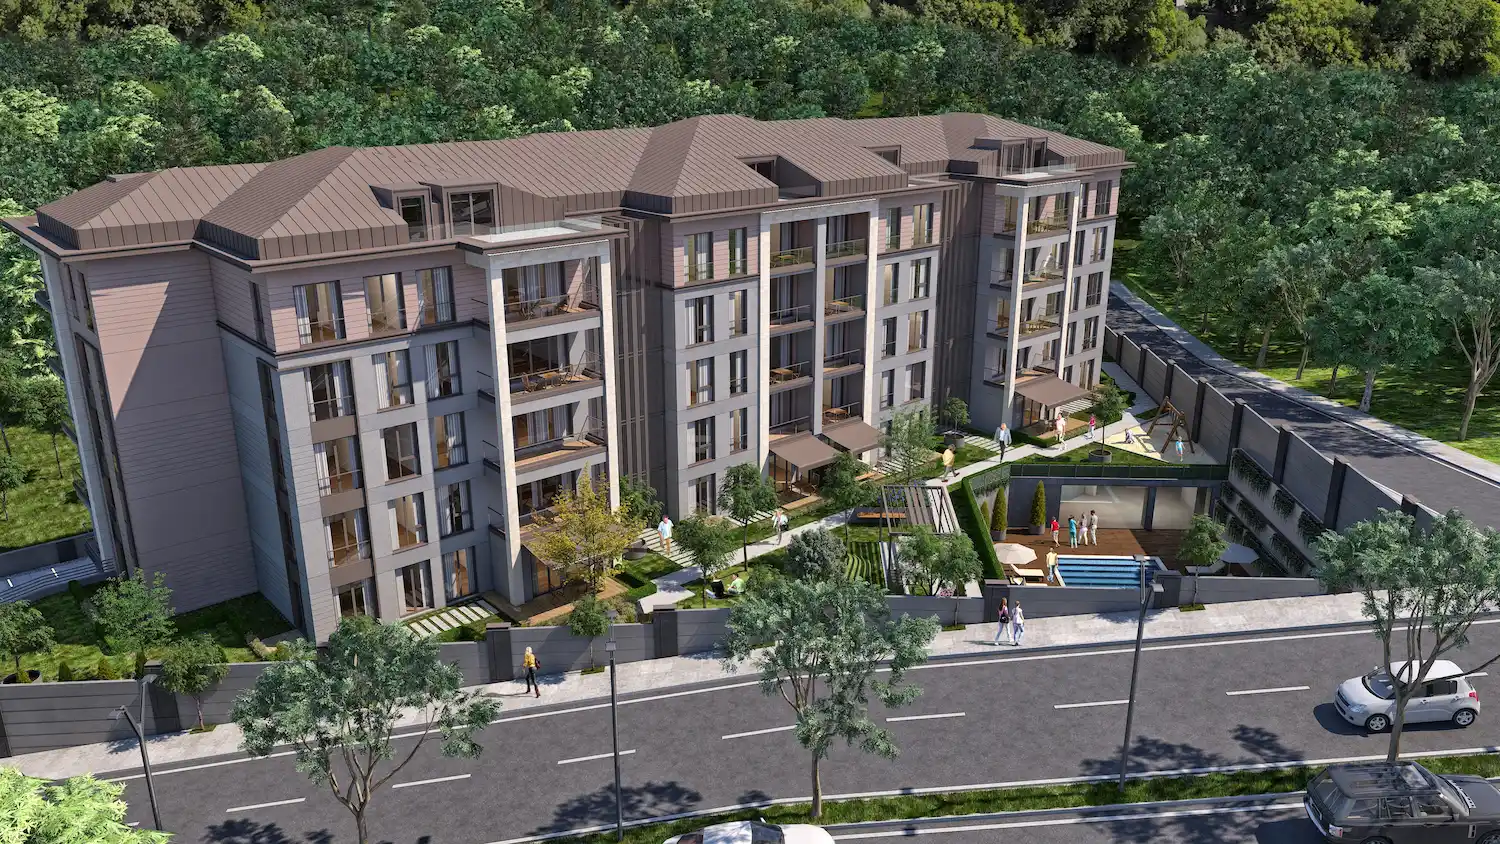
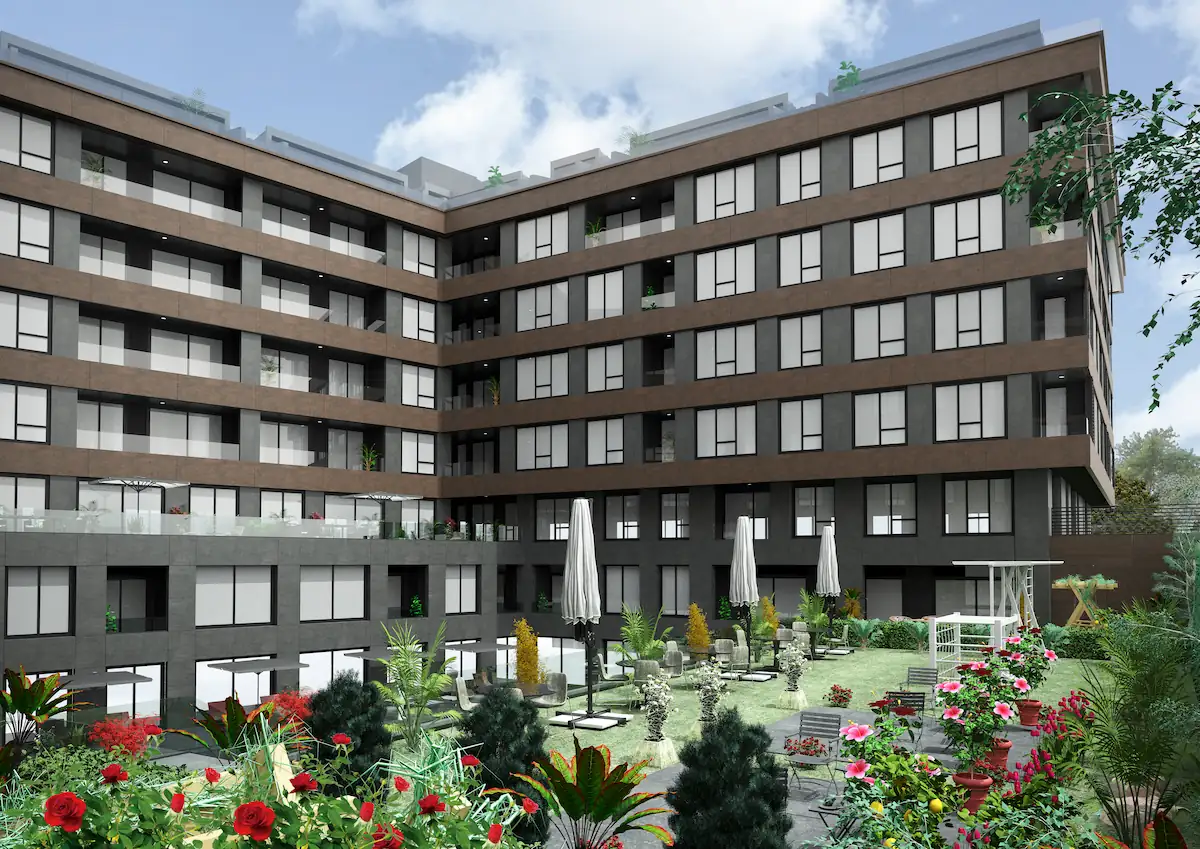
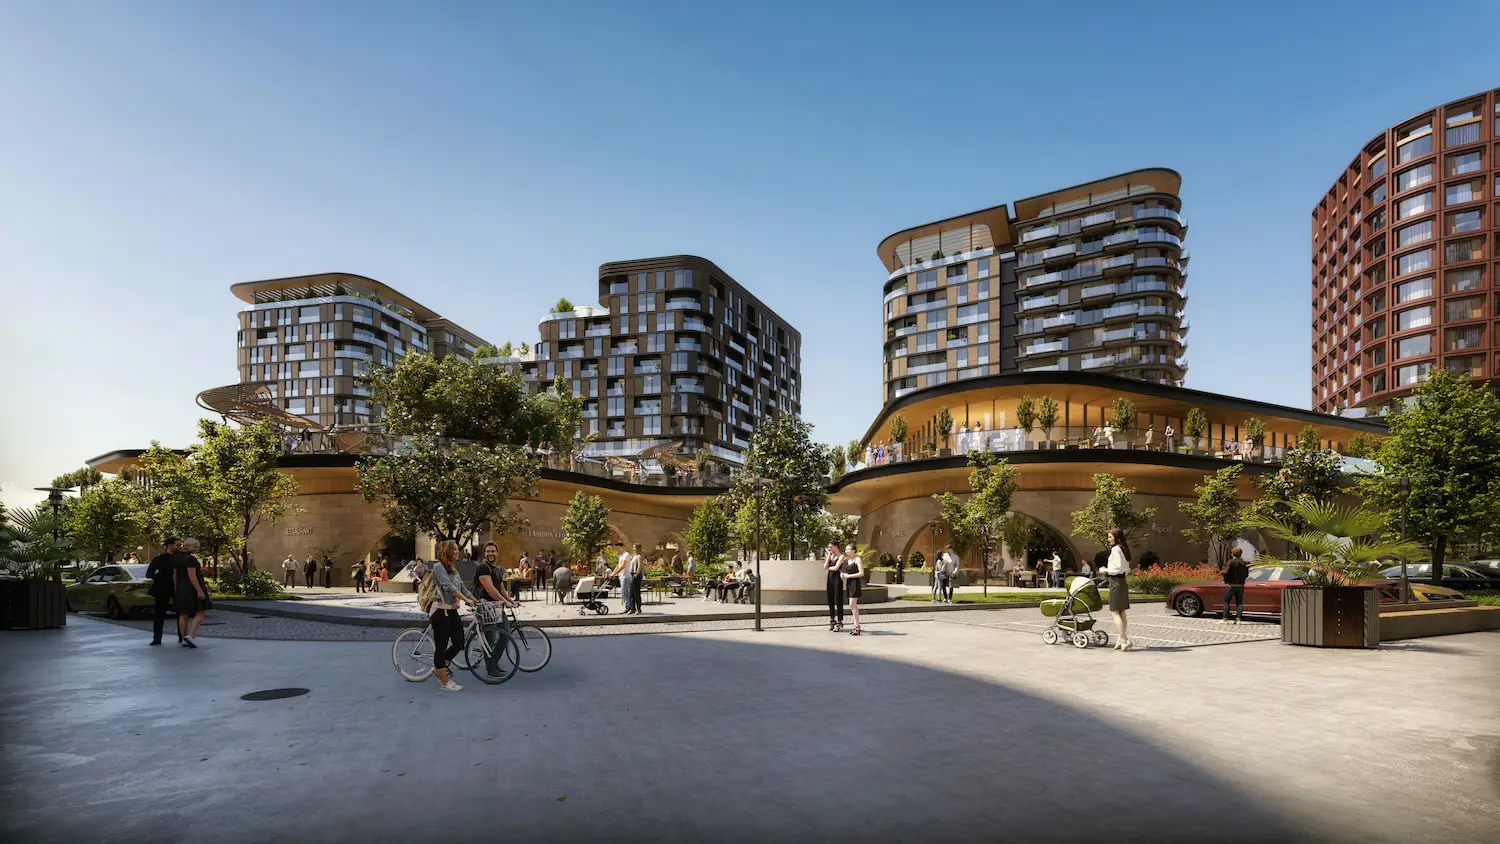
Projects Have same ROI in This Area


Have Question Or Suggestion ?
Please Share Your Thought, To Make It Real


