Return on Investment In Turkey
We are providing a financial metric for real estate investors as it helps them to determine the profitability of their real estate investment in Turkey
1,782$
Average Income
1,395$ - 2,169$
Min Income - Max Income
431,241$
Cash Price
| Year | Annual Increase | Monthly ROI | Annual ROI |
|---|---|---|---|
| 1 | 4.96 % | 1,782$ | 21,384$ |
| 2 | 6.20 % | 2,228$ | 26,730$ |
| 3 | 7.75 % | 2,784$ | 33,413$ |
| 4 | 9.69 % | 3,480$ | 41,766$ |
| 5 | 12.11 % | 4,351$ | 52,207$ |
| 6 | 15.13 % | 5,438$ | 65,259$ |
| 7 | 18.92 % | 6,798$ | 81,574$ |
| 8 | 23.65 % | 8,497$ | 101,967$ |
| 9 | 29.56 % | 10,622$ | 127,459$ |
| 10 | 36.95 % | 13,277$ | 159,324$ |
711,082$ 164%
Total ROI For 10 Years
2,169$
Max Income
431,241$
Cash Price
| Year | Annual Increase | Monthly ROI | Annual ROI |
|---|---|---|---|
| 1 | 6.04 % | 2,169$ | 26,033$ |
| 2 | 7.55 % | 2,712$ | 32,541$ |
| 3 | 9.43 % | 3,390$ | 40,676$ |
| 4 | 11.79 % | 4,237$ | 50,845$ |
| 5 | 14.74 % | 5,296$ | 63,557$ |
| 6 | 18.42 % | 6,620$ | 79,446$ |
| 7 | 23.03 % | 8,276$ | 99,307$ |
| 8 | 28.79 % | 10,344$ | 124,134$ |
| 9 | 35.98 % | 12,931$ | 155,167$ |
| 10 | 44.98 % | 16,163$ | 193,959$ |
865,665$ 200%
Total ROI For 10 Years
1,395$
Min Income
431,241$
Cash Price
| Year | Annual Increase | Monthly ROI | Annual ROI |
|---|---|---|---|
| 1 | 3.88 % | 1,395$ | 16,735$ |
| 2 | 4.85 % | 1,743$ | 20,919$ |
| 3 | 6.06 % | 2,179$ | 26,149$ |
| 4 | 7.58 % | 2,724$ | 32,686$ |
| 5 | 9.47 % | 3,405$ | 40,858$ |
| 6 | 11.84 % | 4,256$ | 51,072$ |
| 7 | 14.80 % | 5,320$ | 63,840$ |
| 8 | 18.50 % | 6,650$ | 79,800$ |
| 9 | 23.13 % | 8,313$ | 99,750$ |
| 10 | 28.91 % | 10,391$ | 124,688$ |
556,499$ 129%
Total ROI For 10 Years
District Classification
Rating
b+
Area map
Statistics
Population
381,110
Social Status
Married : 67%
Unmarried : 26%
area
230 Km2
Price Changes Over Last 5 Years
1 Year Change
17.79%
3 Year Change
202%
5 Year Change
253%
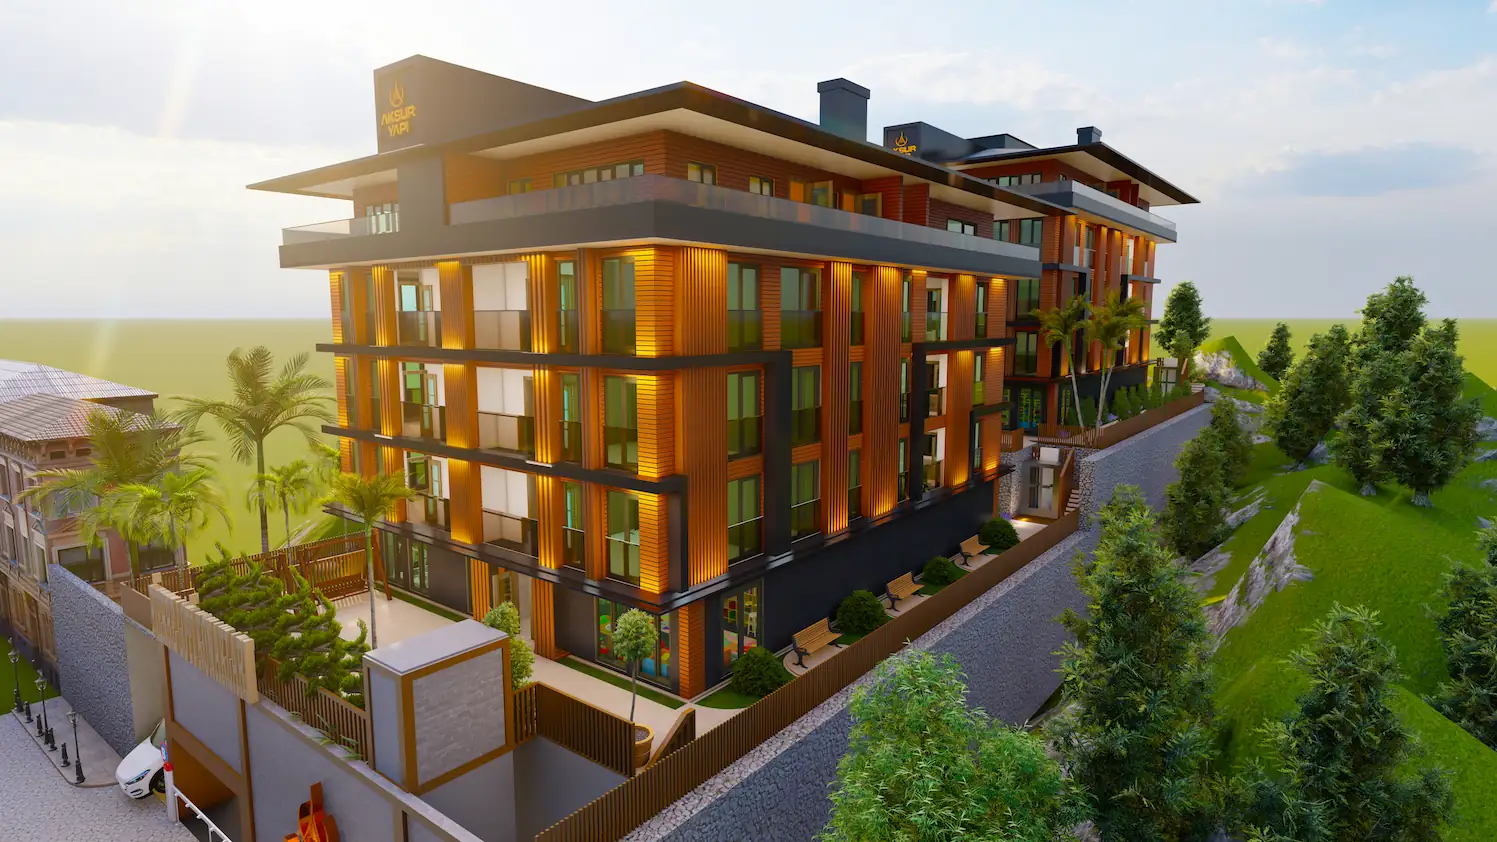
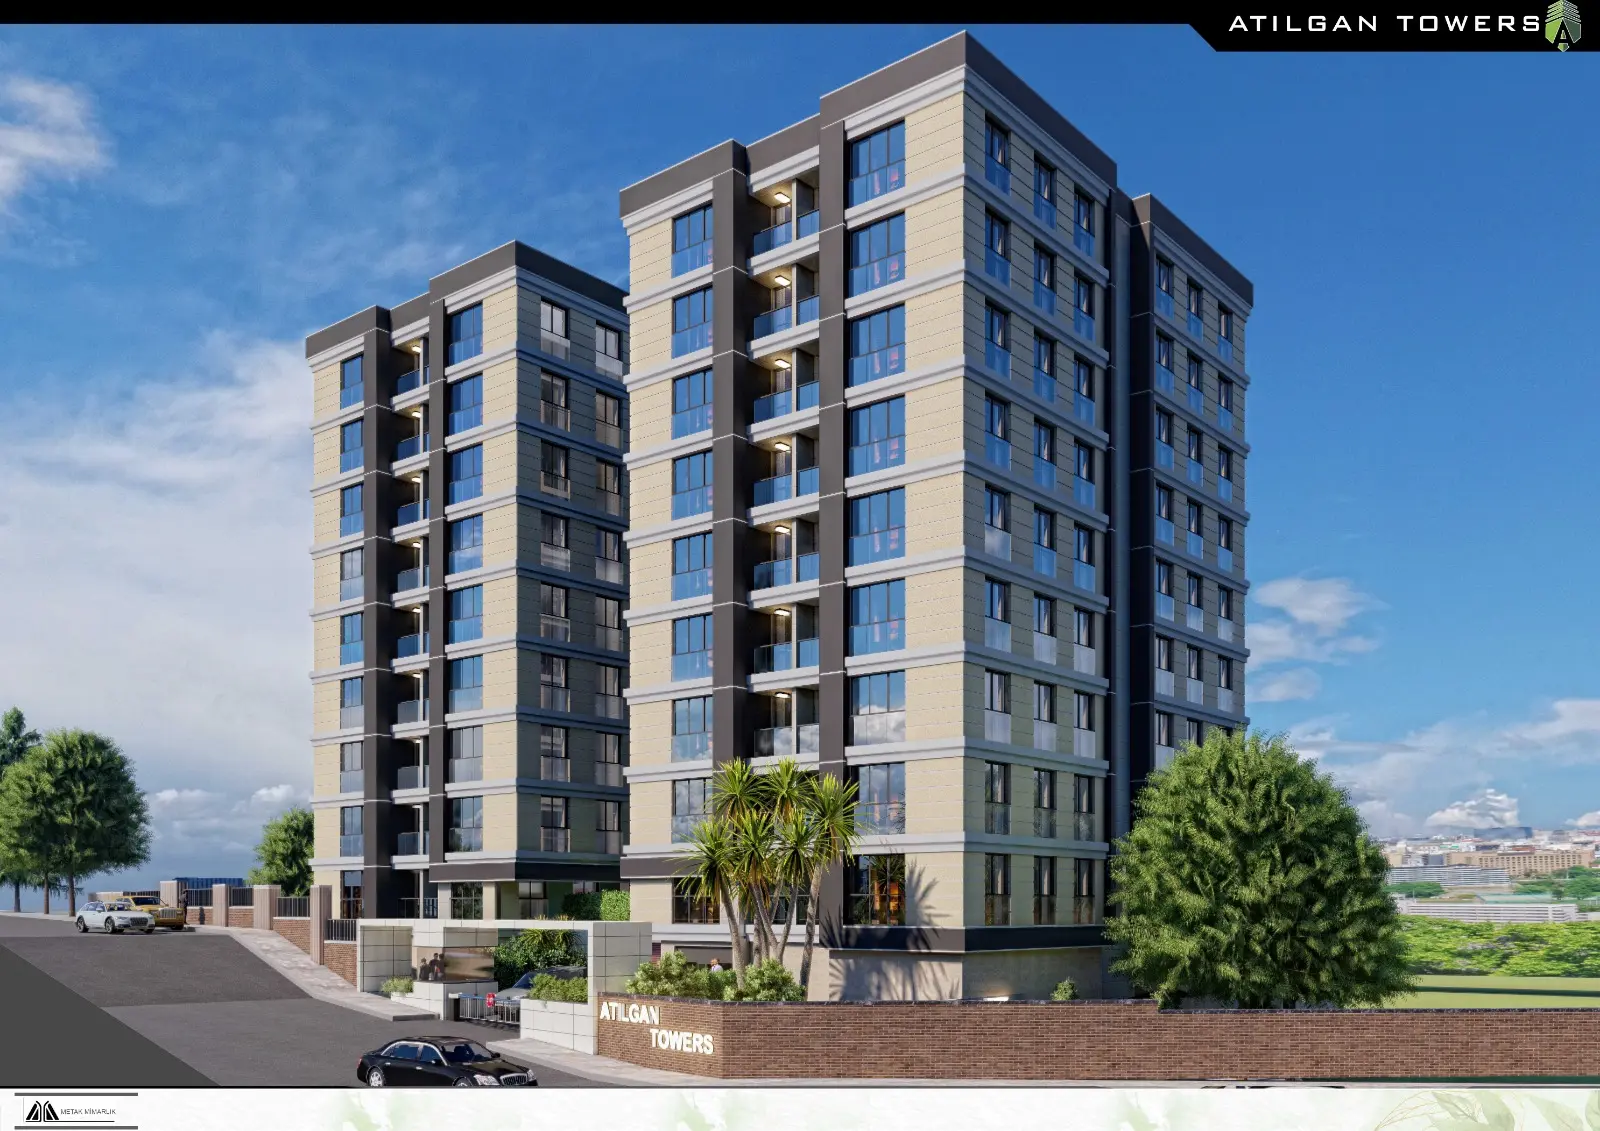
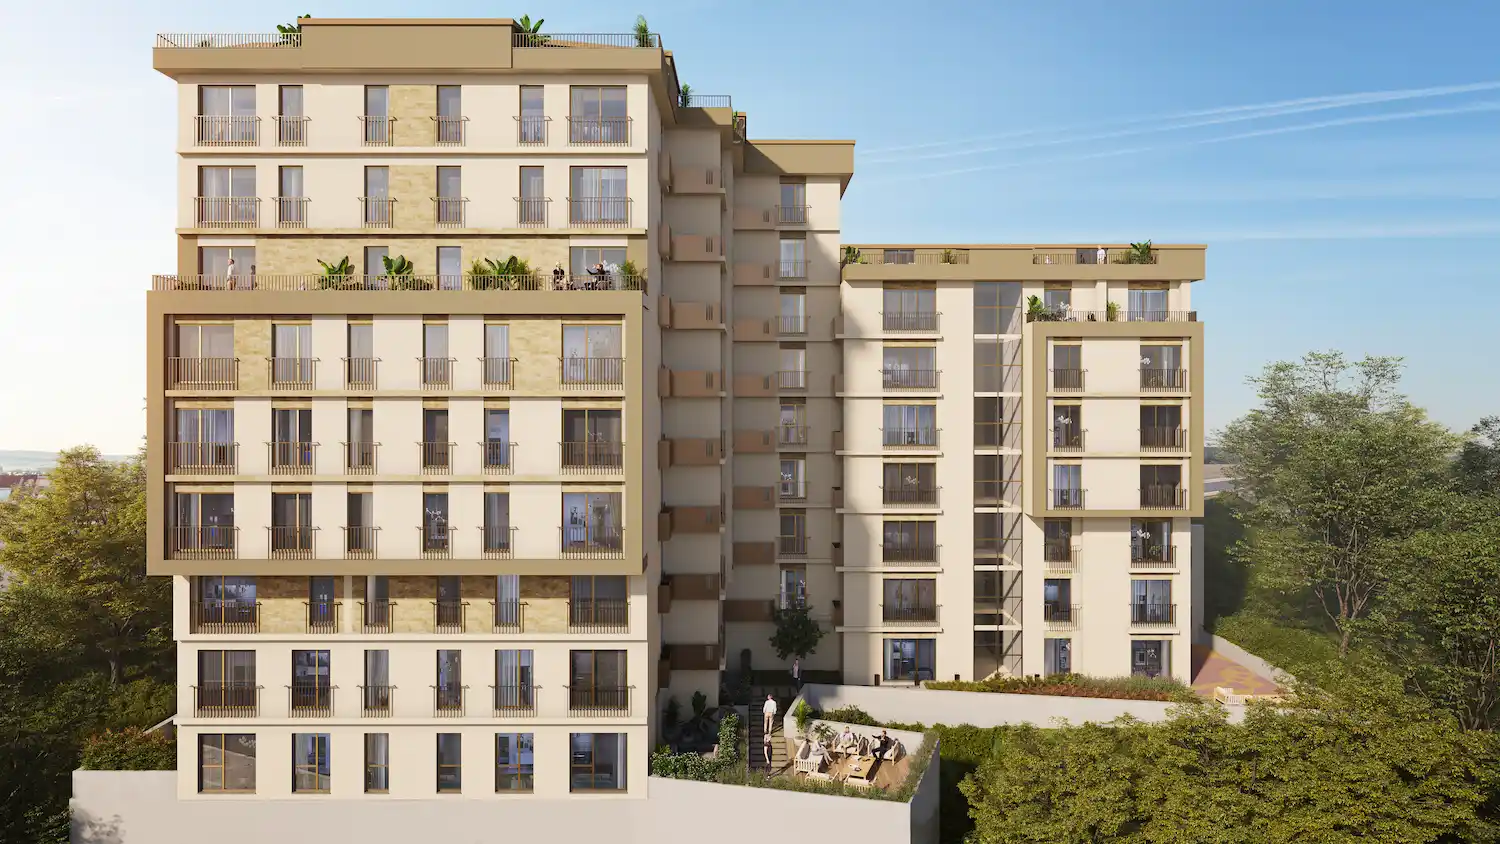
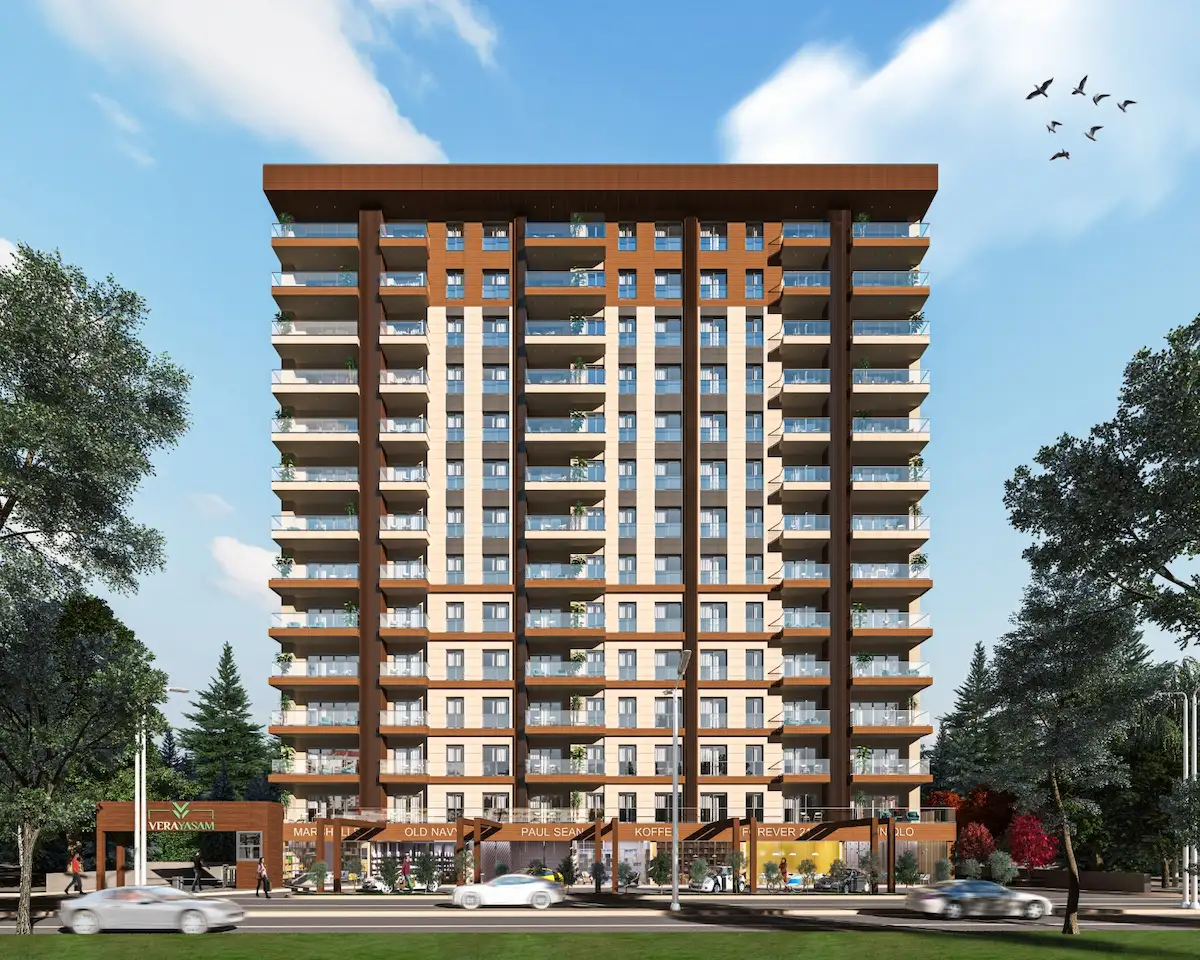
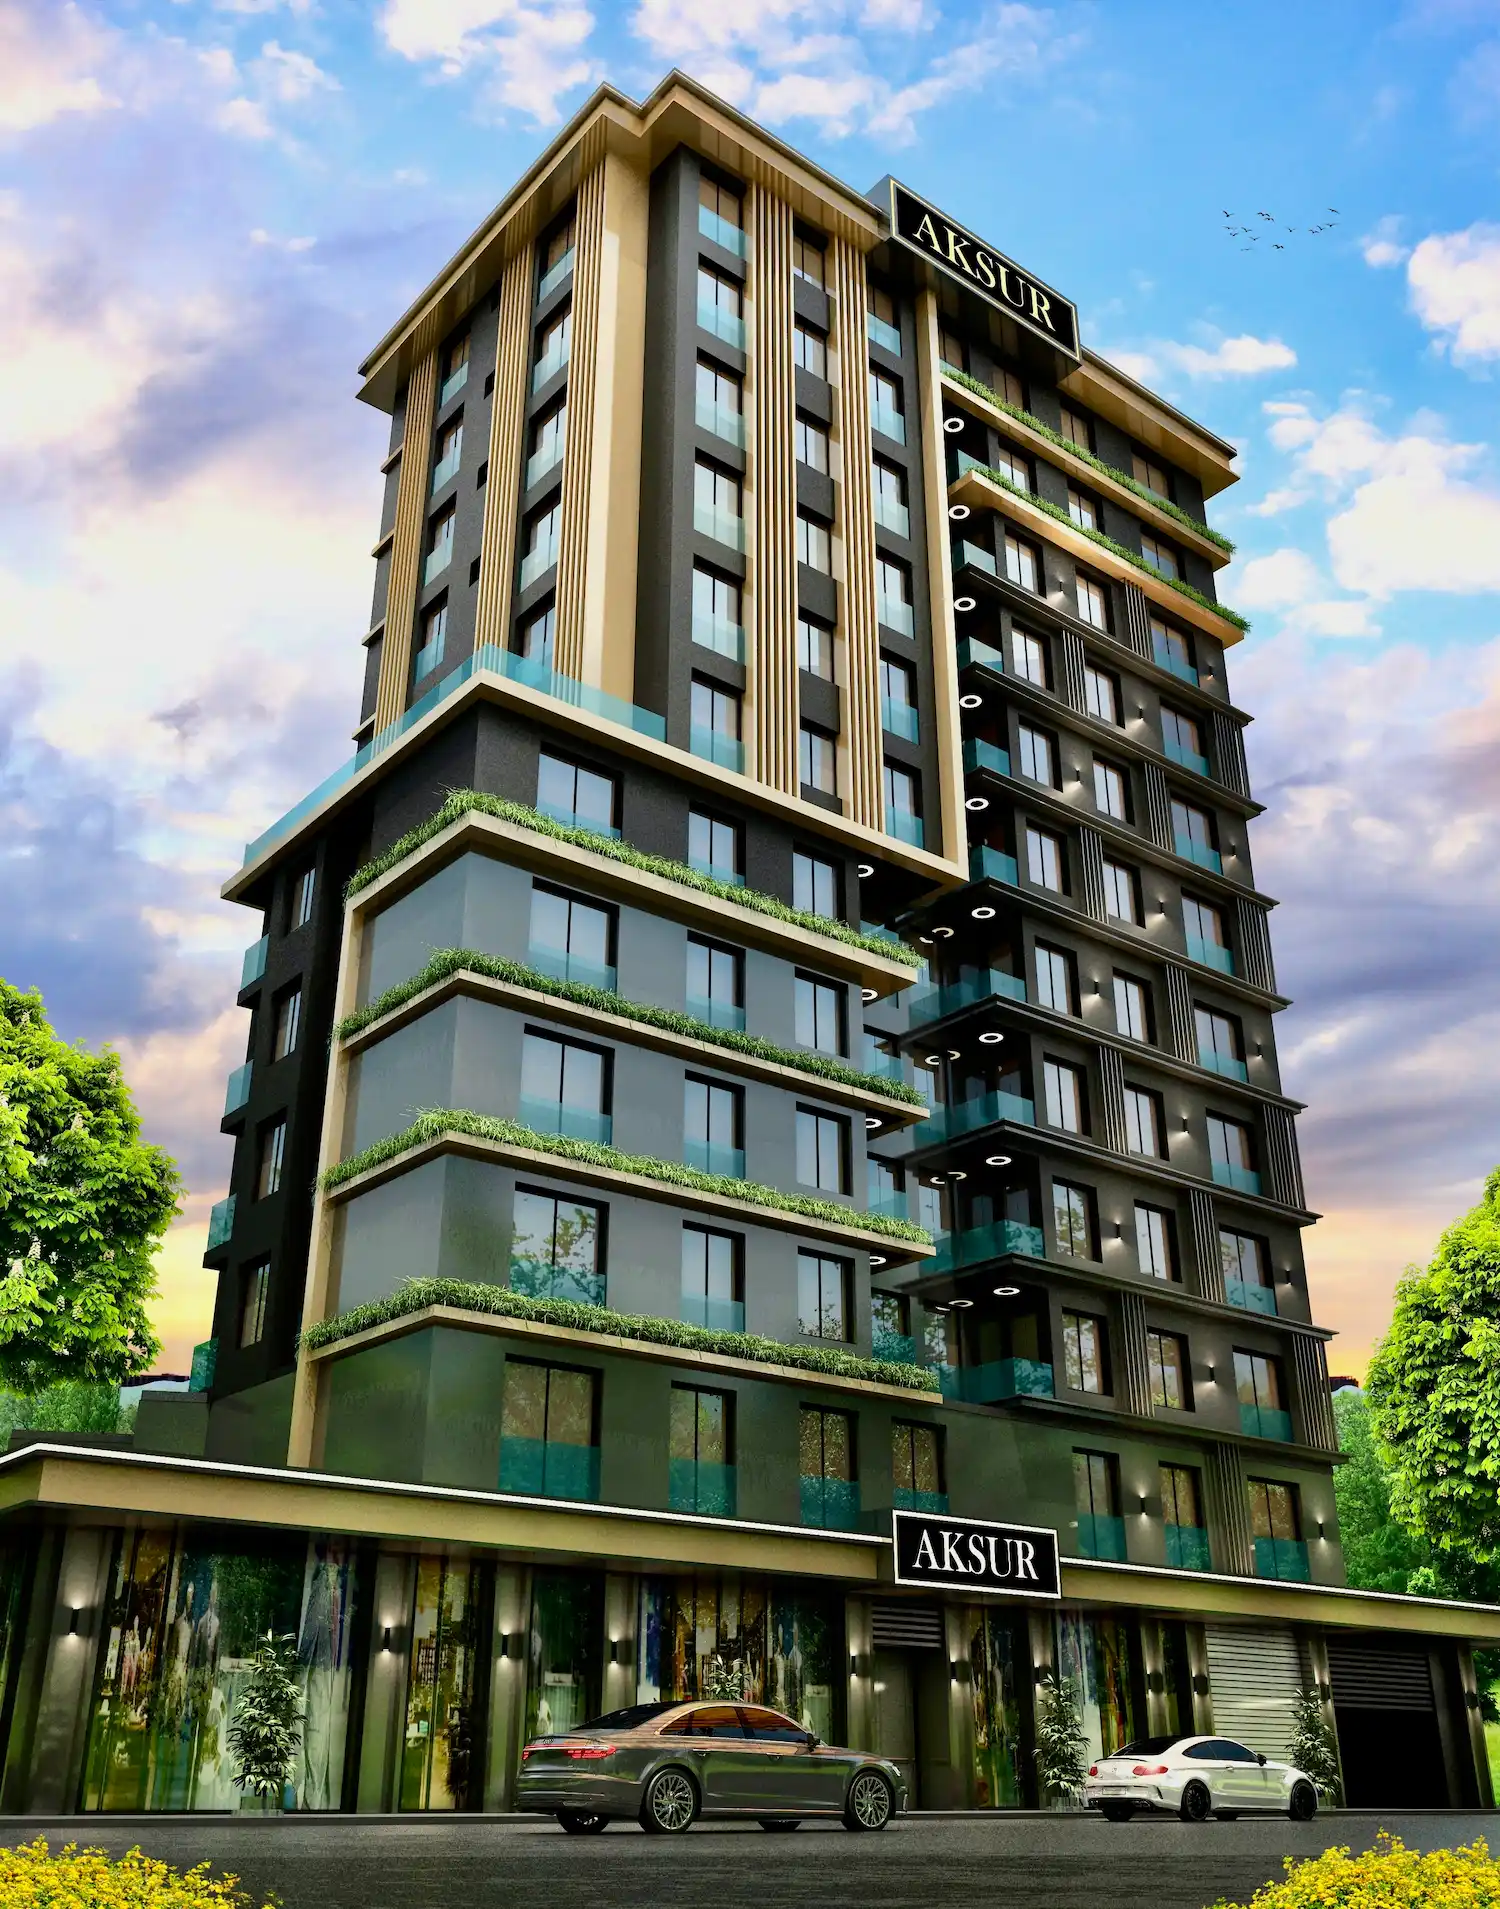
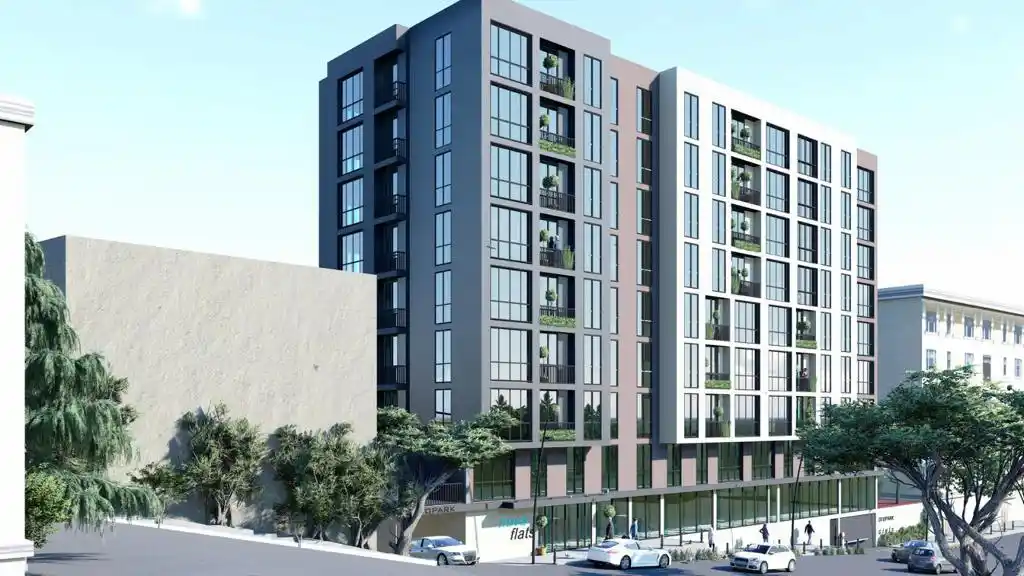
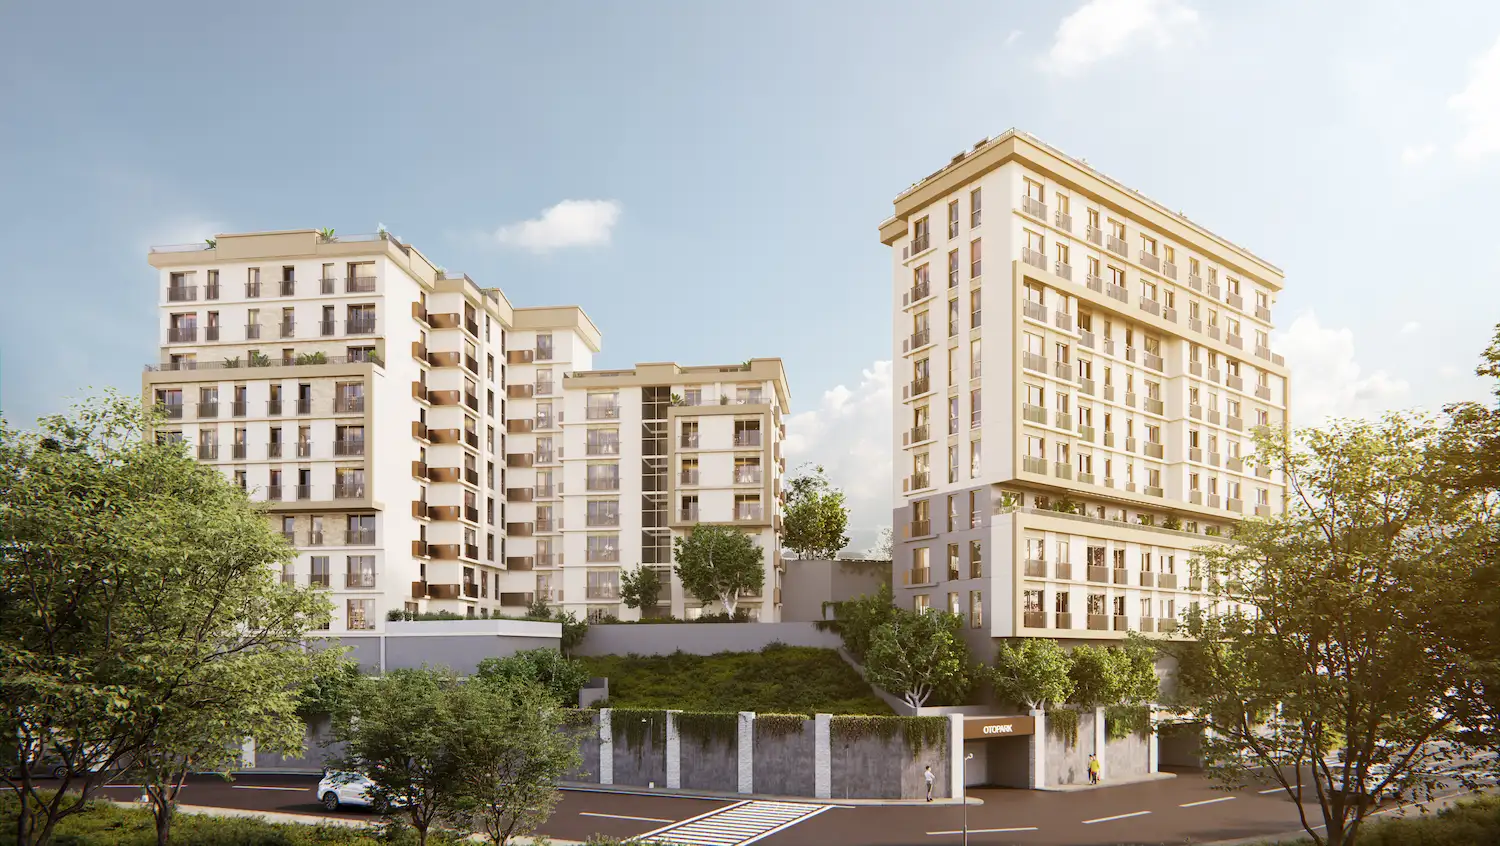
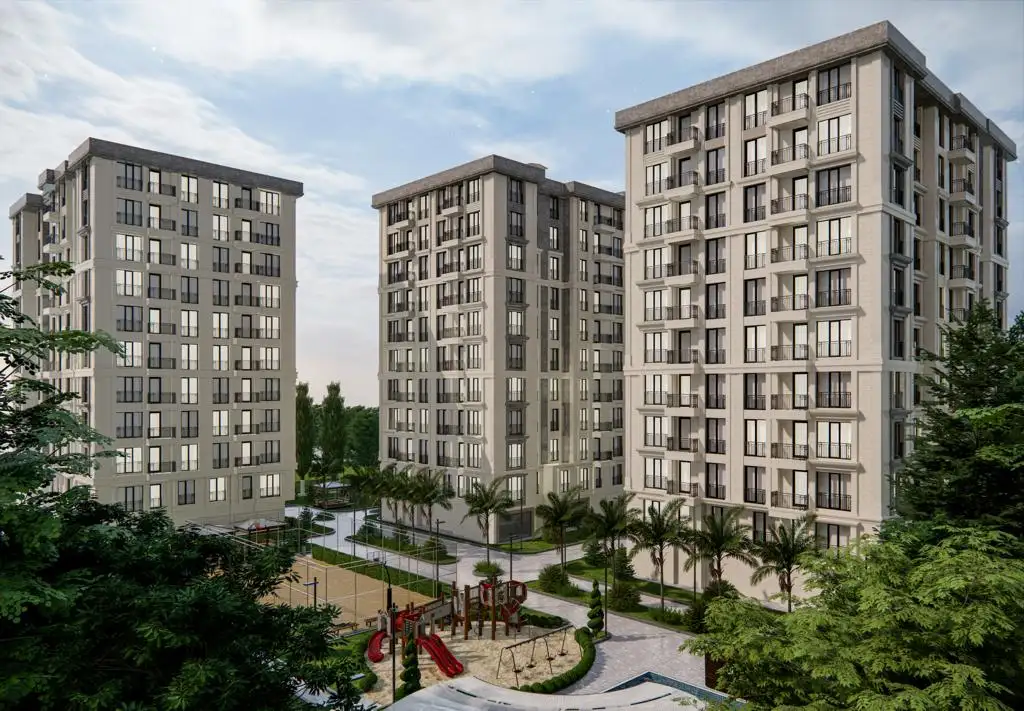
Projects Have same ROI in This Area


Have Question Or Suggestion ?
Please Share Your Thought, To Make It Real


