Return on Investment In Turkey
We are providing a financial metric for real estate investors as it helps them to determine the profitability of their real estate investment in Turkey
453€
Average Income
302€ - 604€
Min Income - Max Income
367,208€
Cash Price
| Year | Annual Increase | Monthly ROI | Annual ROI |
|---|---|---|---|
| 1 | 1.48 % | 453€ | 5,436€ |
| 2 | 1.85 % | 566€ | 6,795€ |
| 3 | 2.31 % | 708€ | 8,494€ |
| 4 | 2.89 % | 885€ | 10,617€ |
| 5 | 3.61 % | 1,106€ | 13,271€ |
| 6 | 4.52 % | 1,382€ | 16,589€ |
| 7 | 5.65 % | 1,728€ | 20,736€ |
| 8 | 7.06 % | 2,160€ | 25,920€ |
| 9 | 8.82 % | 2,700€ | 32,400€ |
| 10 | 11.03 % | 3,375€ | 40,501€ |
180,759€ 49%
Total ROI For 10 Years
604€
Max Income
367,208€
Cash Price
| Year | Annual Increase | Monthly ROI | Annual ROI |
|---|---|---|---|
| 1 | 1.97 % | 604€ | 7,248€ |
| 2 | 2.47 % | 755€ | 9,060€ |
| 3 | 3.08 % | 944€ | 11,325€ |
| 4 | 3.86 % | 1,180€ | 14,156€ |
| 5 | 4.82 % | 1,475€ | 17,695€ |
| 6 | 6.02 % | 1,843€ | 22,119€ |
| 7 | 7.53 % | 2,304€ | 27,648€ |
| 8 | 9.41 % | 2,880€ | 34,560€ |
| 9 | 11.76 % | 3,600€ | 43,201€ |
| 10 | 14.71 % | 4,500€ | 54,001€ |
241,012€ 65%
Total ROI For 10 Years
302€
Min Income
367,208€
Cash Price
| Year | Annual Increase | Monthly ROI | Annual ROI |
|---|---|---|---|
| 1 | 0.99 % | 302€ | 3,624€ |
| 2 | 1.23 % | 377€ | 4,530€ |
| 3 | 1.54 % | 472€ | 5,662€ |
| 4 | 1.93 % | 590€ | 7,078€ |
| 5 | 2.41 % | 737€ | 8,847€ |
| 6 | 3.01 % | 922€ | 11,059€ |
| 7 | 3.76 % | 1,152€ | 13,824€ |
| 8 | 4.71 % | 1,440€ | 17,280€ |
| 9 | 5.88 % | 1,800€ | 21,600€ |
| 10 | 7.35 % | 2,250€ | 27,000€ |
120,506€ 32%
Total ROI For 10 Years
District Classification
Rating
B-
Area map
Statistics
Population
711,894
Social Status
Married : 63%
Unmarried : 28%
area
167 Km2
Price Changes Over Last 5 Years
1 Year Change
17.58%
3 Year Change
281.3%
5 Year Change
294.6%
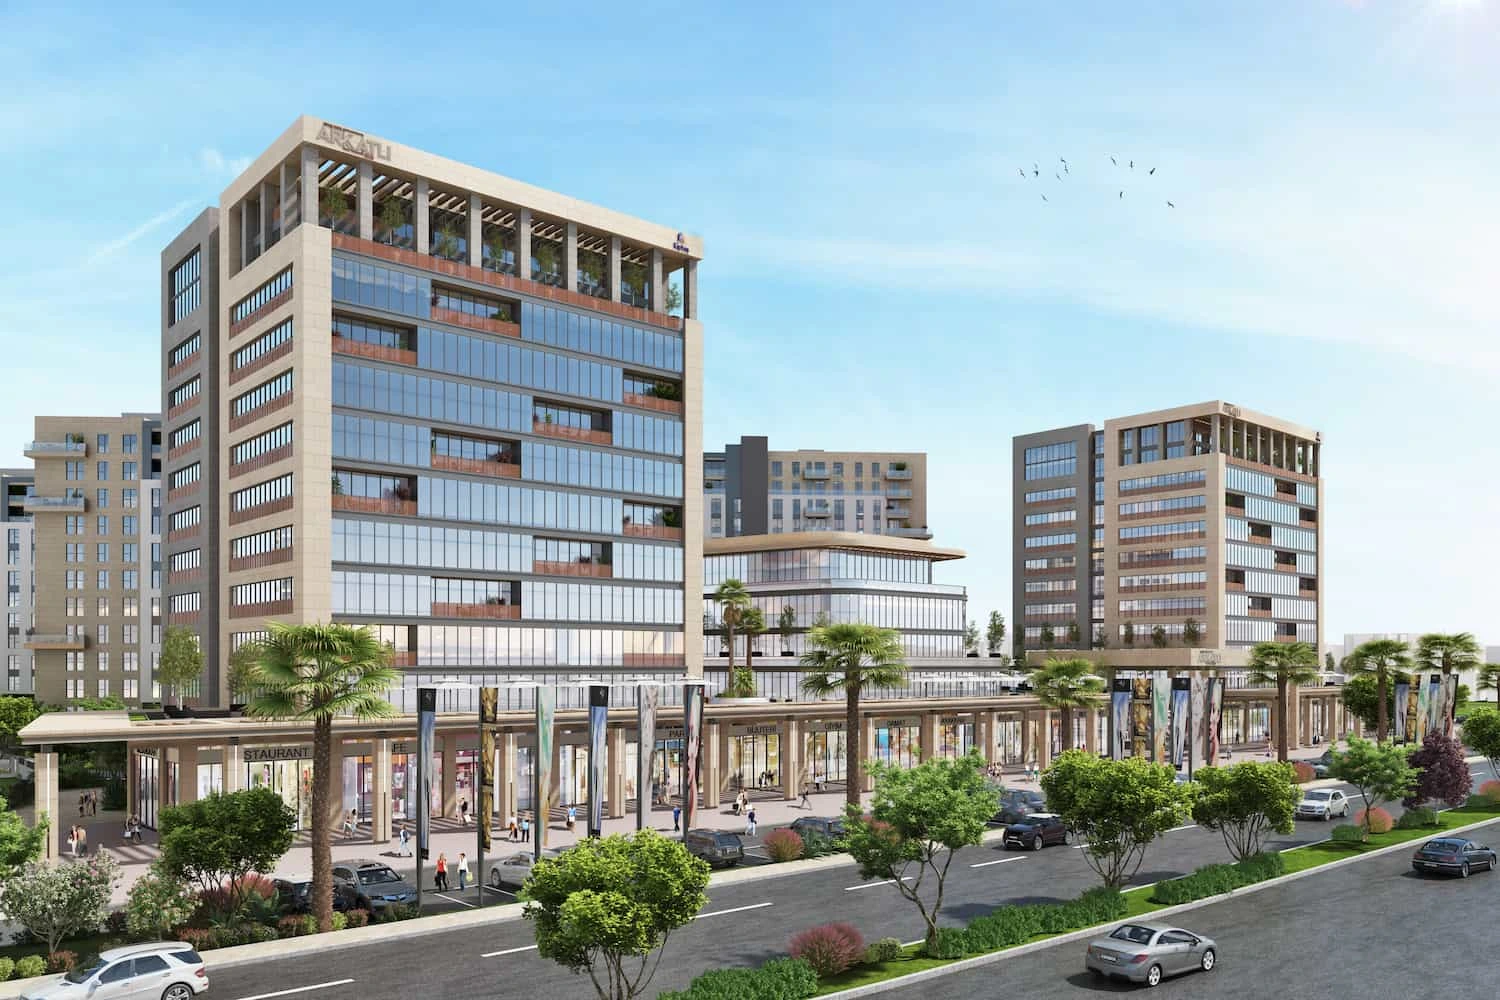
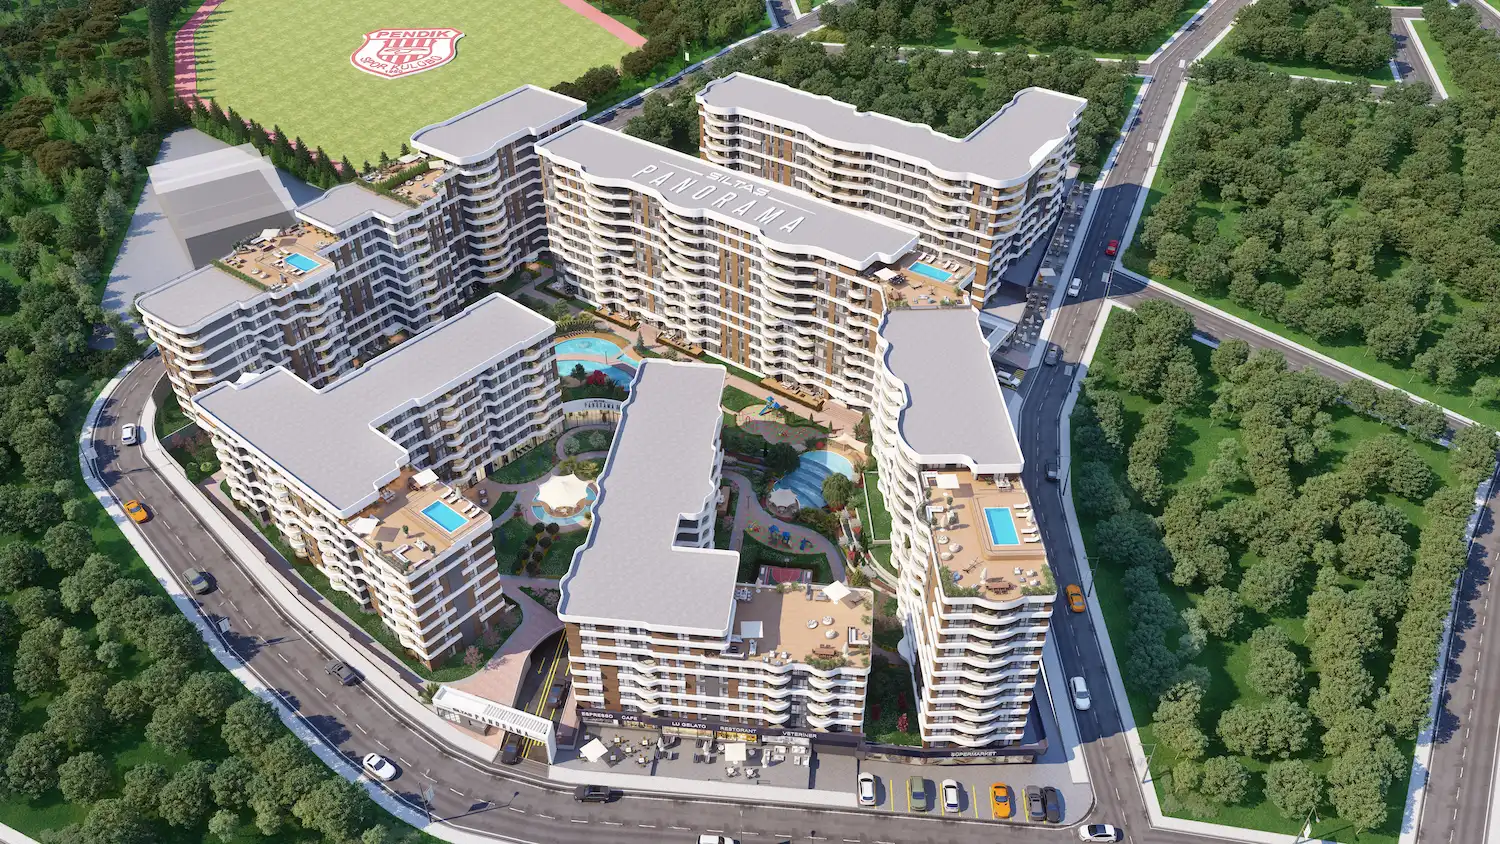
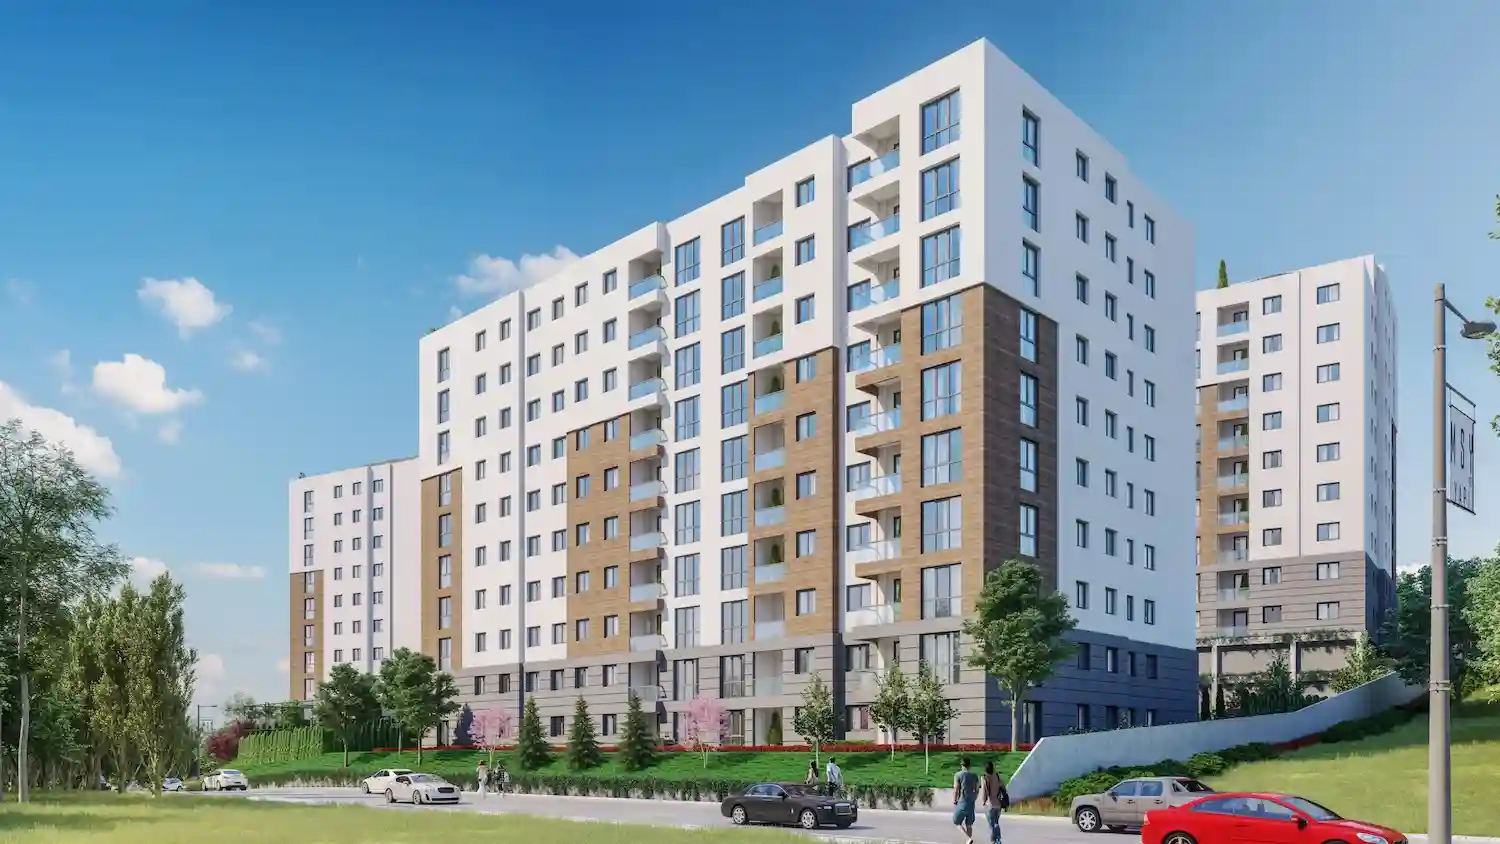
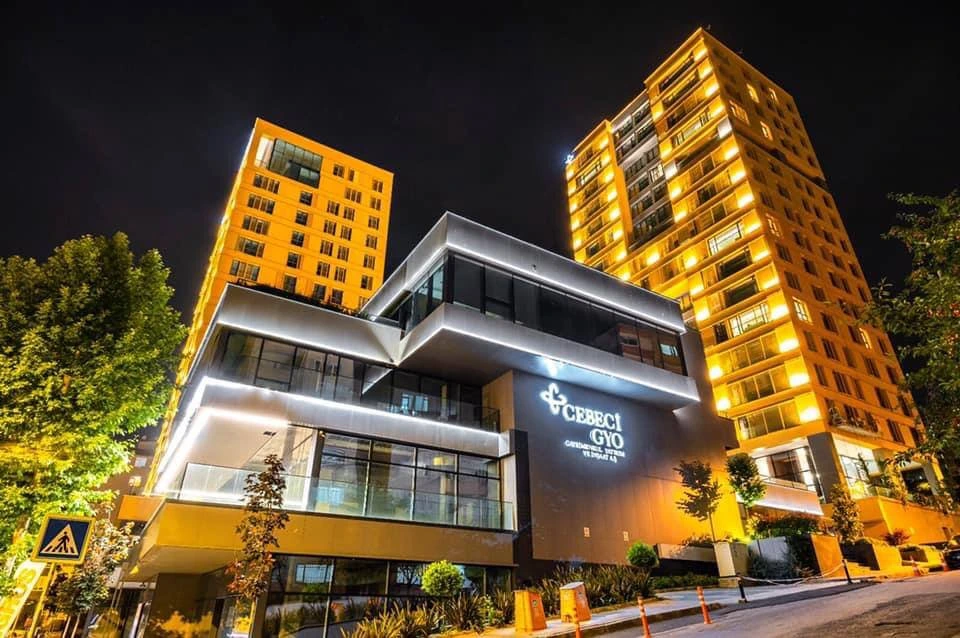
Projects Have same ROI in This Area
Have Question Or Suggestion ?
Please Share Your Thought, To Make It Real
.webp)
.webp)
