Return on Investment In Turkey
We are providing a financial metric for real estate investors as it helps them to determine the profitability of their real estate investment in Turkey
2,219د.إ
Average Income
1,593د.إ - 2,845د.إ
Min Income - Max Income
947,602د.إ
Cash Price
| Year | Annual Increase | Monthly ROI | Annual ROI |
|---|---|---|---|
| 1 | 2.81 % | 2,219د.إ | 26,627د.إ |
| 2 | 3.51 % | 2,774د.إ | 33,284د.إ |
| 3 | 4.39 % | 3,467د.إ | 41,605د.إ |
| 4 | 5.49 % | 4,334د.إ | 52,007د.إ |
| 5 | 6.86 % | 5,417د.إ | 65,008د.إ |
| 6 | 8.58 % | 6,772د.إ | 81,260د.إ |
| 7 | 10.72 % | 8,465د.إ | 101,576د.إ |
| 8 | 13.40 % | 10,581د.إ | 126,969د.إ |
| 9 | 16.75 % | 13,226د.إ | 158,712د.إ |
| 10 | 20.94 % | 16,532د.إ | 198,390د.إ |
885,439د.إ 93%
Total ROI For 10 Years
2,845د.إ
Max Income
947,602د.إ
Cash Price
| Year | Annual Increase | Monthly ROI | Annual ROI |
|---|---|---|---|
| 1 | 3.60 % | 2,845د.إ | 34,138د.إ |
| 2 | 4.50 % | 3,556د.إ | 42,672د.إ |
| 3 | 5.63 % | 4,445د.إ | 53,340د.إ |
| 4 | 7.04 % | 5,556د.إ | 66,675د.إ |
| 5 | 8.80 % | 6,945د.إ | 83,344د.إ |
| 6 | 10.99 % | 8,682د.إ | 104,180د.إ |
| 7 | 13.74 % | 10,852د.إ | 130,225د.إ |
| 8 | 17.18 % | 13,565د.إ | 162,781د.إ |
| 9 | 21.47 % | 16,956د.إ | 203,477د.إ |
| 10 | 26.84 % | 21,195د.إ | 254,346د.إ |
1,135,178د.إ 119%
Total ROI For 10 Years
1,593د.إ
Min Income
947,602د.إ
Cash Price
| Year | Annual Increase | Monthly ROI | Annual ROI |
|---|---|---|---|
| 1 | 2.02 % | 1,593د.إ | 19,117د.إ |
| 2 | 2.52 % | 1,991د.إ | 23,896د.إ |
| 3 | 3.15 % | 2,489د.إ | 29,871د.إ |
| 4 | 3.94 % | 3,112د.إ | 37,338د.إ |
| 5 | 4.93 % | 3,889د.إ | 46,673د.إ |
| 6 | 6.16 % | 4,862د.إ | 58,341د.إ |
| 7 | 7.70 % | 6,077د.إ | 72,926د.إ |
| 8 | 9.62 % | 7,596د.إ | 91,158د.إ |
| 9 | 12.02 % | 9,496د.إ | 113,947د.إ |
| 10 | 15.03 % | 11,869د.إ | 142,434د.إ |
635,700د.إ 67%
Total ROI For 10 Years
District Classification
Rating
C+
Area map
Statistics
Population
329,000
Social Status
Married : 64%
Unmarried : 29%
area
29 Km2
Price Changes Over Last 5 Years
1 Year Change
11.22%
3 Year Change
252700%
5 Year Change
241.8%
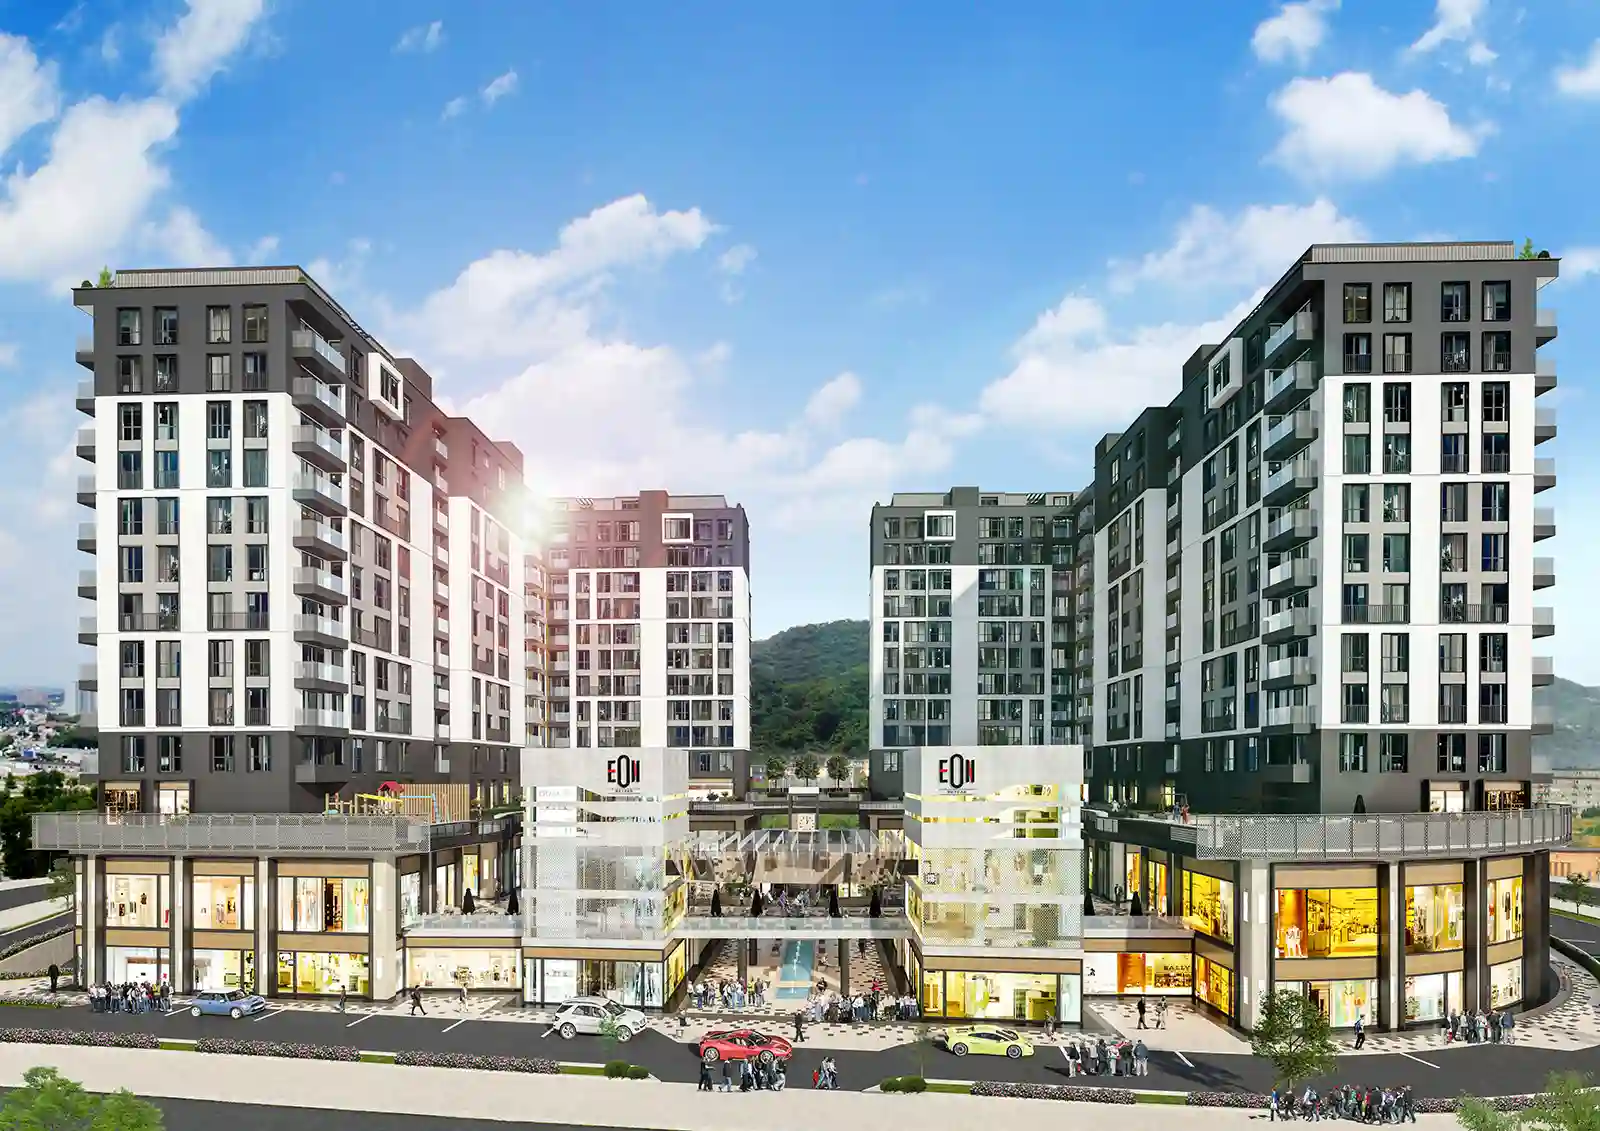
Projects Have same ROI in This Area
Have Question Or Suggestion ?
Please Share Your Thought, To Make It Real


