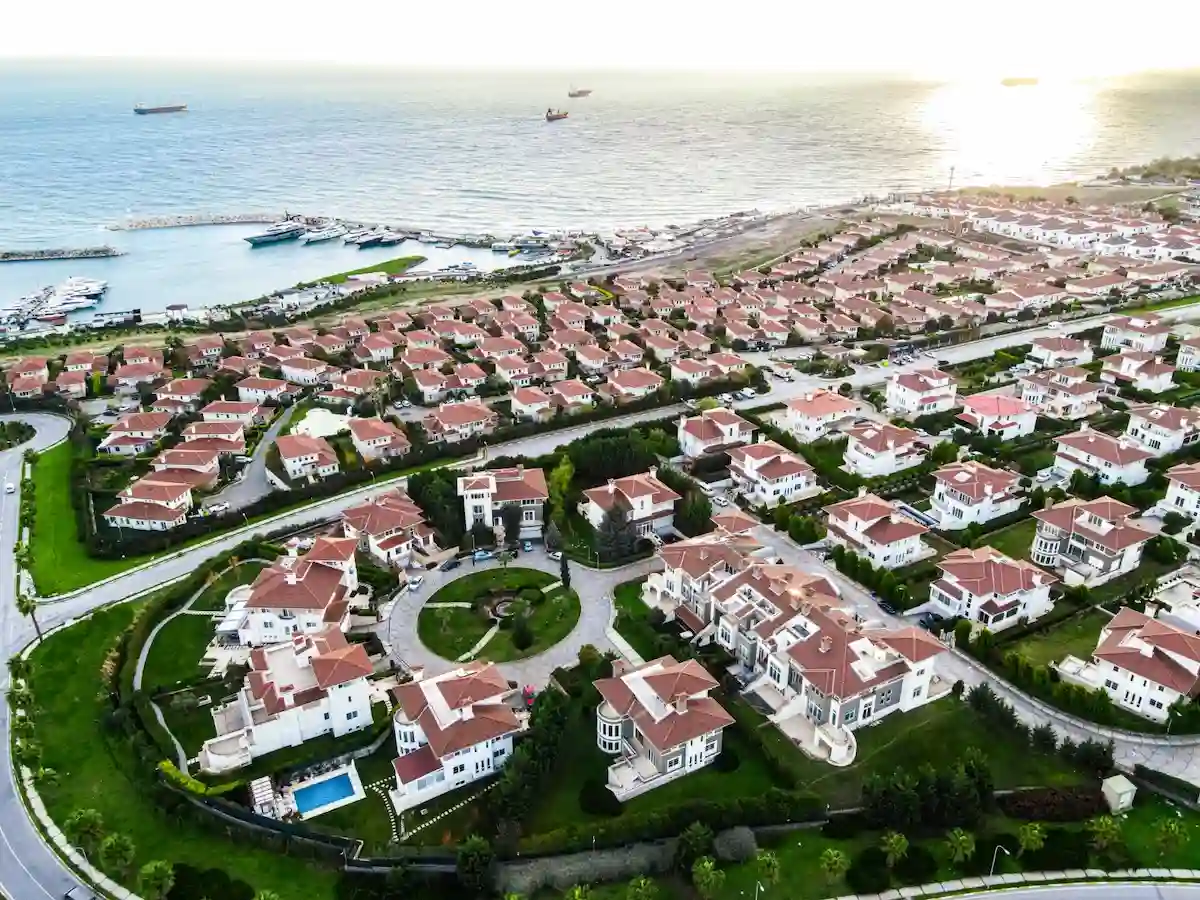
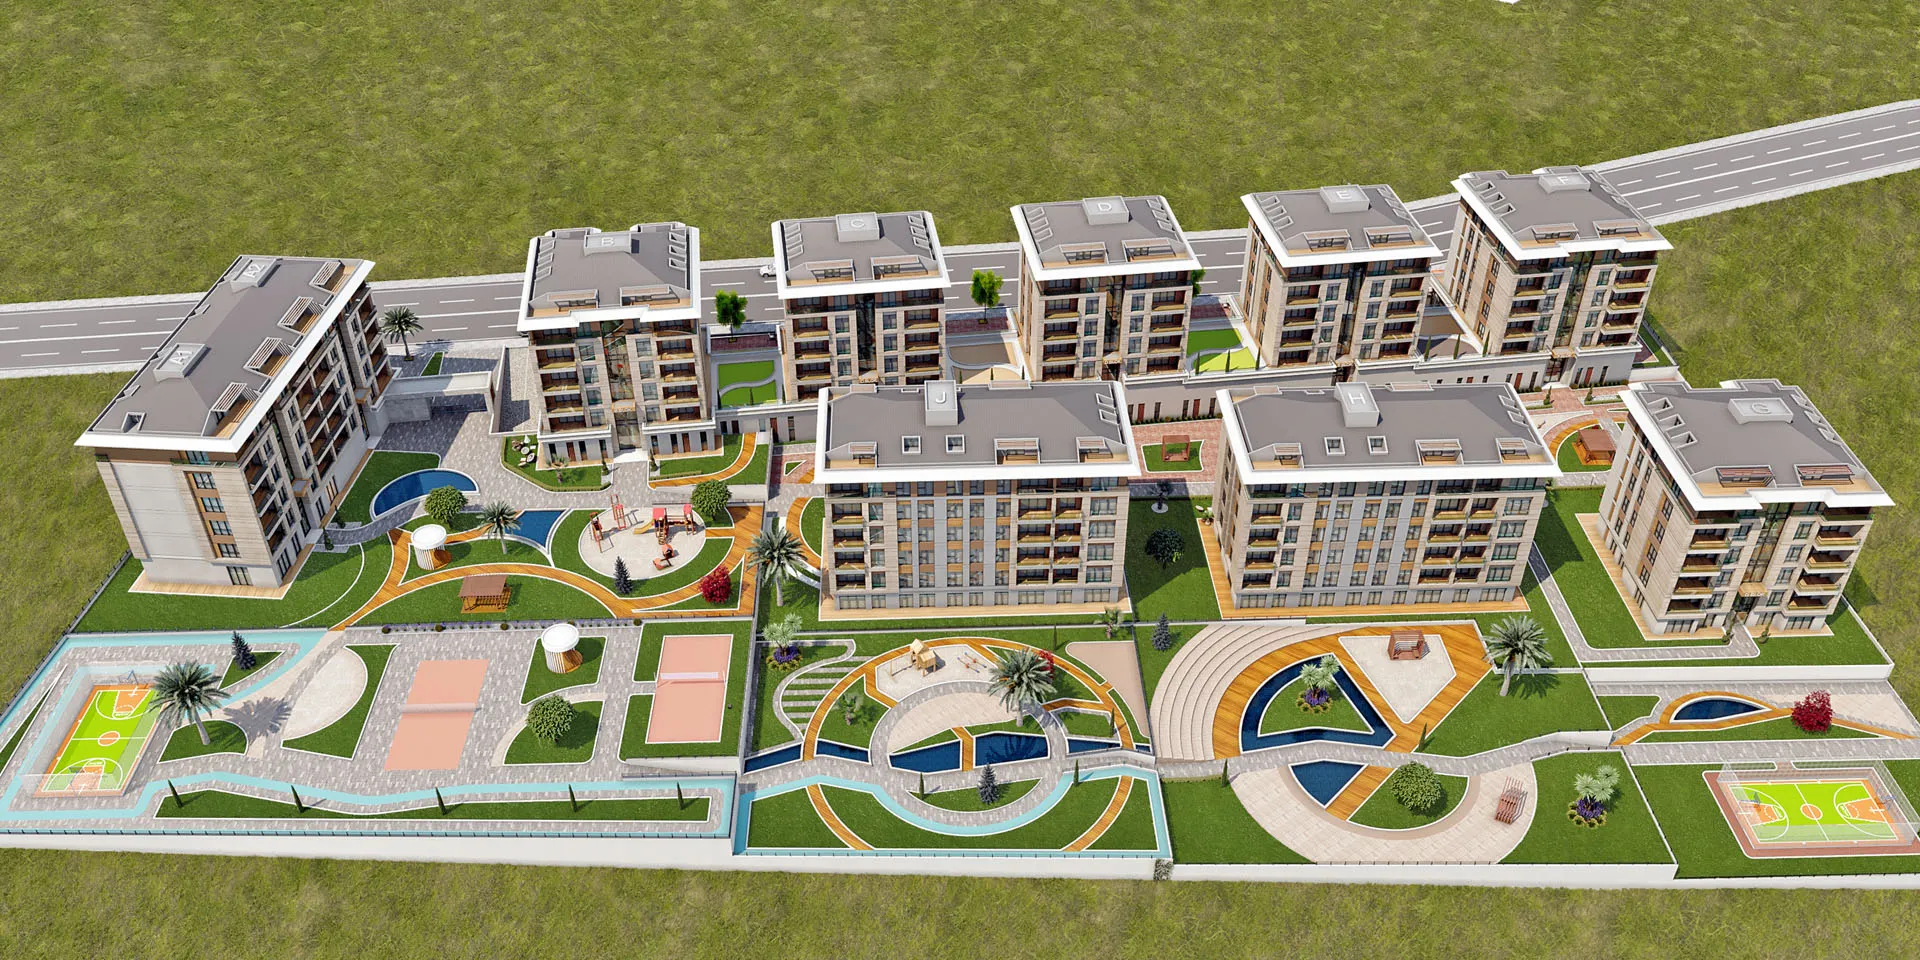
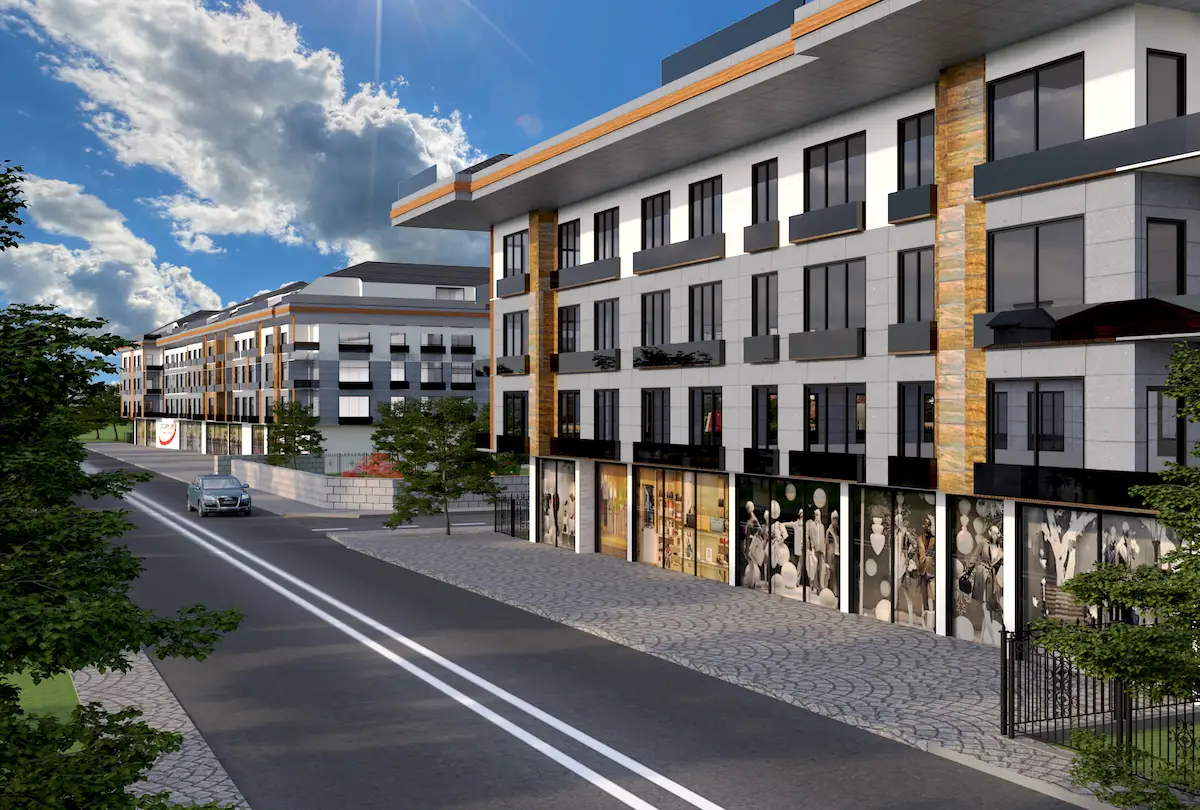
Return on Investment In Turkey
We are providing a financial metric for real estate investors as it helps them to determine the profitability of their real estate investment in Turkey
793€
Average Income
577€ - 1,009€
Min Income - Max Income
65,870€
Cash Price
| Year | Annual Increase | Monthly ROI | Annual ROI |
|---|---|---|---|
| 1 | 14.45 % | 793€ | 9,518€ |
| 2 | 18.06 % | 991€ | 11,897€ |
| 3 | 22.58 % | 1,239€ | 14,872€ |
| 4 | 28.22 % | 1,549€ | 18,590€ |
| 5 | 35.28 % | 1,936€ | 23,237€ |
| 6 | 44.10 % | 2,421€ | 29,046€ |
| 7 | 55.12 % | 3,026€ | 36,308€ |
| 8 | 68.90 % | 3,782€ | 45,385€ |
| 9 | 86.13 % | 4,728€ | 56,731€ |
| 10 | 107.66 % | 5,910€ | 70,914€ |
316,499€ 480%
Total ROI For 10 Years
1,009€
Max Income
65,870€
Cash Price
| Year | Annual Increase | Monthly ROI | Annual ROI |
|---|---|---|---|
| 1 | 18.39 % | 1,009€ | 12,114€ |
| 2 | 22.99 % | 1,262€ | 15,142€ |
| 3 | 28.74 % | 1,577€ | 18,928€ |
| 4 | 35.92 % | 1,972€ | 23,660€ |
| 5 | 44.90 % | 2,465€ | 29,575€ |
| 6 | 56.12 % | 3,081€ | 36,968€ |
| 7 | 70.15 % | 3,851€ | 46,210€ |
| 8 | 87.69 % | 4,814€ | 57,763€ |
| 9 | 109.62 % | 6,017€ | 72,204€ |
| 10 | 137.02 % | 7,521€ | 90,254€ |
402,817€ 611%
Total ROI For 10 Years
577€
Min Income
65,870€
Cash Price
| Year | Annual Increase | Monthly ROI | Annual ROI |
|---|---|---|---|
| 1 | 10.51 % | 577€ | 6,922€ |
| 2 | 13.14 % | 721€ | 8,653€ |
| 3 | 16.42 % | 901€ | 10,816€ |
| 4 | 20.53 % | 1,127€ | 13,520€ |
| 5 | 25.66 % | 1,408€ | 16,900€ |
| 6 | 32.07 % | 1,760€ | 21,125€ |
| 7 | 40.09 % | 2,200€ | 26,406€ |
| 8 | 50.11 % | 2,751€ | 33,007€ |
| 9 | 62.64 % | 3,438€ | 41,259€ |
| 10 | 78.30 % | 4,298€ | 51,574€ |
230,181€ 349%
Total ROI For 10 Years
District Classification
Rating
a
Area map
Statistics
Population
331,525
Social Status
Married : 51%
Unmarried : 49%
area
37 Km2
Price Changes Over Last 5 Years
1 Year Change
17.71%
3 Year Change
386.7%
5 Year Change
415.4%
Projects Have same ROI in This Area
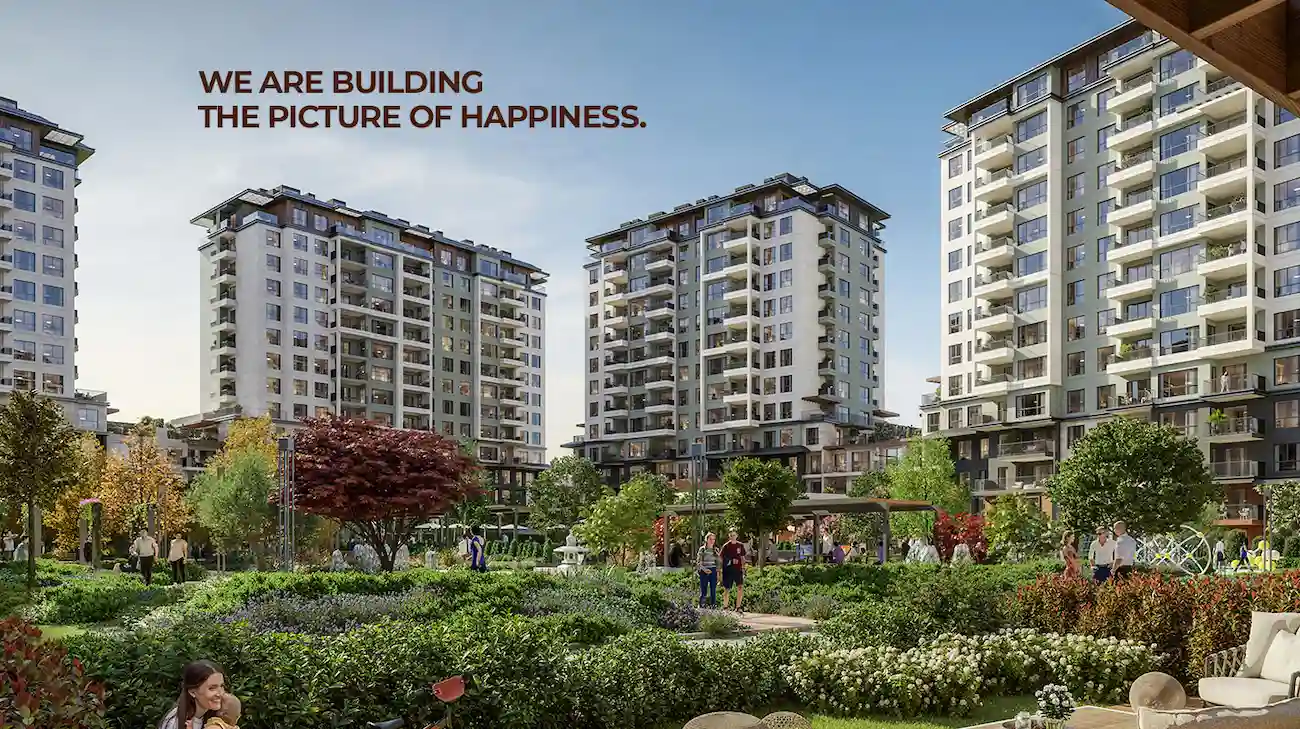
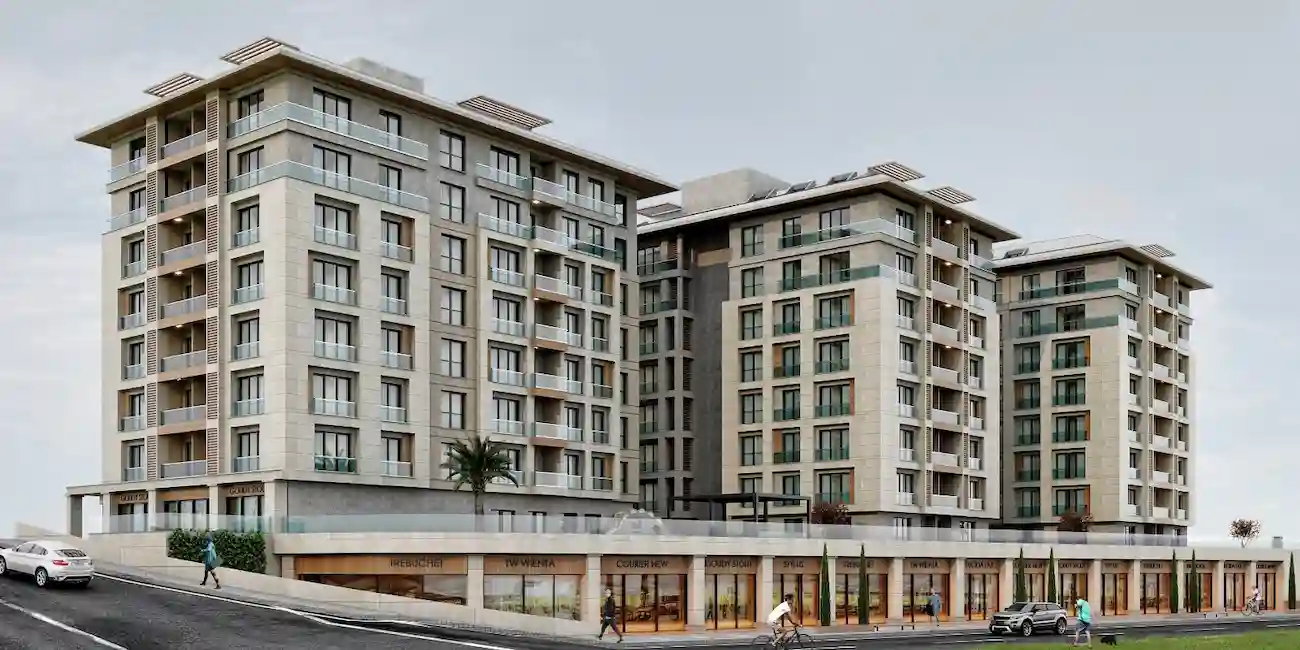
.webp)
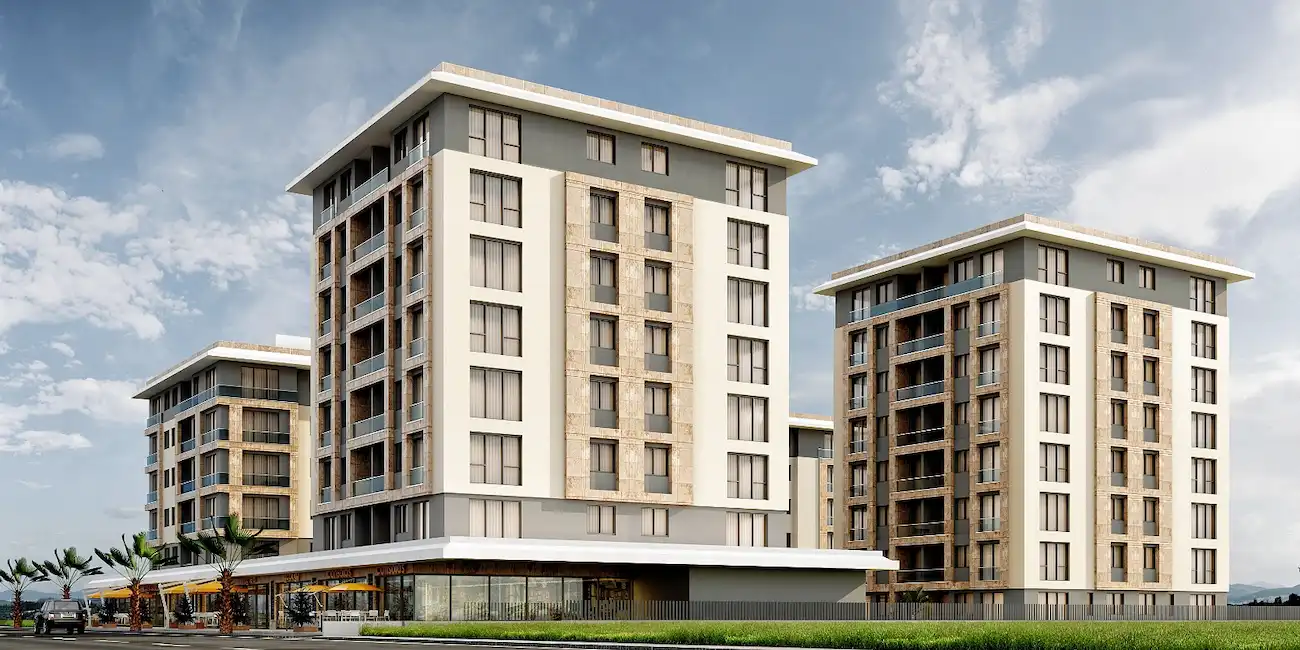
.webp)
Have Question Or Suggestion ?
Please Share Your Thought, To Make It Real


