Return on Investment In Turkey
We are providing a financial metric for real estate investors as it helps them to determine the profitability of their real estate investment in Turkey
372$
Average Income
217$ - 528$
Min Income - Max Income
89,766$
Cash Price
| Year | Annual Increase | Monthly ROI | Annual ROI |
|---|---|---|---|
| 1 | 4.98 % | 372$ | 4,469$ |
| 2 | 6.22 % | 466$ | 5,586$ |
| 3 | 7.78 % | 582$ | 6,983$ |
| 4 | 9.72 % | 727$ | 8,729$ |
| 5 | 12.15 % | 909$ | 10,911$ |
| 6 | 15.19 % | 1,137$ | 13,638$ |
| 7 | 18.99 % | 1,421$ | 17,048$ |
| 8 | 23.74 % | 1,776$ | 21,310$ |
| 9 | 29.67 % | 2,220$ | 26,637$ |
| 10 | 37.09 % | 2,775$ | 33,297$ |
148,608$ 165%
Total ROI For 10 Years
528$
Max Income
89,766$
Cash Price
| Year | Annual Increase | Monthly ROI | Annual ROI |
|---|---|---|---|
| 1 | 7.05 % | 528$ | 6,331$ |
| 2 | 8.82 % | 659$ | 7,914$ |
| 3 | 11.02 % | 824$ | 9,892$ |
| 4 | 13.78 % | 1,030$ | 12,365$ |
| 5 | 17.22 % | 1,288$ | 15,457$ |
| 6 | 21.52 % | 1,610$ | 19,321$ |
| 7 | 26.90 % | 2,013$ | 24,151$ |
| 8 | 33.63 % | 2,516$ | 30,189$ |
| 9 | 42.04 % | 3,145$ | 37,736$ |
| 10 | 52.55 % | 3,931$ | 47,171$ |
210,528$ 234%
Total ROI For 10 Years
217$
Min Income
89,766$
Cash Price
| Year | Annual Increase | Monthly ROI | Annual ROI |
|---|---|---|---|
| 1 | 2.90 % | 217$ | 2,607$ |
| 2 | 3.63 % | 272$ | 3,259$ |
| 3 | 4.54 % | 339$ | 4,073$ |
| 4 | 5.67 % | 424$ | 5,092$ |
| 5 | 7.09 % | 530$ | 6,365$ |
| 6 | 8.86 % | 663$ | 7,956$ |
| 7 | 11.08 % | 829$ | 9,945$ |
| 8 | 13.85 % | 1,036$ | 12,431$ |
| 9 | 17.31 % | 1,295$ | 15,539$ |
| 10 | 21.64 % | 1,619$ | 19,423$ |
86,688$ 96%
Total ROI For 10 Years
District Classification
Rating
b+
Area map
Statistics
Population
846,000
Social Status
Married : 53%
Unmarried : 47%
area
42 Km2
Price Changes Over Last 5 Years
1 Year Change
13.27%
3 Year Change
255.2%
5 Year Change
315.6%
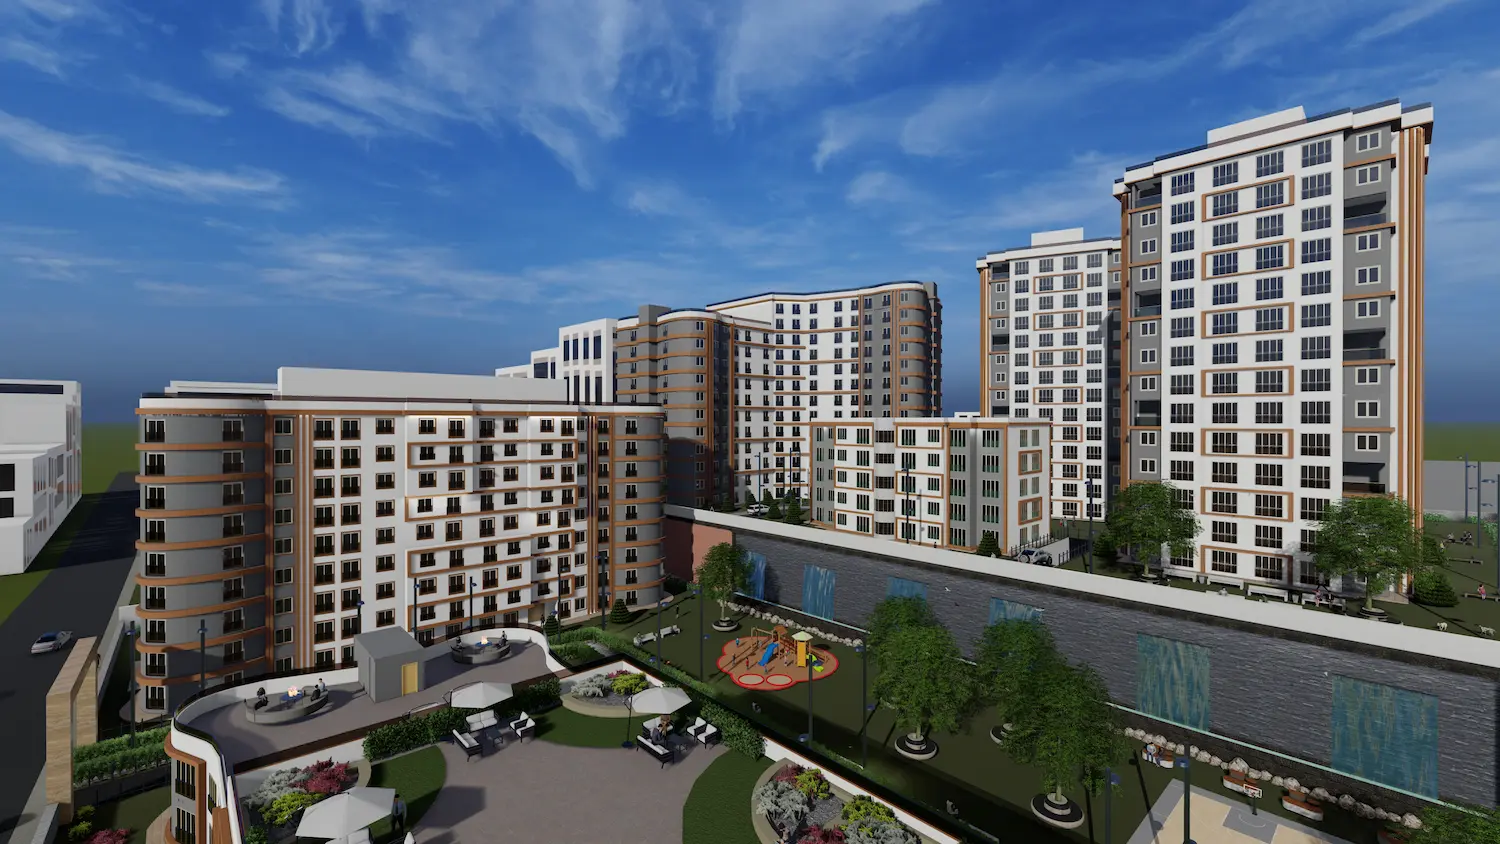
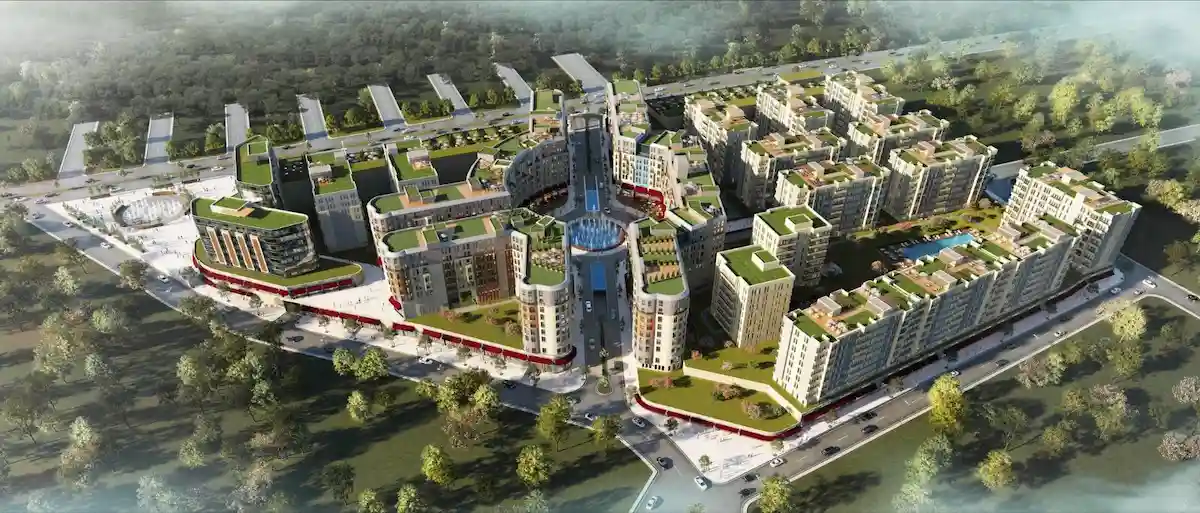
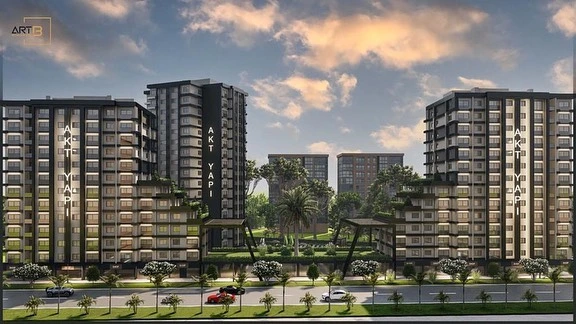
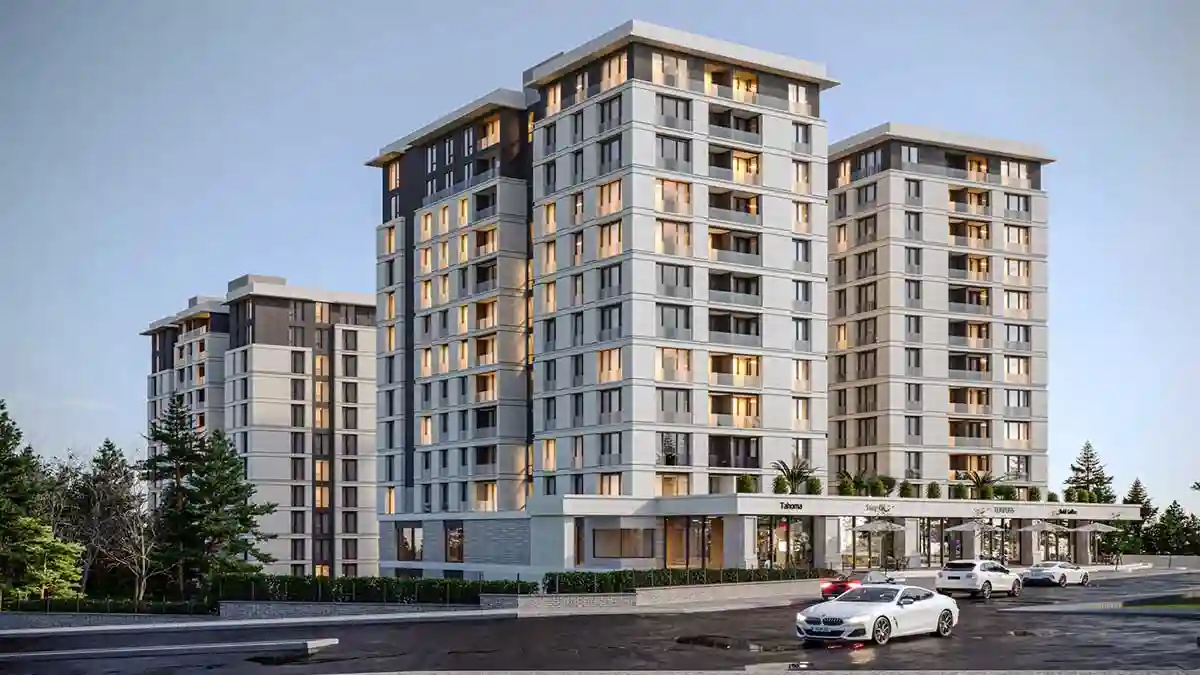
Projects Have same ROI in This Area

.webp)
.webp)
.webp)


Have Question Or Suggestion ?
Please Share Your Thought, To Make It Real


