Return on Investment In Turkey
We are providing a financial metric for real estate investors as it helps them to determine the profitability of their real estate investment in Turkey
1,769$
Average Income
1,384$ - 2,153$
Min Income - Max Income
808,000$
Cash Price
| Year | Annual Increase | Monthly ROI | Annual ROI |
|---|---|---|---|
| 1 | 2.63 % | 1,769$ | 21,226$ |
| 2 | 3.28 % | 2,211$ | 26,532$ |
| 3 | 4.10 % | 2,764$ | 33,165$ |
| 4 | 5.13 % | 3,455$ | 41,456$ |
| 5 | 6.41 % | 4,318$ | 51,820$ |
| 6 | 8.02 % | 5,398$ | 64,775$ |
| 7 | 10.02 % | 6,747$ | 80,969$ |
| 8 | 12.53 % | 8,434$ | 101,211$ |
| 9 | 15.66 % | 10,543$ | 126,514$ |
| 10 | 19.57 % | 13,179$ | 158,142$ |
705,810$ 87%
Total ROI For 10 Years
2,153$
Max Income
808,000$
Cash Price
| Year | Annual Increase | Monthly ROI | Annual ROI |
|---|---|---|---|
| 1 | 3.20 % | 2,153$ | 25,840$ |
| 2 | 4.00 % | 2,692$ | 32,300$ |
| 3 | 5.00 % | 3,365$ | 40,375$ |
| 4 | 6.25 % | 4,206$ | 50,468$ |
| 5 | 7.81 % | 5,257$ | 63,085$ |
| 6 | 9.76 % | 6,571$ | 78,857$ |
| 7 | 12.20 % | 8,214$ | 98,571$ |
| 8 | 15.25 % | 10,268$ | 123,214$ |
| 9 | 19.06 % | 12,835$ | 154,017$ |
| 10 | 23.83 % | 16,043$ | 192,521$ |
859,247$ 106%
Total ROI For 10 Years
1,384$
Min Income
808,000$
Cash Price
| Year | Annual Increase | Monthly ROI | Annual ROI |
|---|---|---|---|
| 1 | 2.06 % | 1,384$ | 16,611$ |
| 2 | 2.57 % | 1,730$ | 20,764$ |
| 3 | 3.21 % | 2,163$ | 25,955$ |
| 4 | 4.02 % | 2,704$ | 32,444$ |
| 5 | 5.02 % | 3,380$ | 40,555$ |
| 6 | 6.27 % | 4,224$ | 50,694$ |
| 7 | 7.84 % | 5,281$ | 63,367$ |
| 8 | 9.80 % | 6,601$ | 79,209$ |
| 9 | 12.25 % | 8,251$ | 99,011$ |
| 10 | 15.32 % | 10,314$ | 123,764$ |
552,373$ 68%
Total ROI For 10 Years
District Classification
Rating
b+
Area map
Statistics
Population
381,110
Social Status
Married : 67%
Unmarried : 26%
area
230 Km2
Price Changes Over Last 5 Years
1 Year Change
17.79%
3 Year Change
202%
5 Year Change
253%
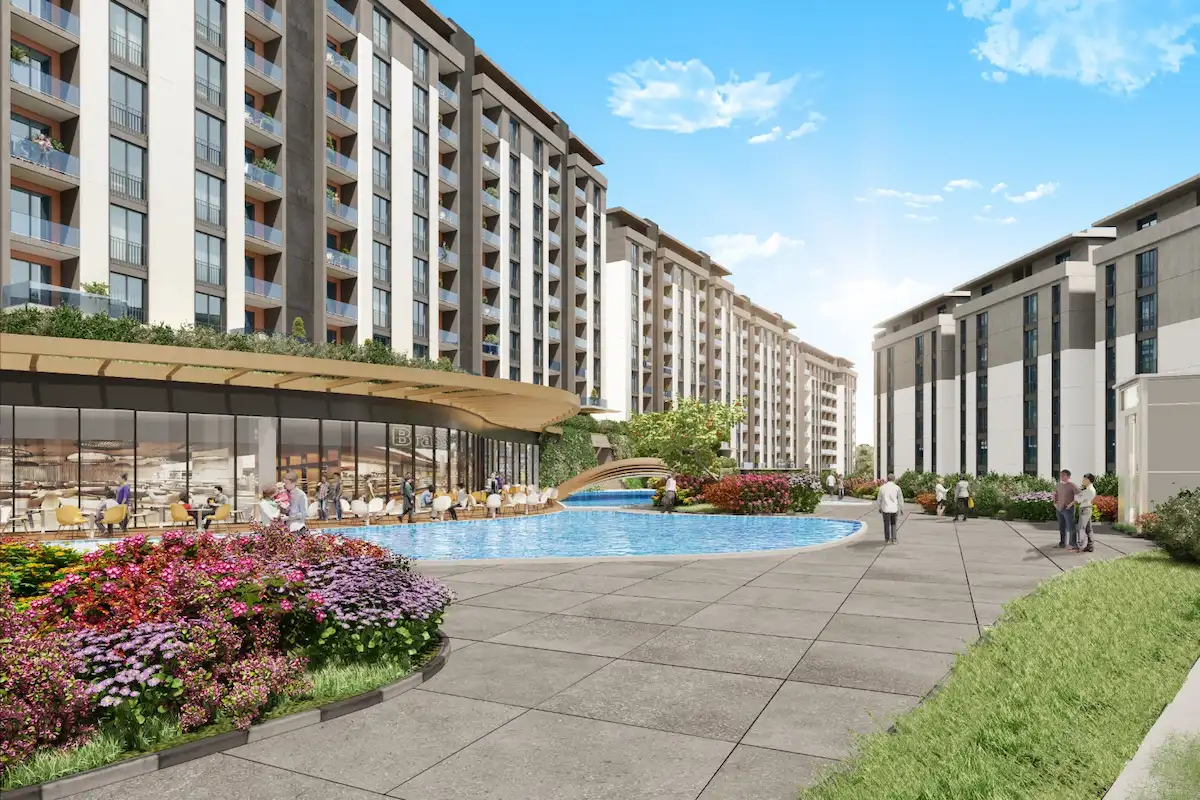
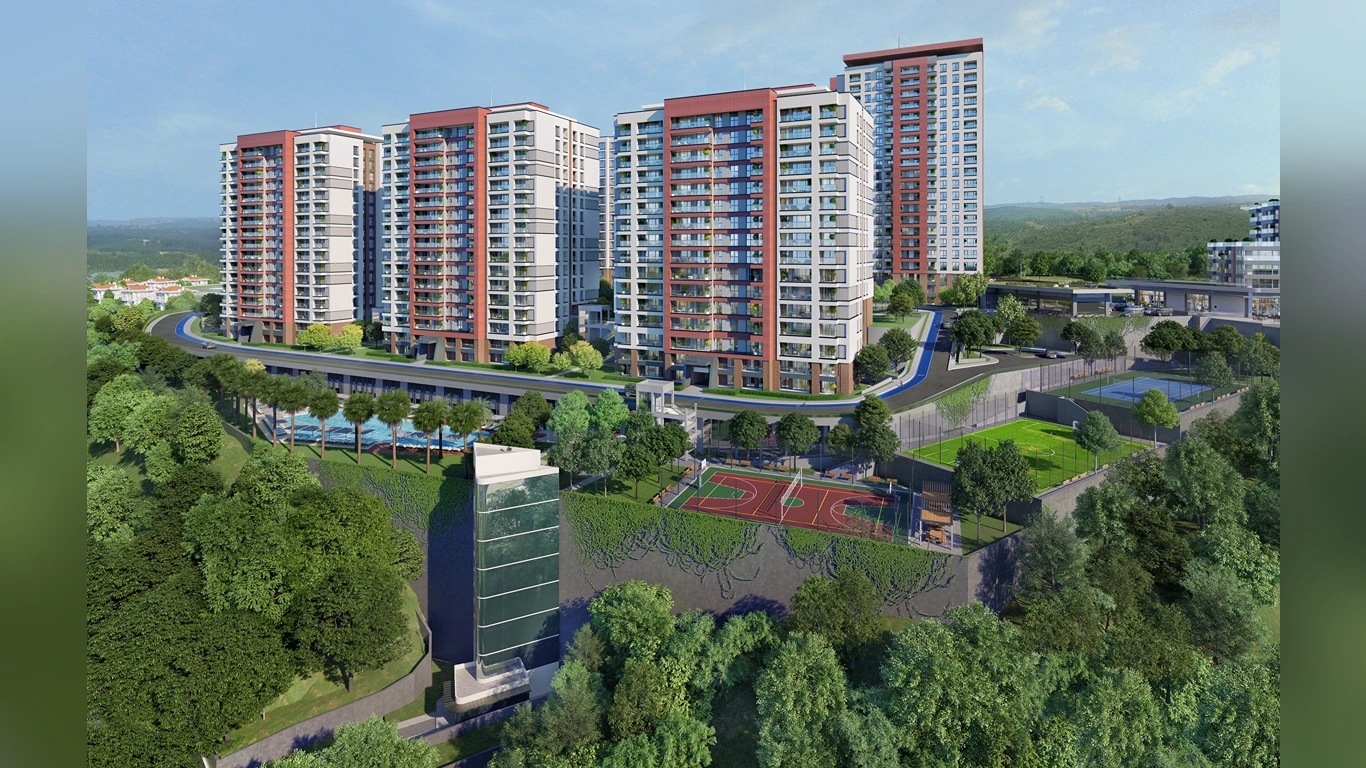
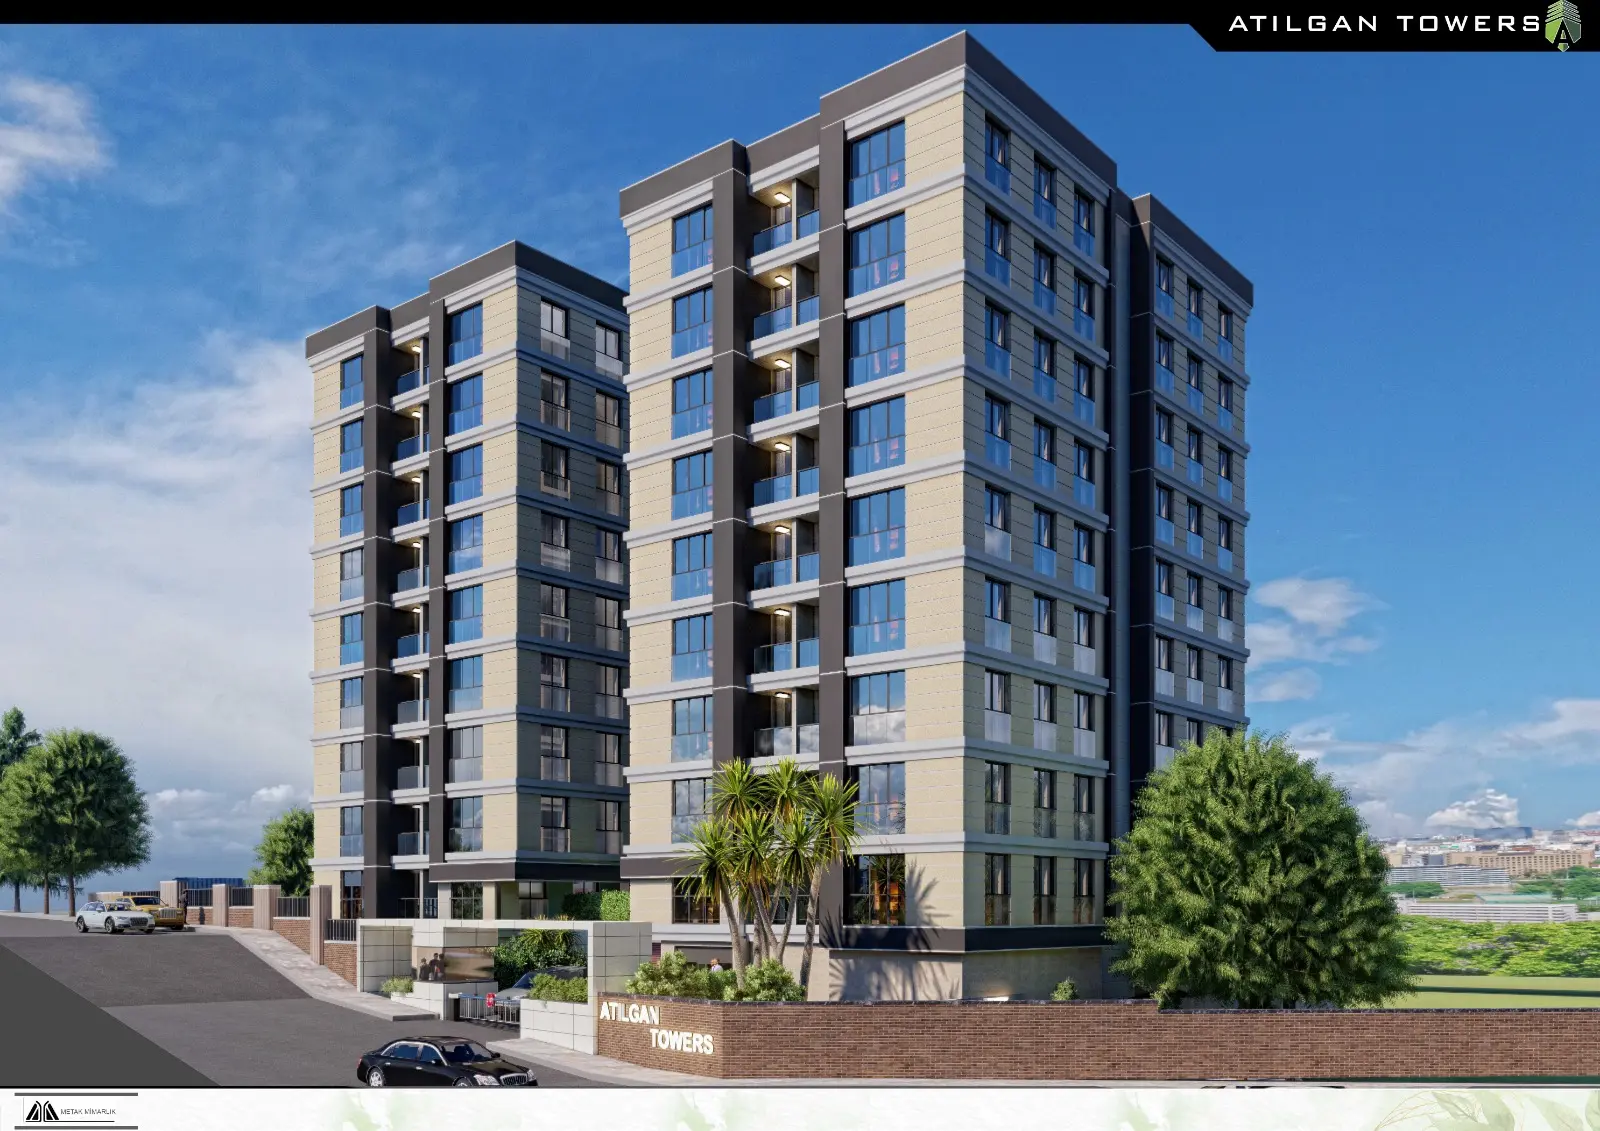
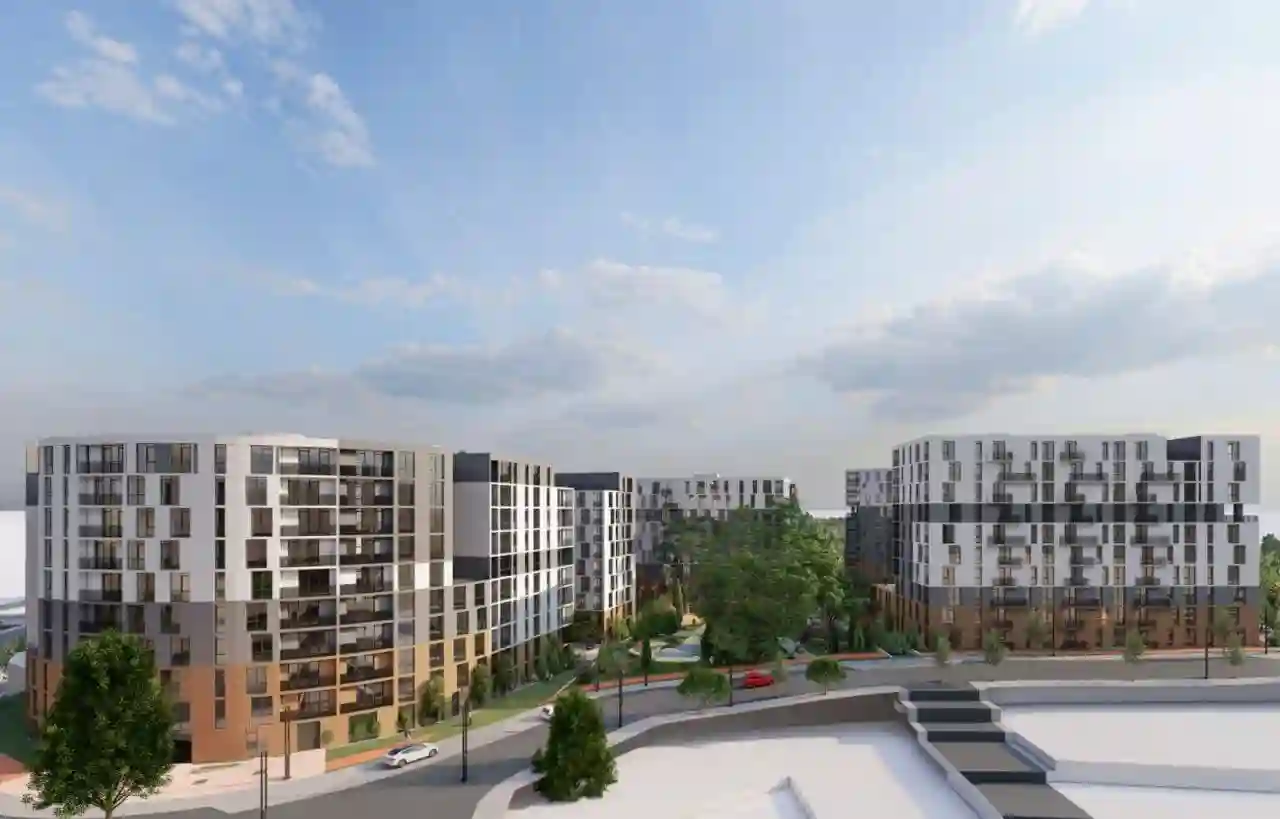
Projects Have same ROI in This Area


Have Question Or Suggestion ?
Please Share Your Thought, To Make It Real


