Return on Investment In Turkey
We are providing a financial metric for real estate investors as it helps them to determine the profitability of their real estate investment in Turkey
4,025$
Average Income
2,632$ - 5,418$
Min Income - Max Income
1,334,201$
Cash Price
| Year | Annual Increase | Monthly ROI | Annual ROI |
|---|---|---|---|
| 1 | 3.62 % | 4,025$ | 48,301$ |
| 2 | 4.53 % | 5,031$ | 60,376$ |
| 3 | 5.66 % | 6,289$ | 75,470$ |
| 4 | 7.07 % | 7,861$ | 94,338$ |
| 5 | 8.84 % | 9,827$ | 117,922$ |
| 6 | 11.05 % | 12,284$ | 147,403$ |
| 7 | 13.81 % | 15,354$ | 184,254$ |
| 8 | 17.26 % | 19,193$ | 230,317$ |
| 9 | 21.58 % | 23,991$ | 287,896$ |
| 10 | 26.97 % | 29,989$ | 359,870$ |
1,606,147$ 120%
Total ROI For 10 Years
5,418$
Max Income
1,334,201$
Cash Price
| Year | Annual Increase | Monthly ROI | Annual ROI |
|---|---|---|---|
| 1 | 4.87 % | 5,418$ | 65,021$ |
| 2 | 6.09 % | 6,773$ | 81,276$ |
| 3 | 7.61 % | 8,466$ | 101,595$ |
| 4 | 9.52 % | 10,583$ | 126,993$ |
| 5 | 11.90 % | 13,228$ | 158,742$ |
| 6 | 14.87 % | 16,536$ | 198,427$ |
| 7 | 18.59 % | 20,669$ | 248,034$ |
| 8 | 23.24 % | 25,837$ | 310,042$ |
| 9 | 29.05 % | 32,296$ | 387,552$ |
| 10 | 36.31 % | 40,370$ | 484,441$ |
2,162,121$ 162%
Total ROI For 10 Years
2,632$
Min Income
1,334,201$
Cash Price
| Year | Annual Increase | Monthly ROI | Annual ROI |
|---|---|---|---|
| 1 | 2.37 % | 2,632$ | 31,581$ |
| 2 | 2.96 % | 3,290$ | 39,477$ |
| 3 | 3.70 % | 4,112$ | 49,346$ |
| 4 | 4.62 % | 5,140$ | 61,682$ |
| 5 | 5.78 % | 6,425$ | 77,103$ |
| 6 | 7.22 % | 8,032$ | 96,379$ |
| 7 | 9.03 % | 10,039$ | 120,473$ |
| 8 | 11.29 % | 12,549$ | 150,592$ |
| 9 | 14.11 % | 15,687$ | 188,240$ |
| 10 | 17.64 % | 19,608$ | 235,300$ |
1,050,173$ 78%
Total ROI For 10 Years
District Classification
Rating
A+
Area map
Statistics
Population
349,970
Social Status
Married : 55%
Unmarried : 32%
area
174 Km2
Price Changes Over Last 5 Years
1 Year Change
11.84%
3 Year Change
445.3%
5 Year Change
490%
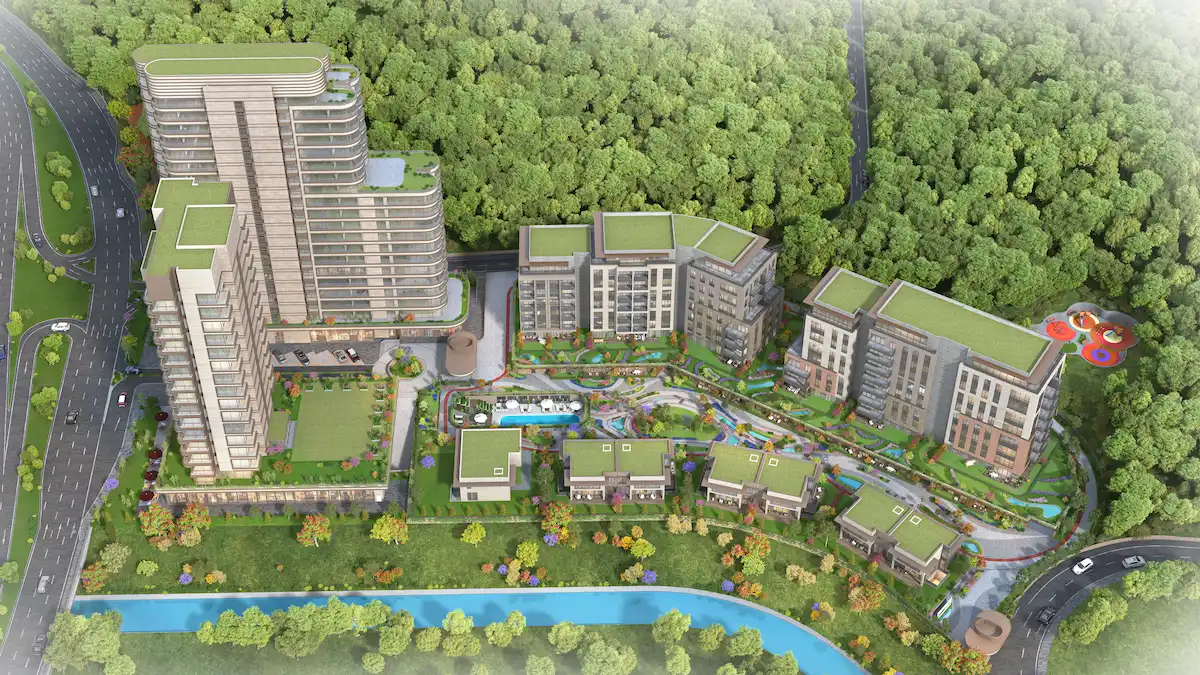
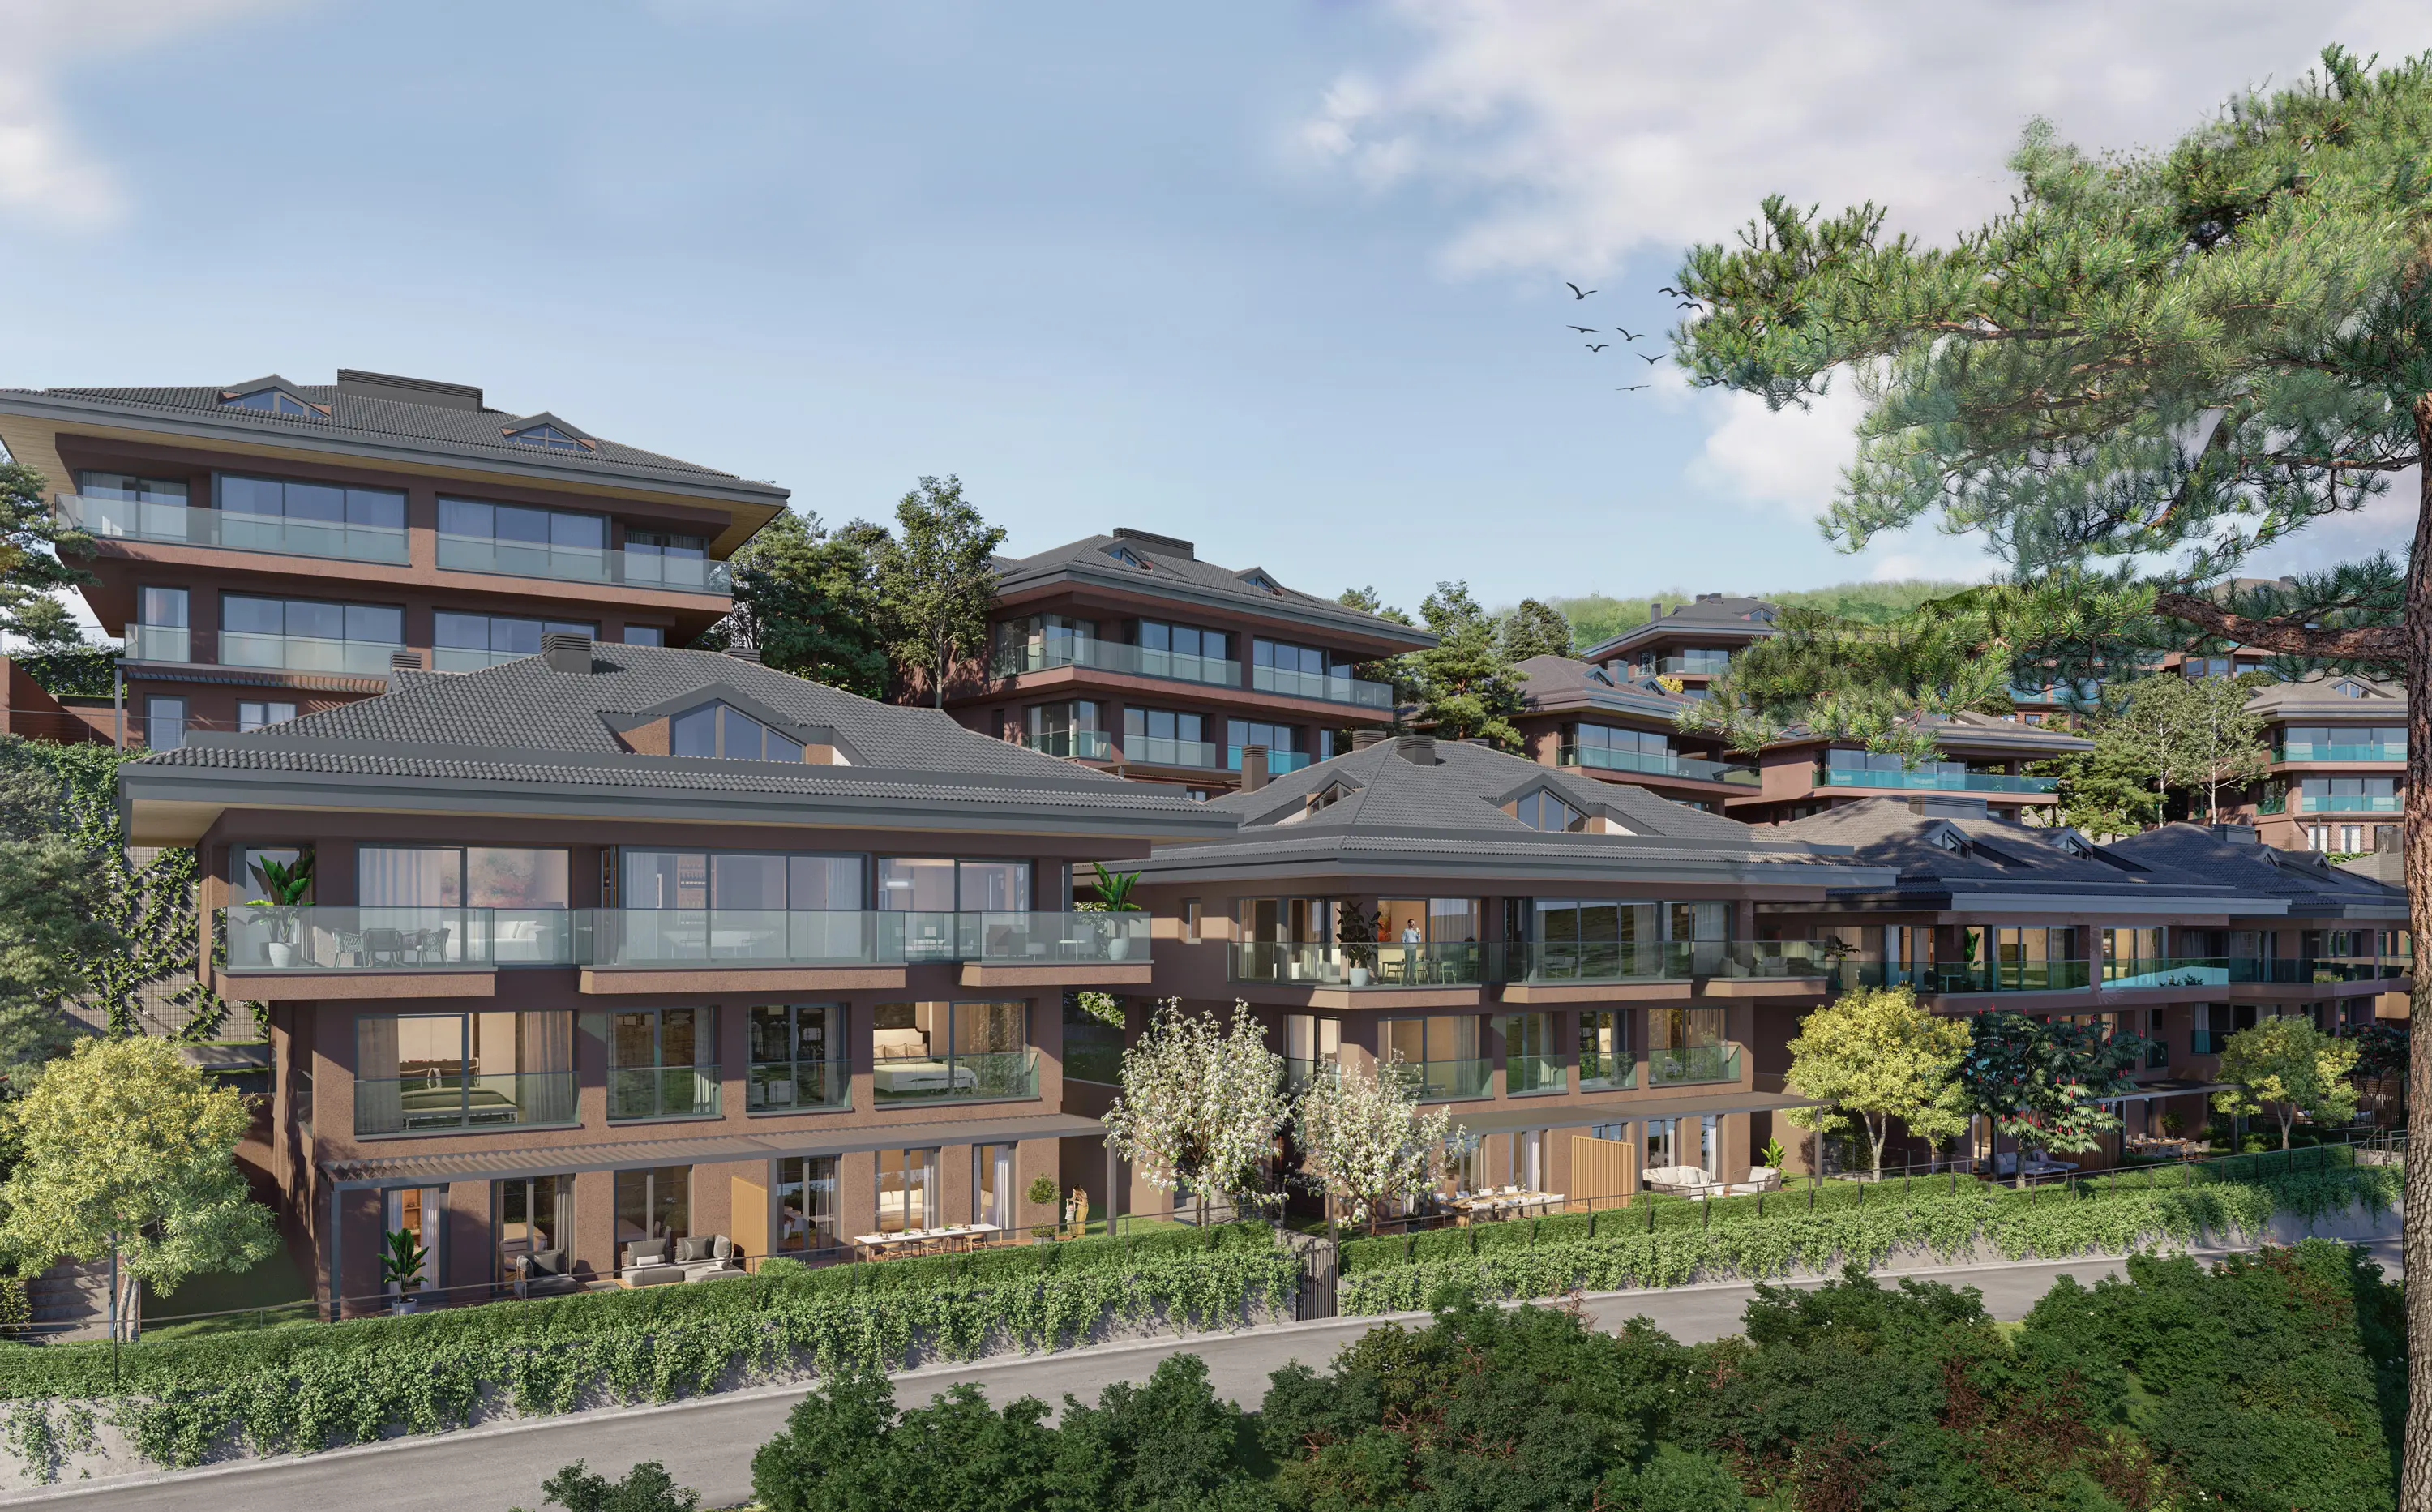
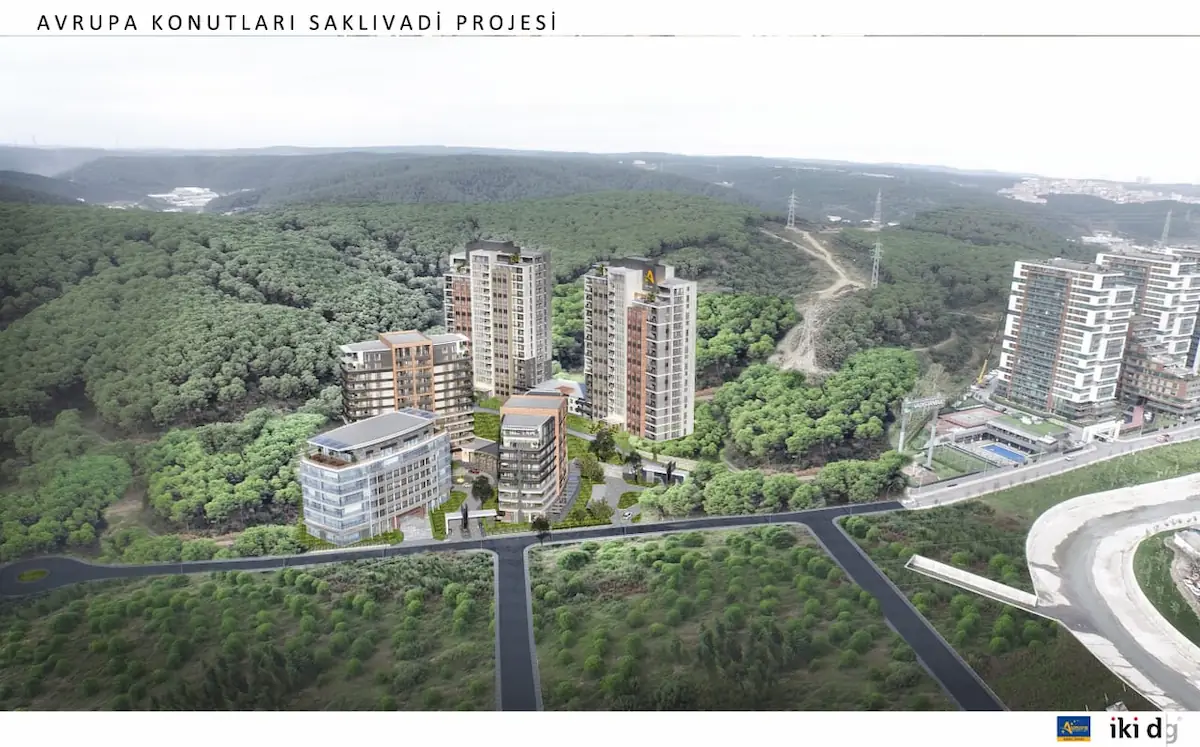
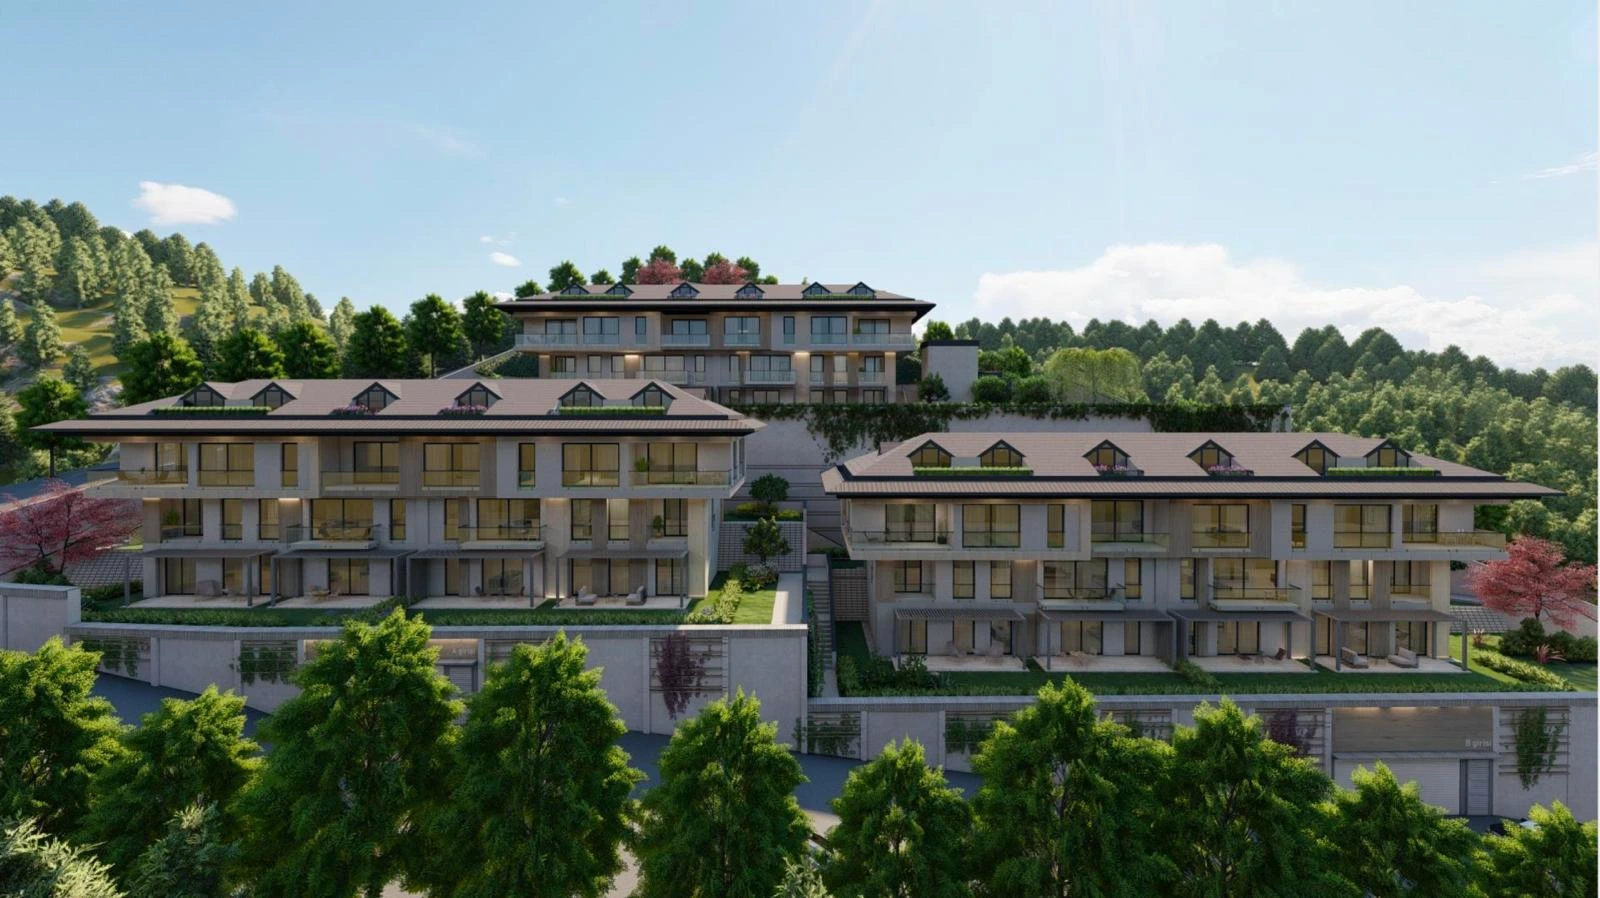
Projects Have same ROI in This Area


.webp)
Have Question Or Suggestion ?
Please Share Your Thought, To Make It Real


