Return on Investment In Turkey
We are providing a financial metric for real estate investors as it helps them to determine the profitability of their real estate investment in Turkey
344€
Average Income
287€ - 402€
Min Income - Max Income
166,867€
Cash Price
| Year | Annual Increase | Monthly ROI | Annual ROI |
|---|---|---|---|
| 1 | 2.48 % | 344€ | 4,132€ |
| 2 | 3.10 % | 430€ | 5,165€ |
| 3 | 3.87 % | 538€ | 6,456€ |
| 4 | 4.84 % | 673€ | 8,070€ |
| 5 | 6.05 % | 841€ | 10,088€ |
| 6 | 7.56 % | 1,051€ | 12,610€ |
| 7 | 9.45 % | 1,314€ | 15,762€ |
| 8 | 11.81 % | 1,642€ | 19,702€ |
| 9 | 14.76 % | 2,052€ | 24,628€ |
| 10 | 18.45 % | 2,565€ | 30,785€ |
137,398€ 82%
Total ROI For 10 Years
402€
Max Income
166,867€
Cash Price
| Year | Annual Increase | Monthly ROI | Annual ROI |
|---|---|---|---|
| 1 | 2.89 % | 402€ | 4,821€ |
| 2 | 3.61 % | 502€ | 6,026€ |
| 3 | 4.51 % | 628€ | 7,532€ |
| 4 | 5.64 % | 785€ | 9,415€ |
| 5 | 7.05 % | 981€ | 11,769€ |
| 6 | 8.82 % | 1,226€ | 14,711€ |
| 7 | 11.02 % | 1,532€ | 18,389€ |
| 8 | 13.78 % | 1,916€ | 22,986€ |
| 9 | 17.22 % | 2,394€ | 28,733€ |
| 10 | 21.52 % | 2,993€ | 35,916€ |
160,297€ 96%
Total ROI For 10 Years
287€
Min Income
166,867€
Cash Price
| Year | Annual Increase | Monthly ROI | Annual ROI |
|---|---|---|---|
| 1 | 2.06 % | 287€ | 3,443€ |
| 2 | 2.58 % | 359€ | 4,304€ |
| 3 | 3.22 % | 448€ | 5,380€ |
| 4 | 4.03 % | 560€ | 6,725€ |
| 5 | 5.04 % | 701€ | 8,406€ |
| 6 | 6.30 % | 876€ | 10,508€ |
| 7 | 7.87 % | 1,095€ | 13,135€ |
| 8 | 9.84 % | 1,368€ | 16,419€ |
| 9 | 12.30 % | 1,710€ | 20,523€ |
| 10 | 15.37 % | 2,138€ | 25,654€ |
114,498€ 68%
Total ROI For 10 Years
District Classification
Rating
B+
Area map
Statistics
Population
44,001
Social Status
Married : 62%
Unmarried : 27%
area
138 Km2
Price Changes Over Last 5 Years
1 Year Change
10.99%
3 Year Change
420.1%
5 Year Change
462.4%
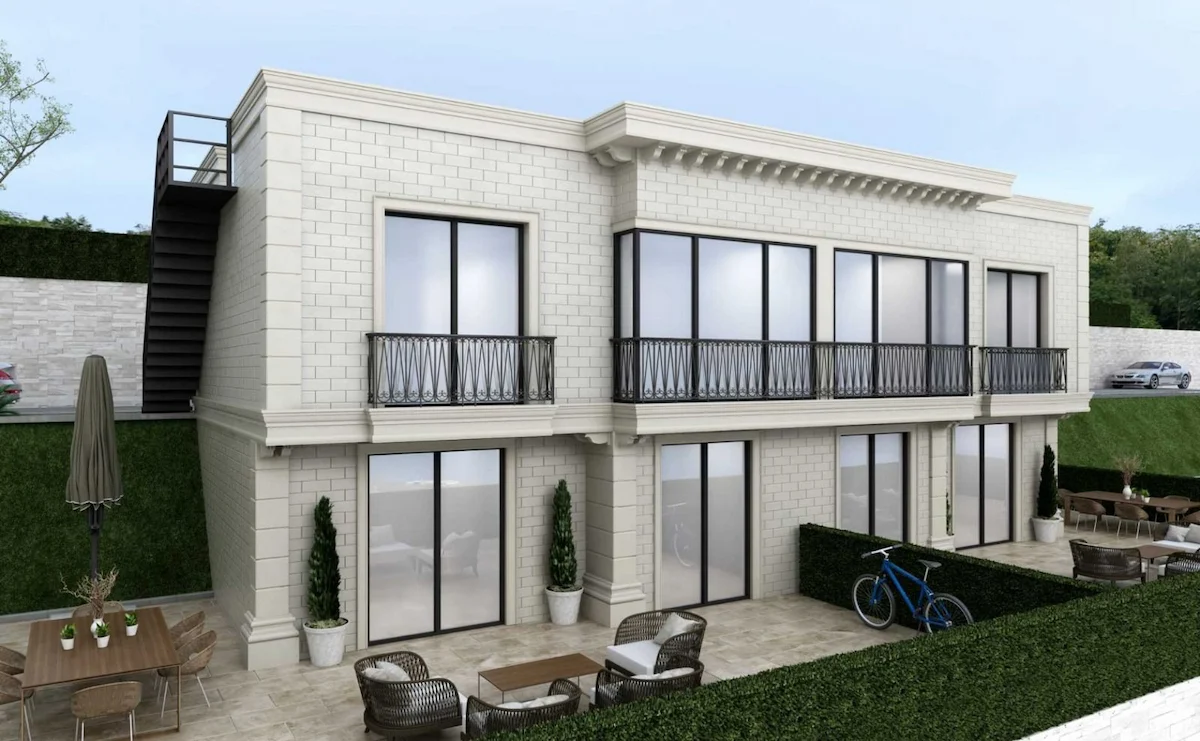
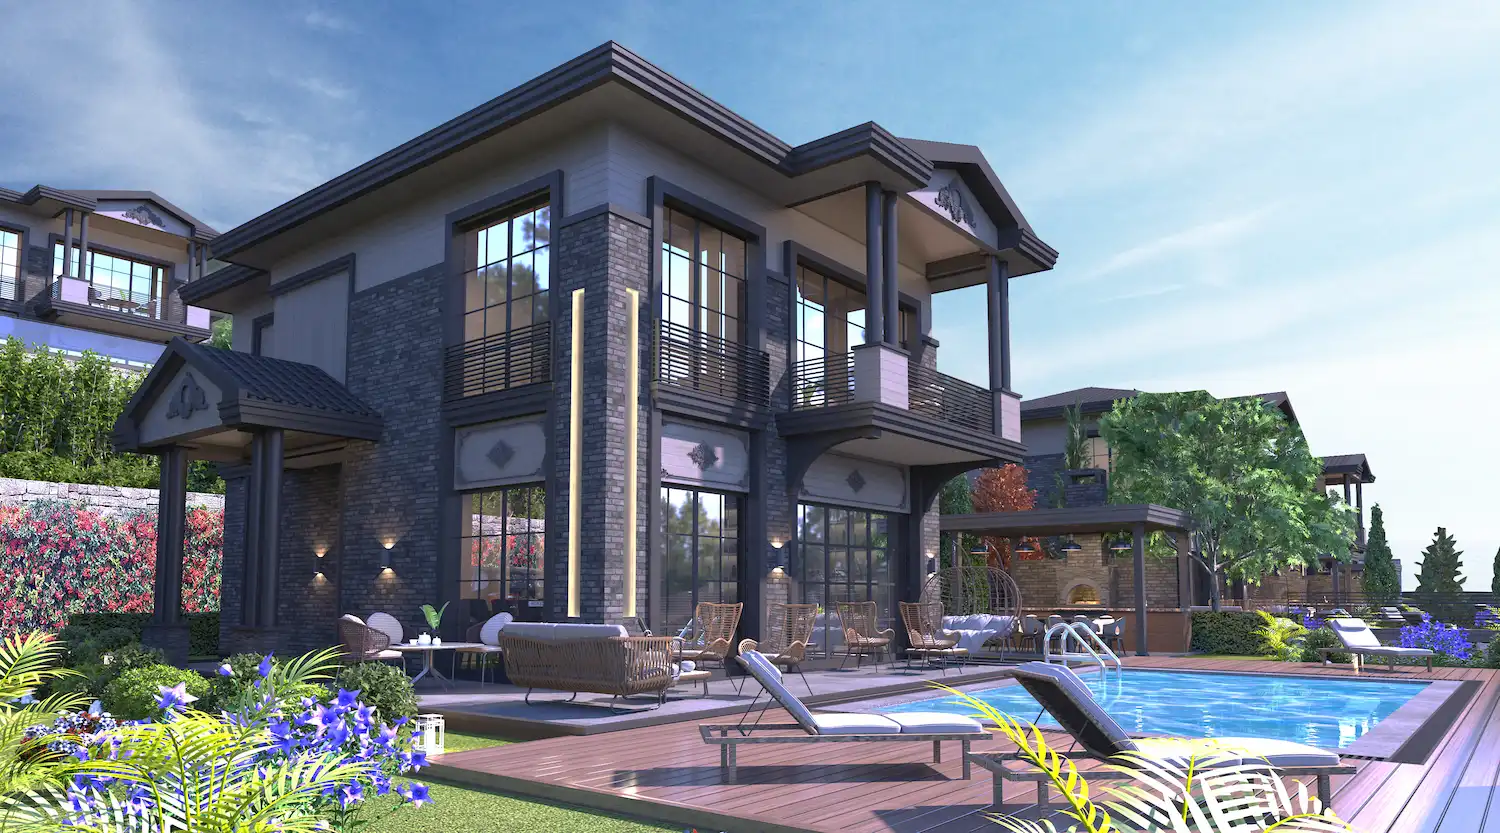
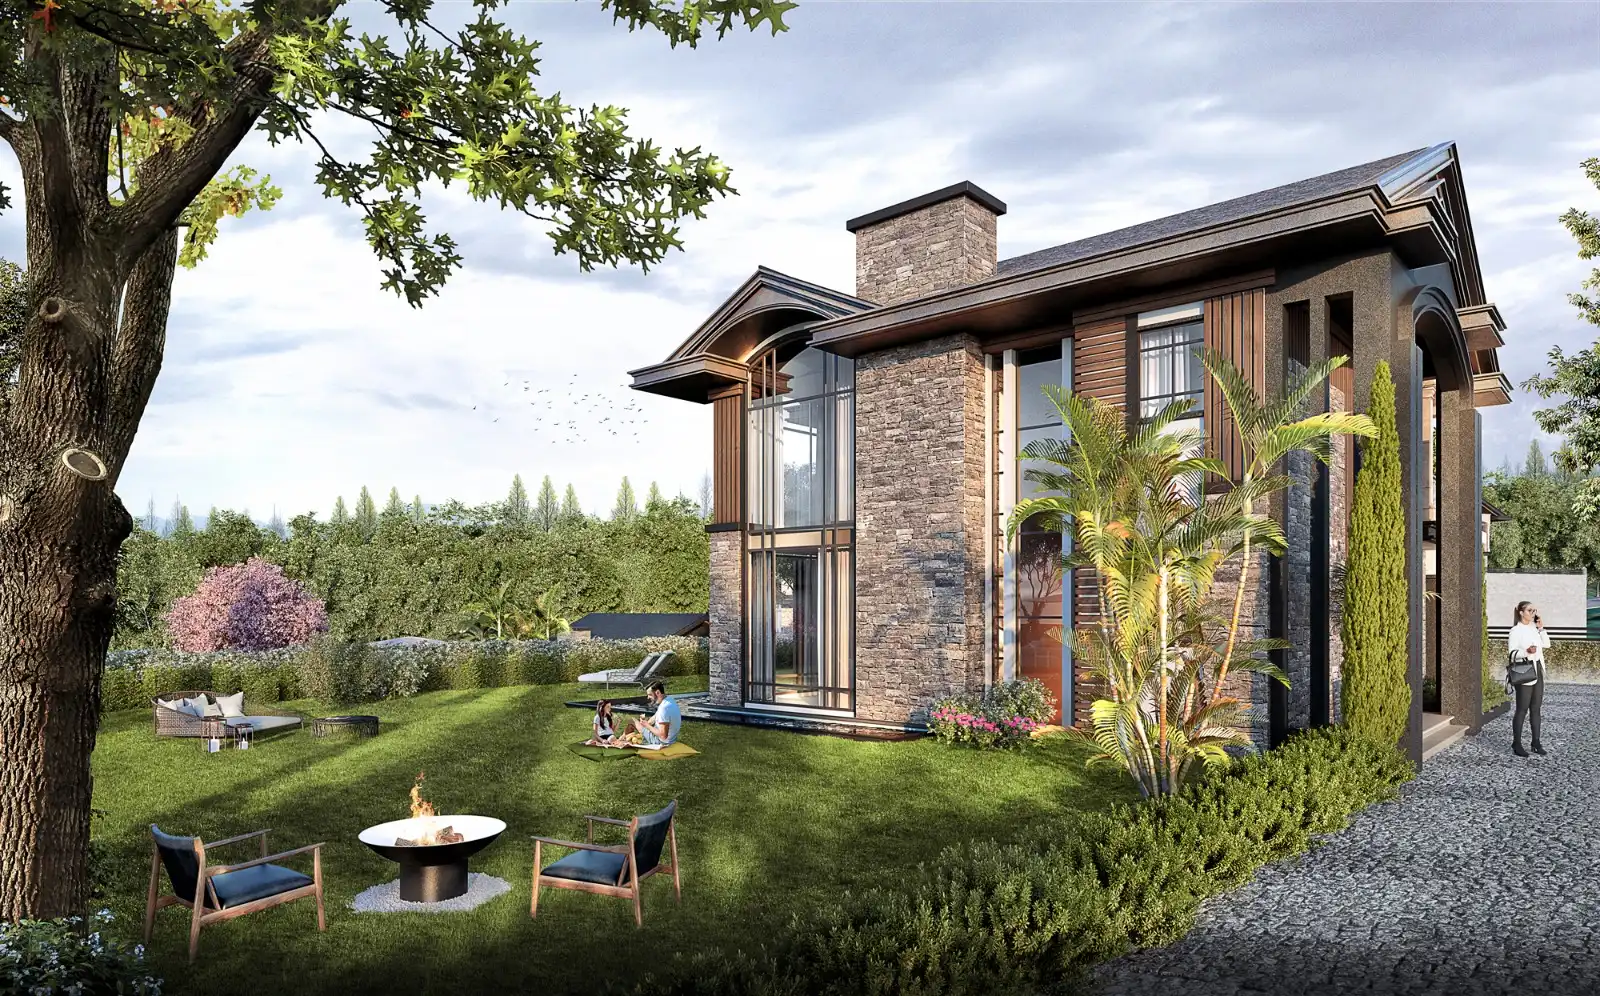
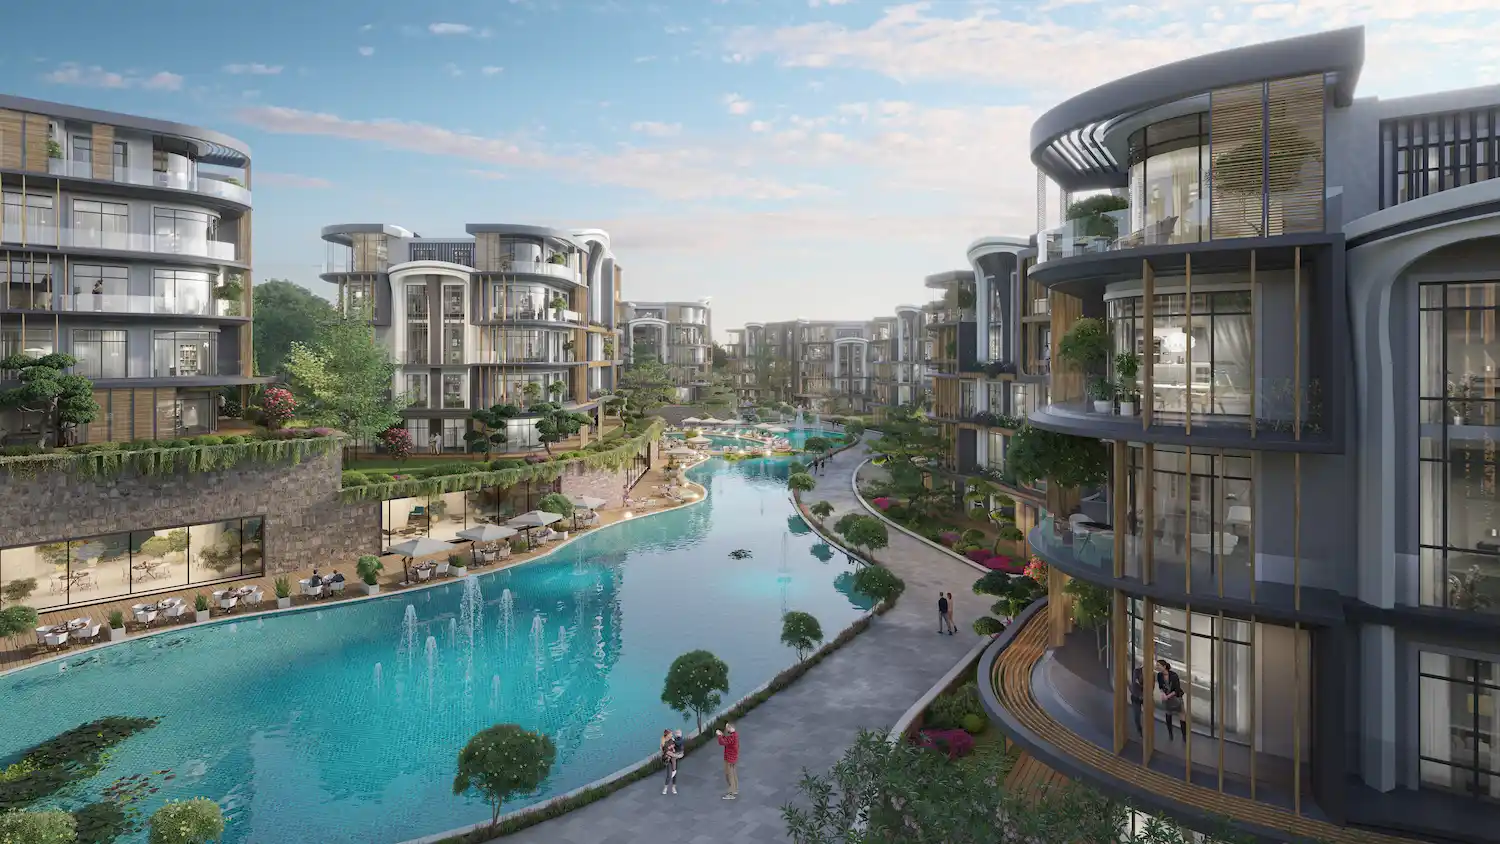
Projects Have same ROI in This Area
Have Question Or Suggestion ?
Please Share Your Thought, To Make It Real


