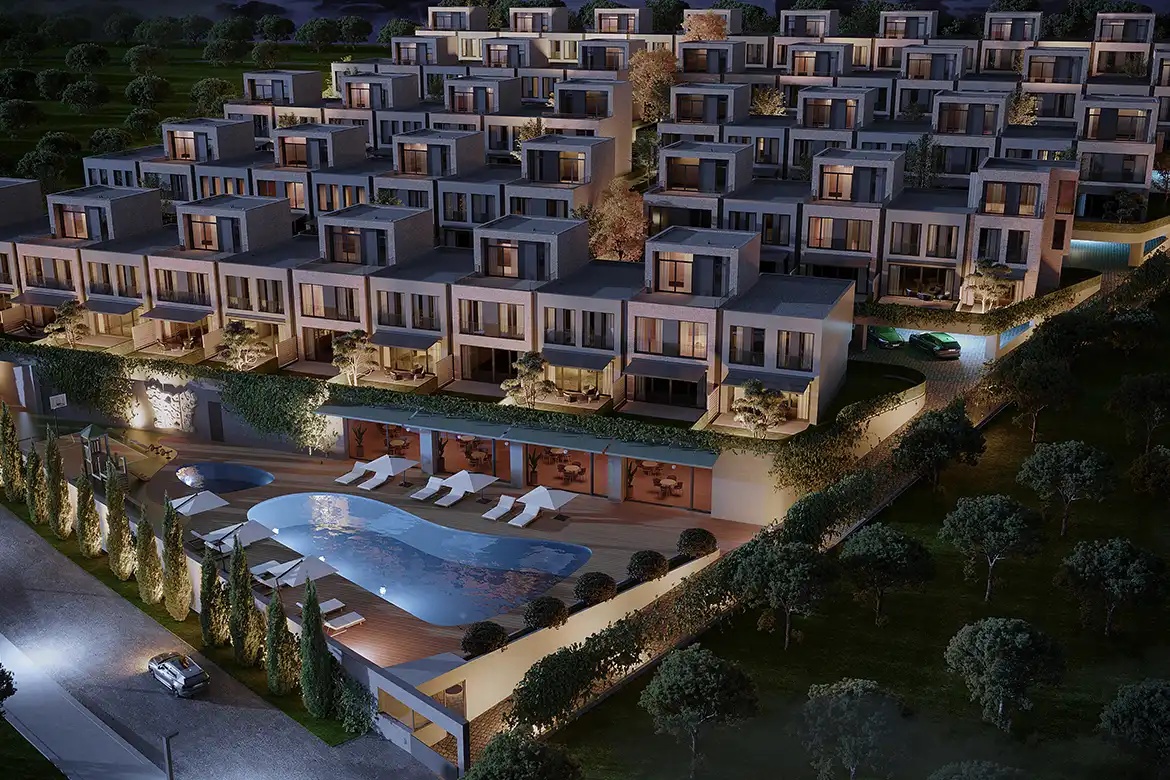
Return on Investment In Turkey
We are providing a financial metric for real estate investors as it helps them to determine the profitability of their real estate investment in Turkey
679$
Average Income
432$ - 926$
Min Income - Max Income
339,000$
Cash Price
| Year | Annual Increase | Monthly ROI | Annual ROI |
|---|---|---|---|
| 1 | 2.41 % | 679$ | 8,153$ |
| 2 | 3.01 % | 849$ | 10,191$ |
| 3 | 3.76 % | 1,062$ | 12,739$ |
| 4 | 4.70 % | 1,327$ | 15,924$ |
| 5 | 5.87 % | 1,659$ | 19,905$ |
| 6 | 7.34 % | 2,073$ | 24,881$ |
| 7 | 9.17 % | 2,592$ | 31,101$ |
| 8 | 11.47 % | 3,240$ | 38,877$ |
| 9 | 14.34 % | 4,050$ | 48,596$ |
| 10 | 17.92 % | 5,062$ | 60,745$ |
271,113$ 79%
Total ROI For 10 Years
926$
Max Income
339,000$
Cash Price
| Year | Annual Increase | Monthly ROI | Annual ROI |
|---|---|---|---|
| 1 | 3.28 % | 926$ | 11,118$ |
| 2 | 4.10 % | 1,158$ | 13,897$ |
| 3 | 5.12 % | 1,448$ | 17,372$ |
| 4 | 6.41 % | 1,810$ | 21,714$ |
| 5 | 8.01 % | 2,262$ | 27,143$ |
| 6 | 10.01 % | 2,827$ | 33,929$ |
| 7 | 12.51 % | 3,534$ | 42,411$ |
| 8 | 15.64 % | 4,418$ | 53,014$ |
| 9 | 19.55 % | 5,522$ | 66,267$ |
| 10 | 24.43 % | 6,903$ | 82,834$ |
369,699$ 109%
Total ROI For 10 Years
432$
Min Income
339,000$
Cash Price
| Year | Annual Increase | Monthly ROI | Annual ROI |
|---|---|---|---|
| 1 | 1.53 % | 432$ | 5,188$ |
| 2 | 1.91 % | 540$ | 6,485$ |
| 3 | 2.39 % | 676$ | 8,107$ |
| 4 | 2.99 % | 844$ | 10,133$ |
| 5 | 3.74 % | 1,056$ | 12,667$ |
| 6 | 4.67 % | 1,319$ | 15,833$ |
| 7 | 5.84 % | 1,649$ | 19,792$ |
| 8 | 7.30 % | 2,062$ | 24,740$ |
| 9 | 9.12 % | 2,577$ | 30,925$ |
| 10 | 11.40 % | 3,221$ | 38,656$ |
172,526$ 50%
Total ROI For 10 Years
District Classification
Rating
B-
Area map
Statistics
Population
711,894
Social Status
Married : 63%
Unmarried : 28%
area
167 Km2
Price Changes Over Last 5 Years
1 Year Change
17.58%
3 Year Change
281.3%
5 Year Change
294.6%
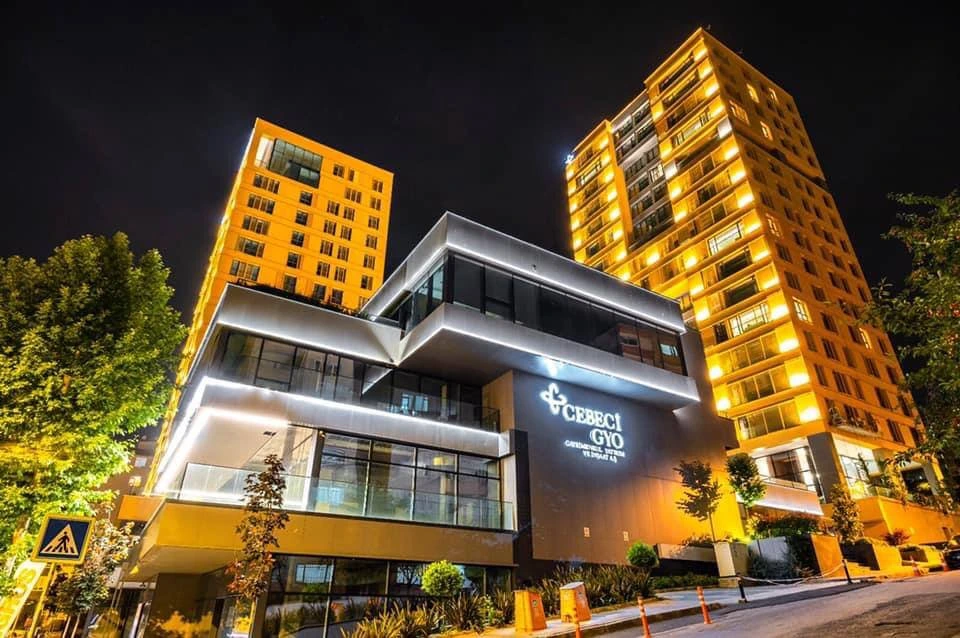
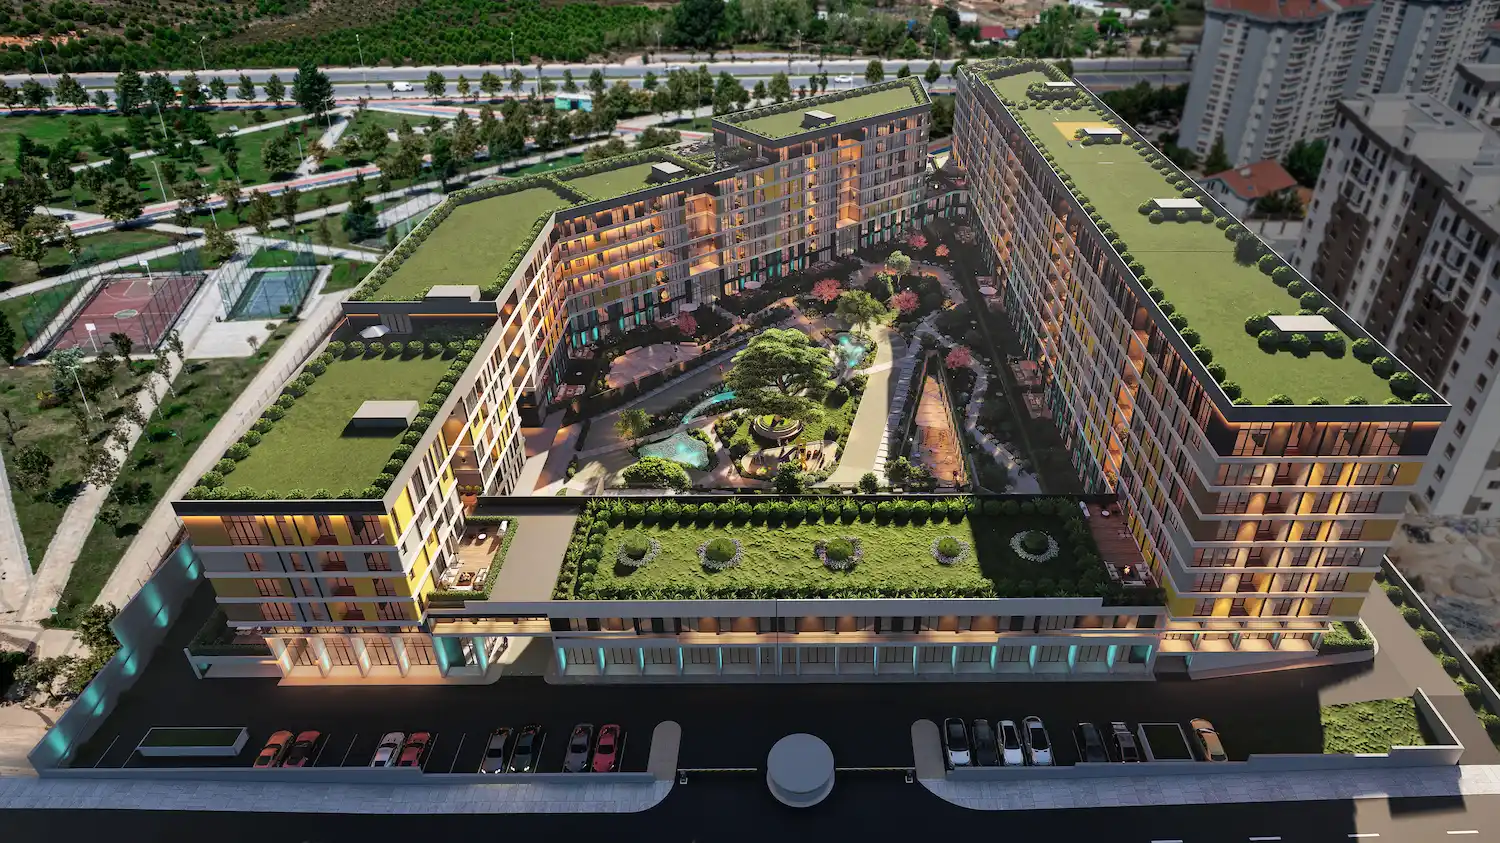
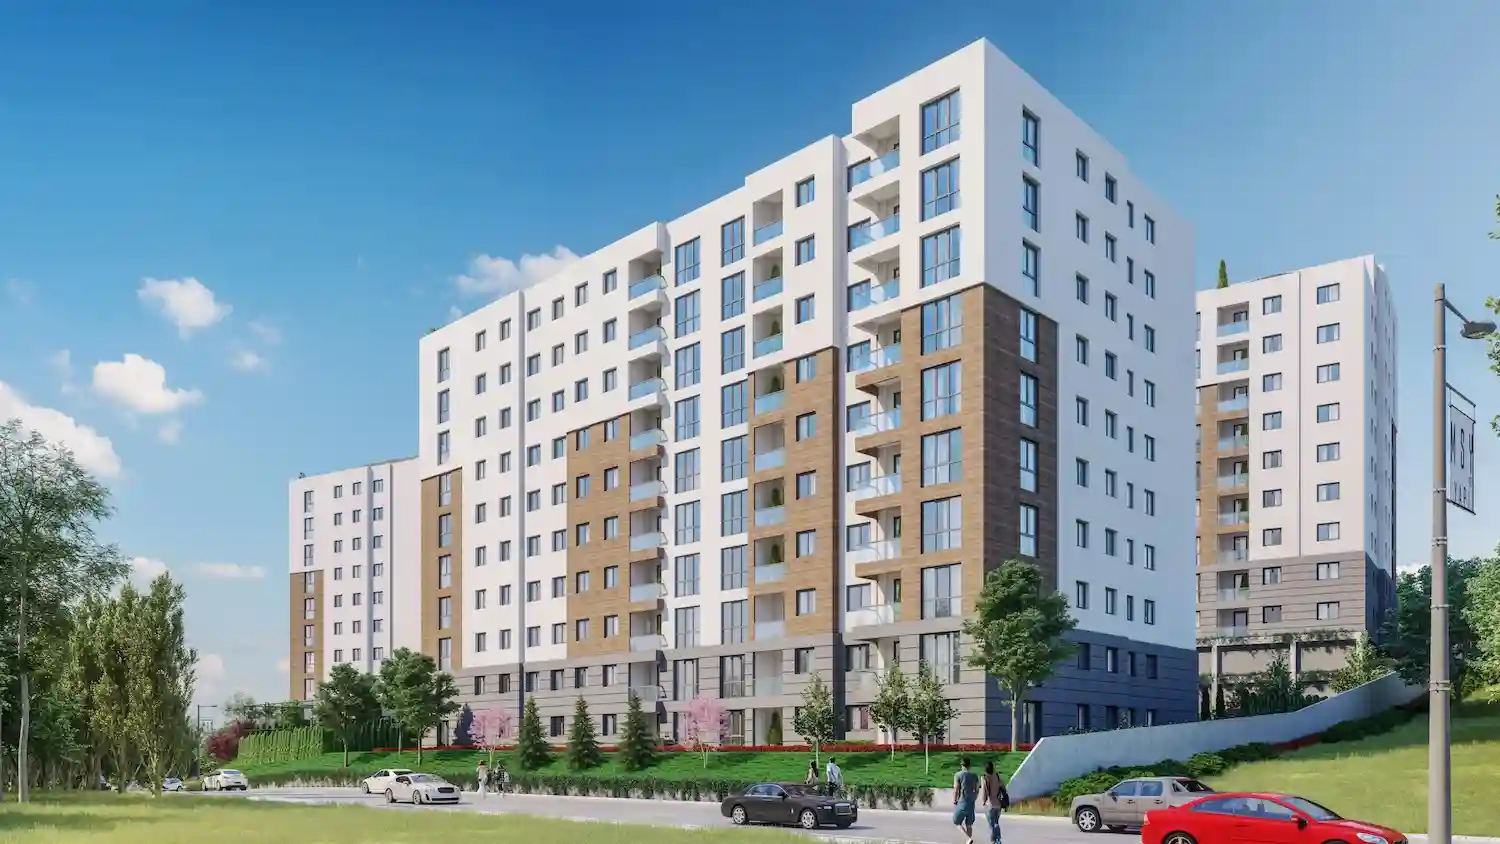
Projects Have same ROI in This Area
Have Question Or Suggestion ?
Please Share Your Thought, To Make It Real
.webp)
.webp)
