Return on Investment In Turkey
We are providing a financial metric for real estate investors as it helps them to determine the profitability of their real estate investment in Turkey
577€
Average Income
433€ - 721€
Min Income - Max Income
9,495€
Cash Price
| Year | Annual Increase | Monthly ROI | Annual ROI |
|---|---|---|---|
| 1 | 72.92 % | 577€ | 6,924€ |
| 2 | 91.16 % | 721€ | 8,655€ |
| 3 | 113.94 % | 902€ | 10,819€ |
| 4 | 142.43 % | 1,127€ | 13,523€ |
| 5 | 178.04 % | 1,409€ | 16,904€ |
| 6 | 222.55 % | 1,761€ | 21,130€ |
| 7 | 278.18 % | 2,201€ | 26,413€ |
| 8 | 347.73 % | 2,751€ | 33,016€ |
| 9 | 434.66 % | 3,439€ | 41,270€ |
| 10 | 543.33 % | 4,299€ | 51,587€ |
230,241€ 2,424%
Total ROI For 10 Years
721€
Max Income
9,495€
Cash Price
| Year | Annual Increase | Monthly ROI | Annual ROI |
|---|---|---|---|
| 1 | 91.16 % | 721€ | 8,655€ |
| 2 | 113.94 % | 902€ | 10,819€ |
| 3 | 142.43 % | 1,127€ | 13,523€ |
| 4 | 178.04 % | 1,409€ | 16,904€ |
| 5 | 222.55 % | 1,761€ | 21,130€ |
| 6 | 278.18 % | 2,201€ | 26,413€ |
| 7 | 347.73 % | 2,751€ | 33,016€ |
| 8 | 434.66 % | 3,439€ | 41,270€ |
| 9 | 543.33 % | 4,299€ | 51,587€ |
| 10 | 679.16 % | 5,374€ | 64,484€ |
287,802€ 3,031%
Total ROI For 10 Years
433€
Min Income
9,495€
Cash Price
| Year | Annual Increase | Monthly ROI | Annual ROI |
|---|---|---|---|
| 1 | 54.69 % | 433€ | 5,193€ |
| 2 | 68.37 % | 541€ | 6,491€ |
| 3 | 85.46 % | 676€ | 8,114€ |
| 4 | 106.82 % | 845€ | 10,143€ |
| 5 | 133.53 % | 1,057€ | 12,678€ |
| 6 | 166.91 % | 1,321€ | 15,848€ |
| 7 | 208.64 % | 1,651€ | 19,810€ |
| 8 | 260.80 % | 2,064€ | 24,762€ |
| 9 | 326.00 % | 2,579€ | 30,952€ |
| 10 | 407.50 % | 3,224€ | 38,691€ |
172,681€ 1,818%
Total ROI For 10 Years
District Classification
Rating
a
Area map
Statistics
Population
448,882
Social Status
Married : 56%
Unmarried : 46%
area
52 Km2
Price Changes Over Last 5 Years
1 Year Change
13.64%
3 Year Change
339%
5 Year Change
370.8%
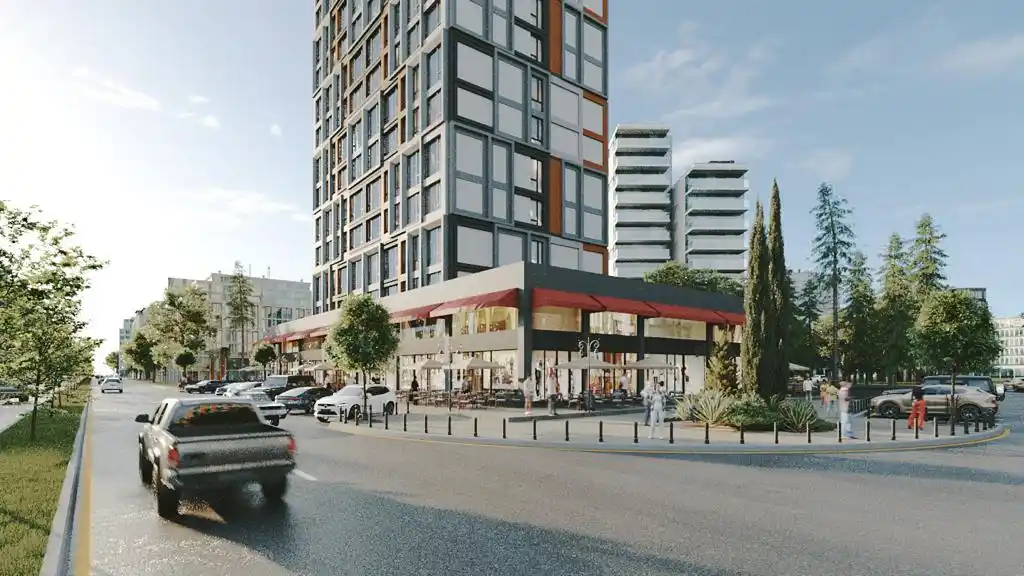
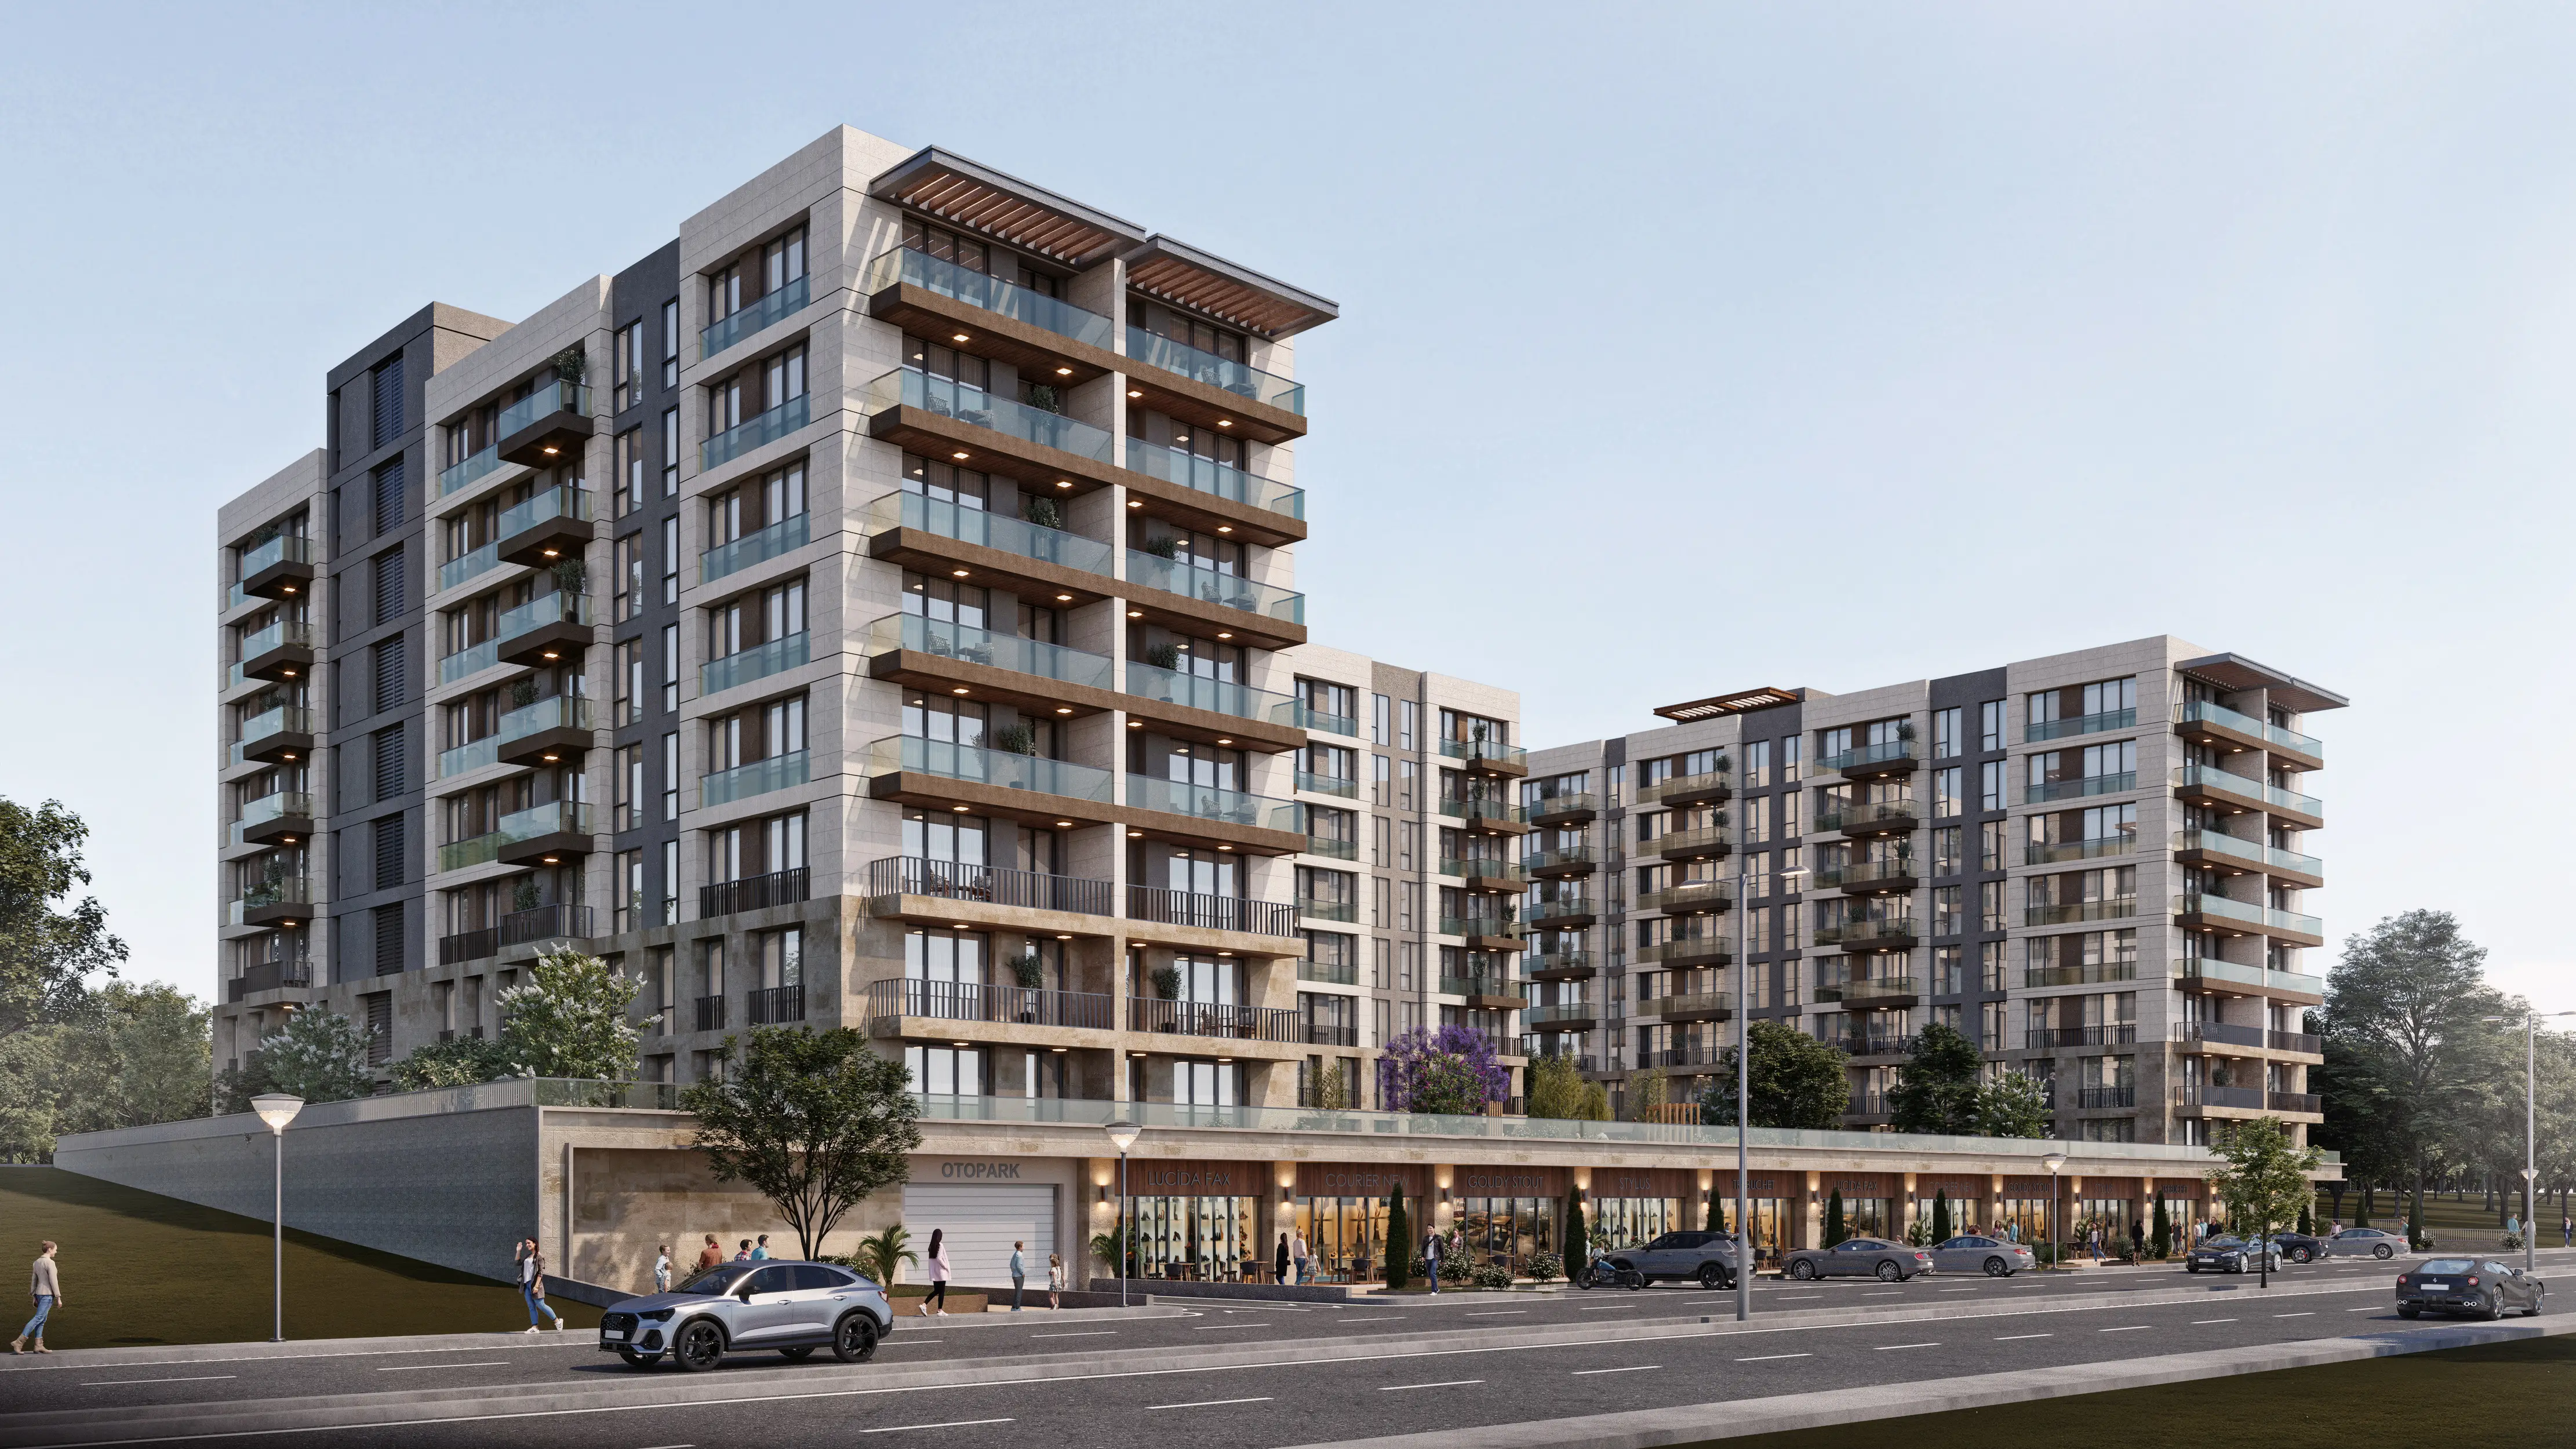
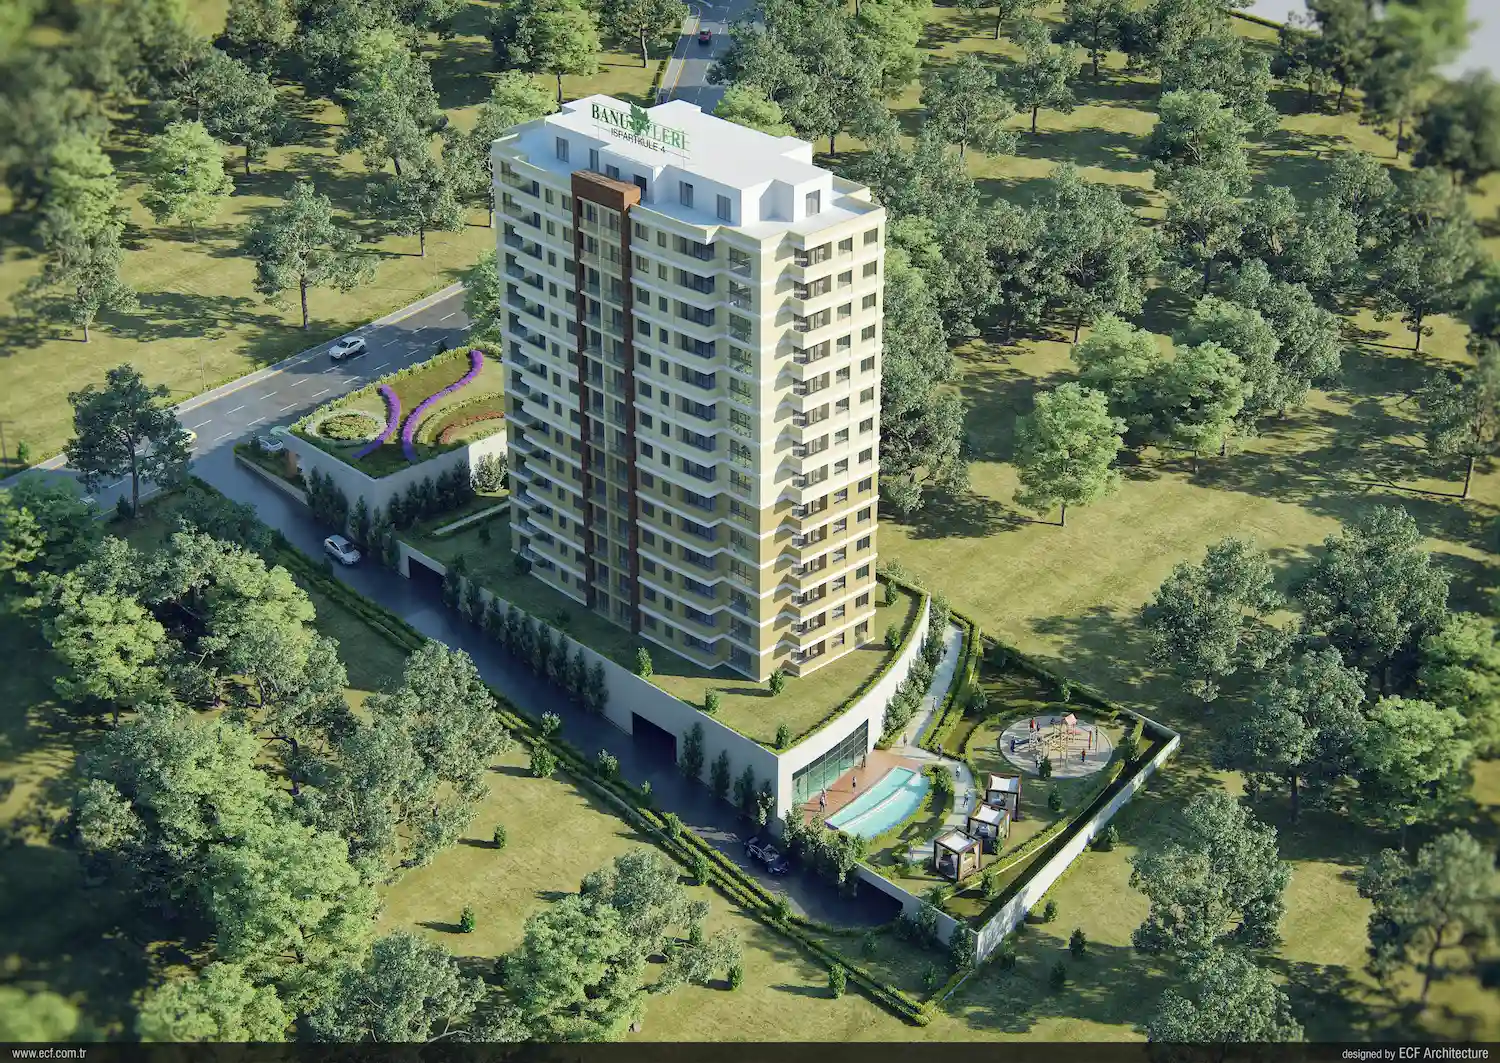
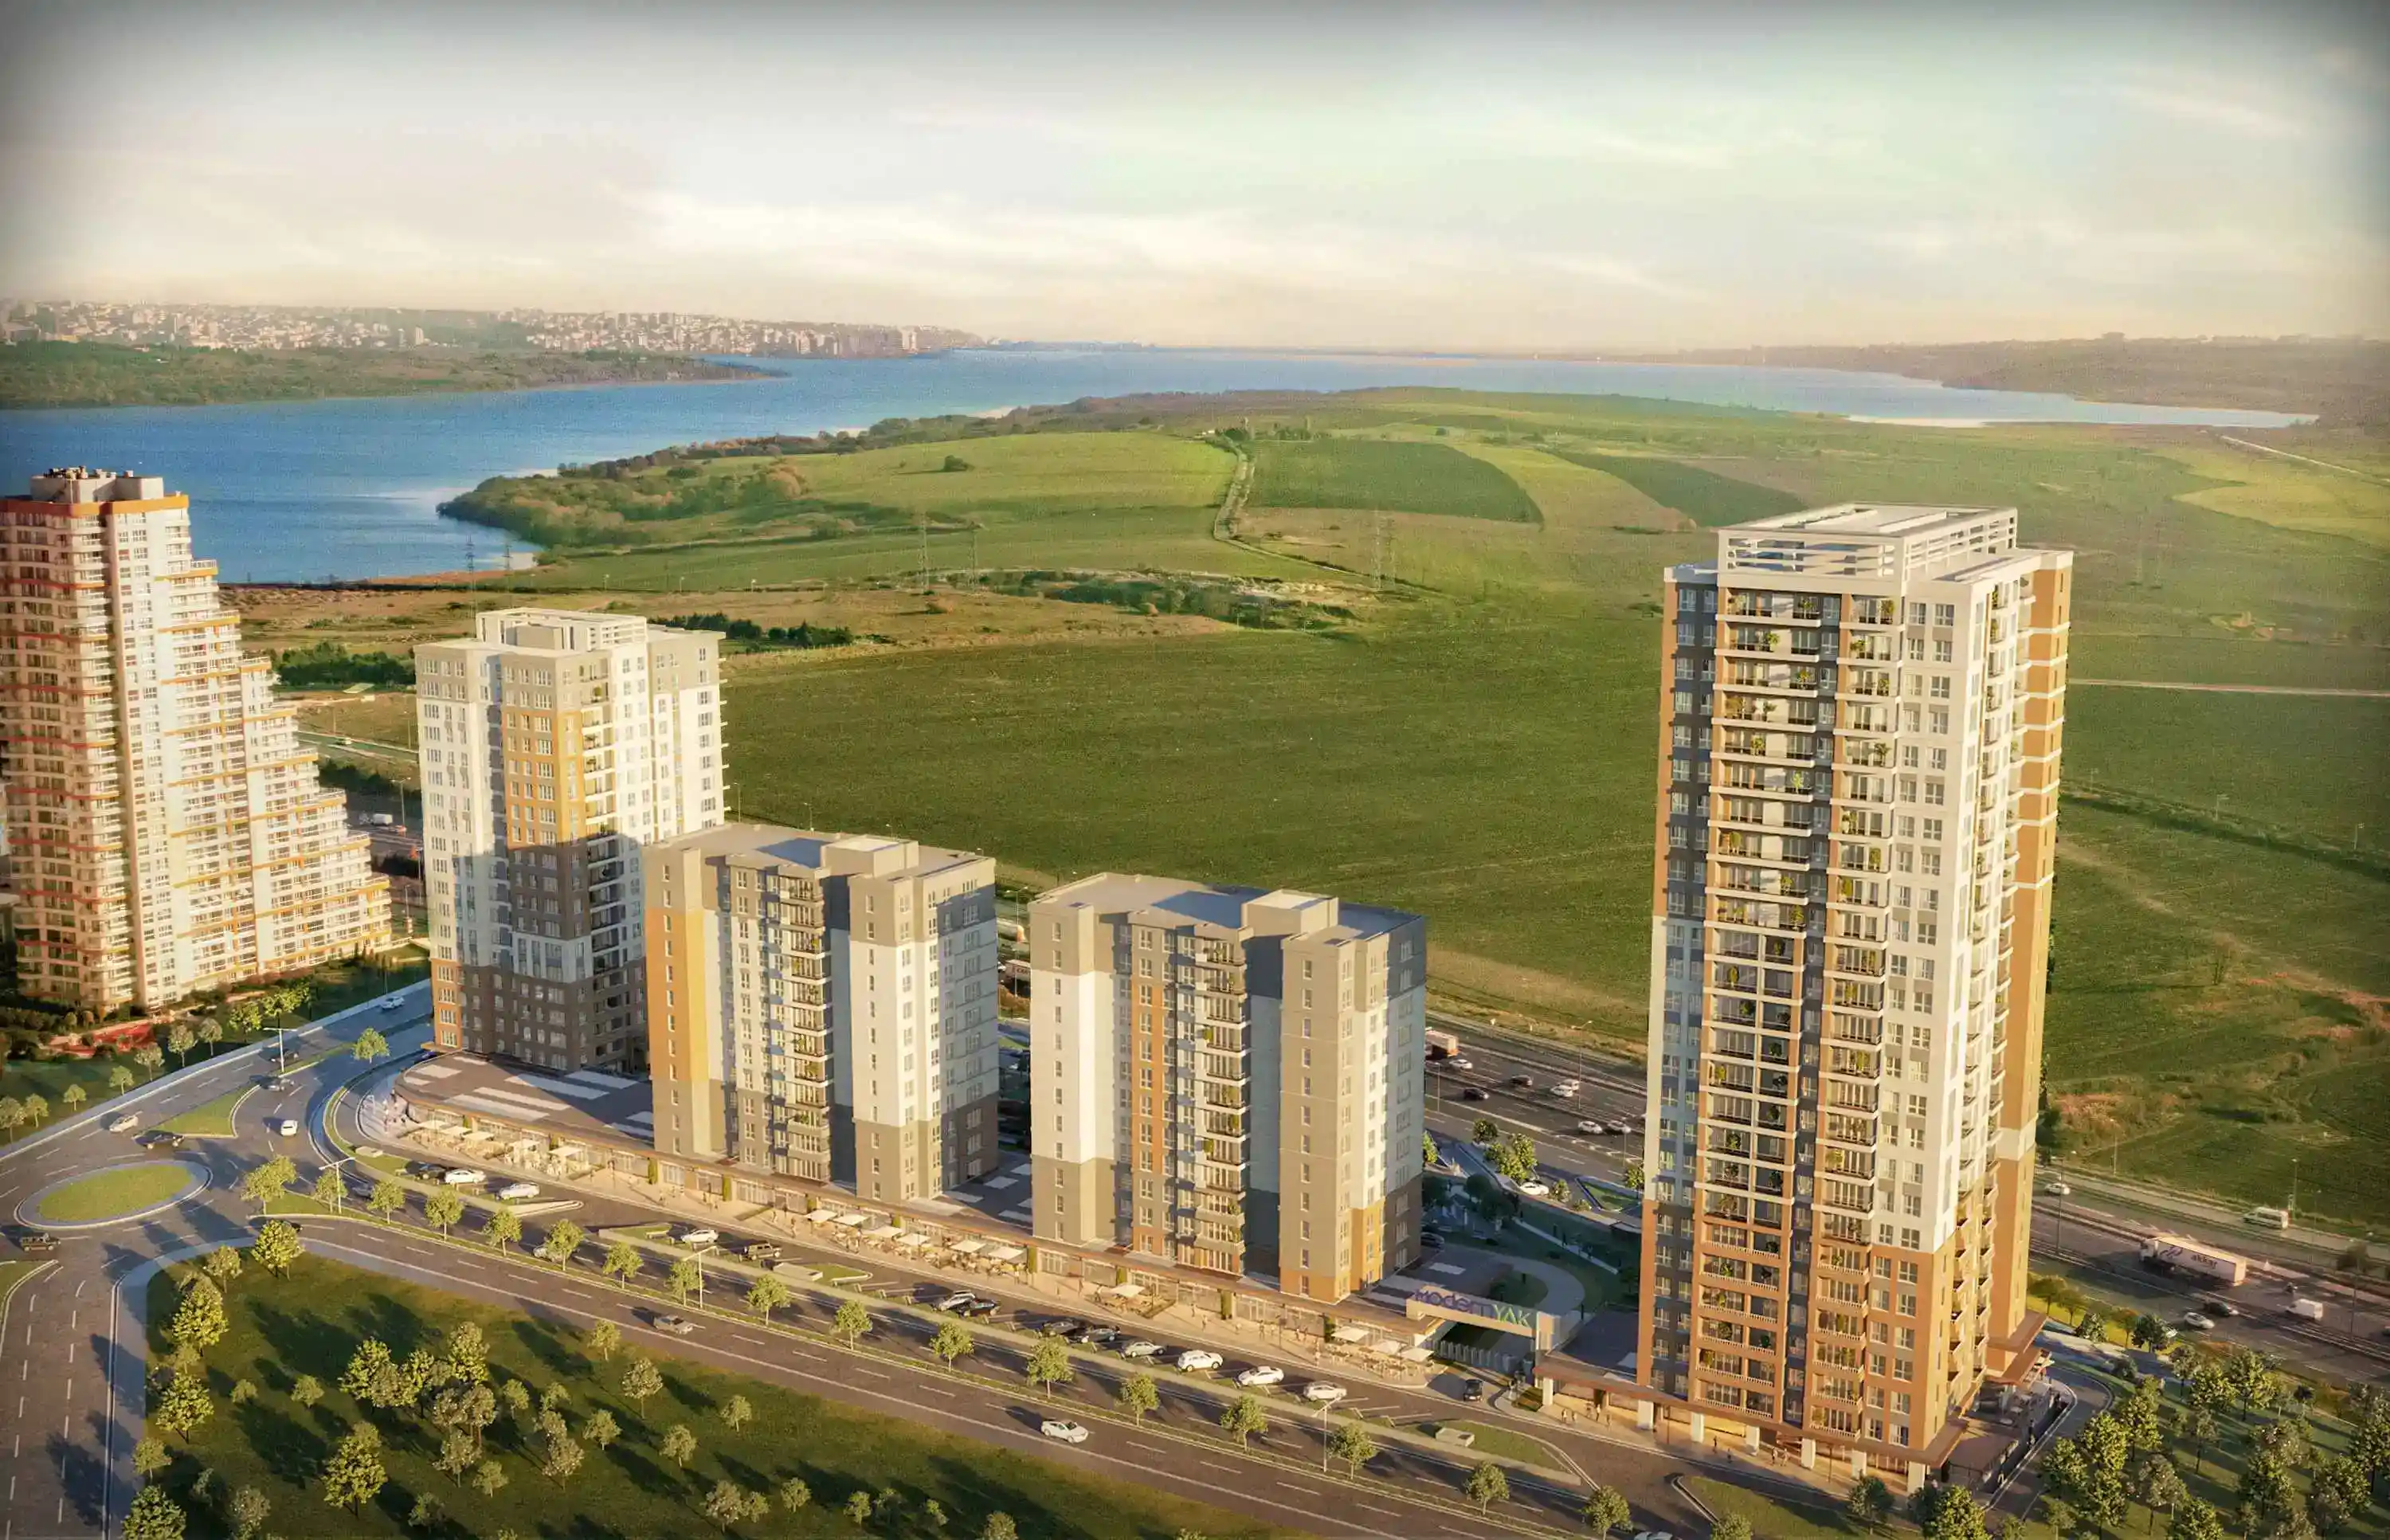
Projects Have same ROI in This Area
.webp)

Have Question Or Suggestion ?
Please Share Your Thought, To Make It Real


