Return on Investment In Turkey
We are providing a financial metric for real estate investors as it helps them to determine the profitability of their real estate investment in Turkey
475€
Average Income
316€ - 633€
Min Income - Max Income
292,812€
Cash Price
| Year | Annual Increase | Monthly ROI | Annual ROI |
|---|---|---|---|
| 1 | 1.94 % | 475€ | 5,695€ |
| 2 | 2.43 % | 593€ | 7,118€ |
| 3 | 3.04 % | 742€ | 8,898€ |
| 4 | 3.80 % | 927€ | 11,123€ |
| 5 | 4.75 % | 1,159€ | 13,903€ |
| 6 | 5.94 % | 1,448€ | 17,379€ |
| 7 | 7.42 % | 1,810€ | 21,724€ |
| 8 | 9.27 % | 2,263€ | 27,155€ |
| 9 | 11.59 % | 2,829€ | 33,943€ |
| 10 | 14.49 % | 3,536€ | 42,429€ |
189,367€ 64%
Total ROI For 10 Years
633€
Max Income
292,812€
Cash Price
| Year | Annual Increase | Monthly ROI | Annual ROI |
|---|---|---|---|
| 1 | 2.59 % | 633€ | 7,593€ |
| 2 | 3.24 % | 791€ | 9,491€ |
| 3 | 4.05 % | 989€ | 11,864€ |
| 4 | 5.06 % | 1,236€ | 14,830€ |
| 5 | 6.33 % | 1,545€ | 18,538€ |
| 6 | 7.91 % | 1,931€ | 23,172€ |
| 7 | 9.89 % | 2,414€ | 28,965€ |
| 8 | 12.36 % | 3,017€ | 36,206€ |
| 9 | 15.46 % | 3,771€ | 45,258€ |
| 10 | 19.32 % | 4,714€ | 56,572€ |
252,489€ 86%
Total ROI For 10 Years
316€
Min Income
292,812€
Cash Price
| Year | Annual Increase | Monthly ROI | Annual ROI |
|---|---|---|---|
| 1 | 1.30 % | 316€ | 3,796€ |
| 2 | 1.62 % | 395€ | 4,746€ |
| 3 | 2.03 % | 494€ | 5,932€ |
| 4 | 2.53 % | 618€ | 7,415€ |
| 5 | 3.17 % | 772€ | 9,269€ |
| 6 | 3.96 % | 966€ | 11,586€ |
| 7 | 4.95 % | 1,207€ | 14,482€ |
| 8 | 6.18 % | 1,509€ | 18,103€ |
| 9 | 7.73 % | 1,886€ | 22,629€ |
| 10 | 9.66 % | 2,357€ | 28,286€ |
126,244€ 43%
Total ROI For 10 Years
District Classification
Rating
A-
Area map
Statistics
Population
745,125
Social Status
Married : 62%
Unmarried : 30%
area
22 Km2
Price Changes Over Last 5 Years
1 Year Change
13.59%
3 Year Change
263.6%
5 Year Change
273.2%
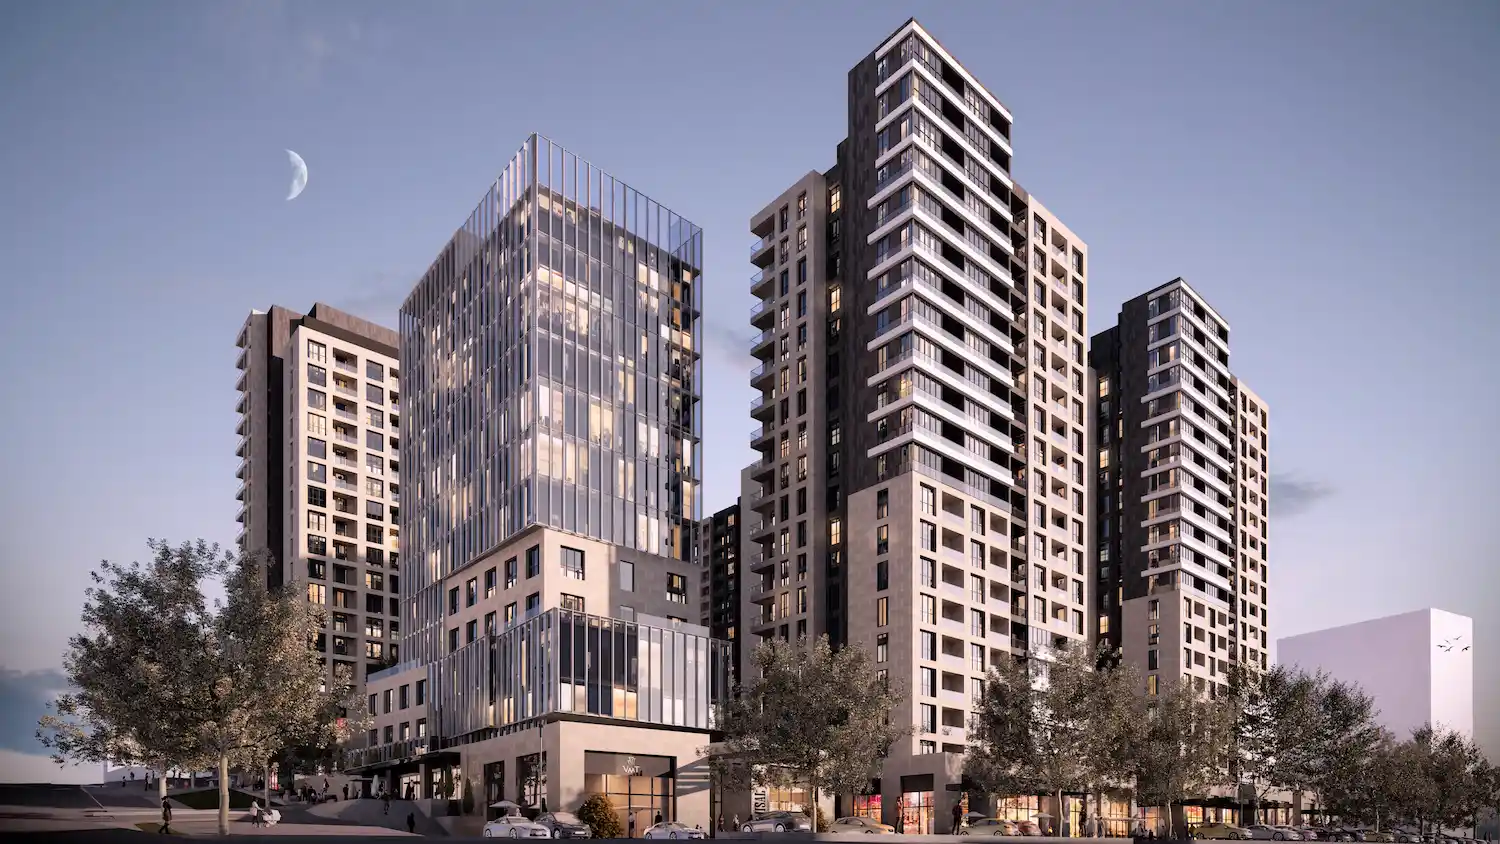
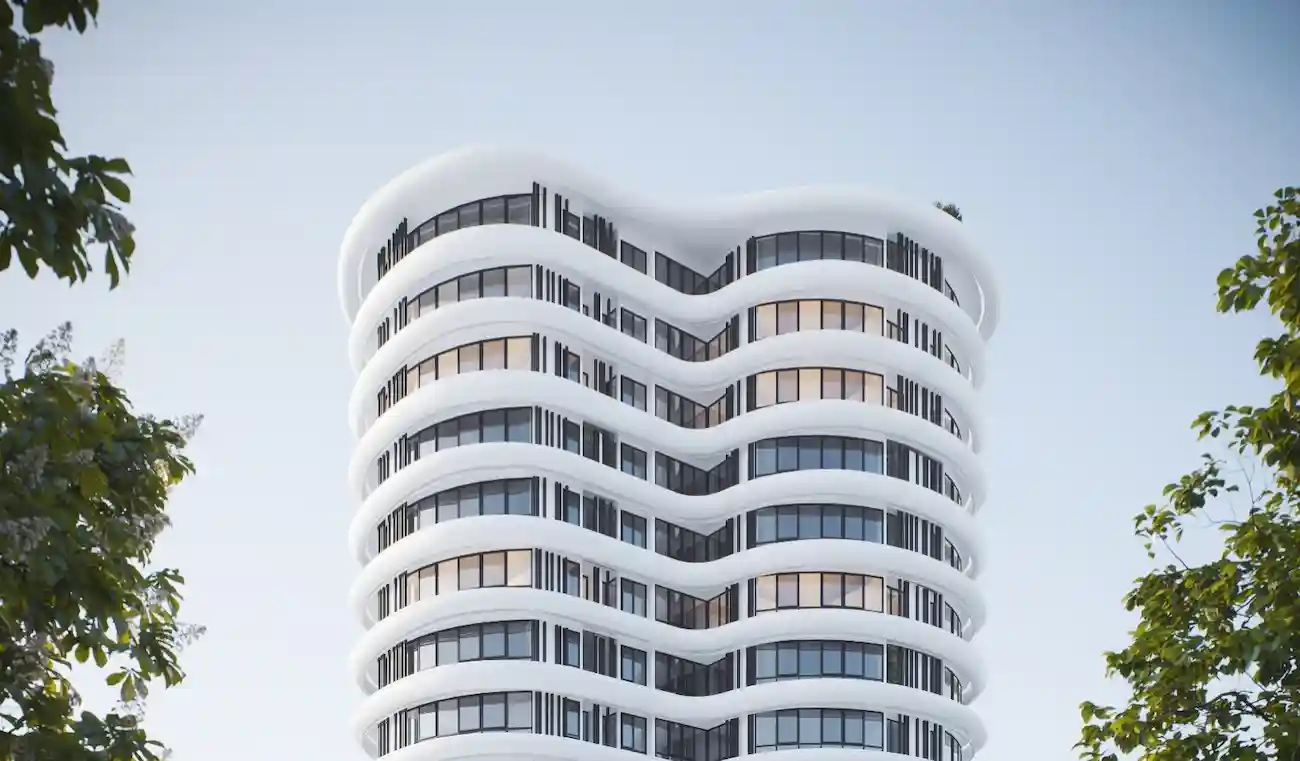
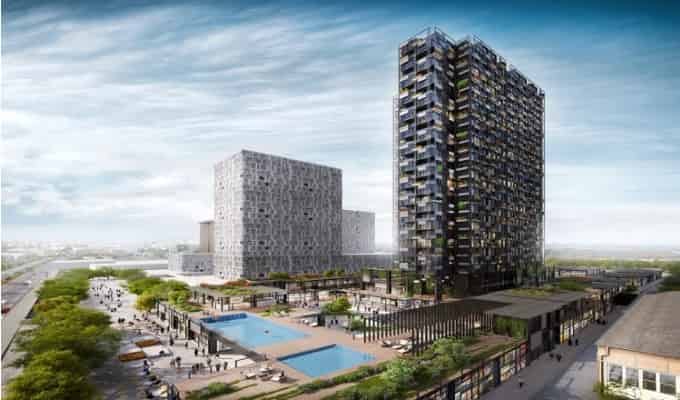
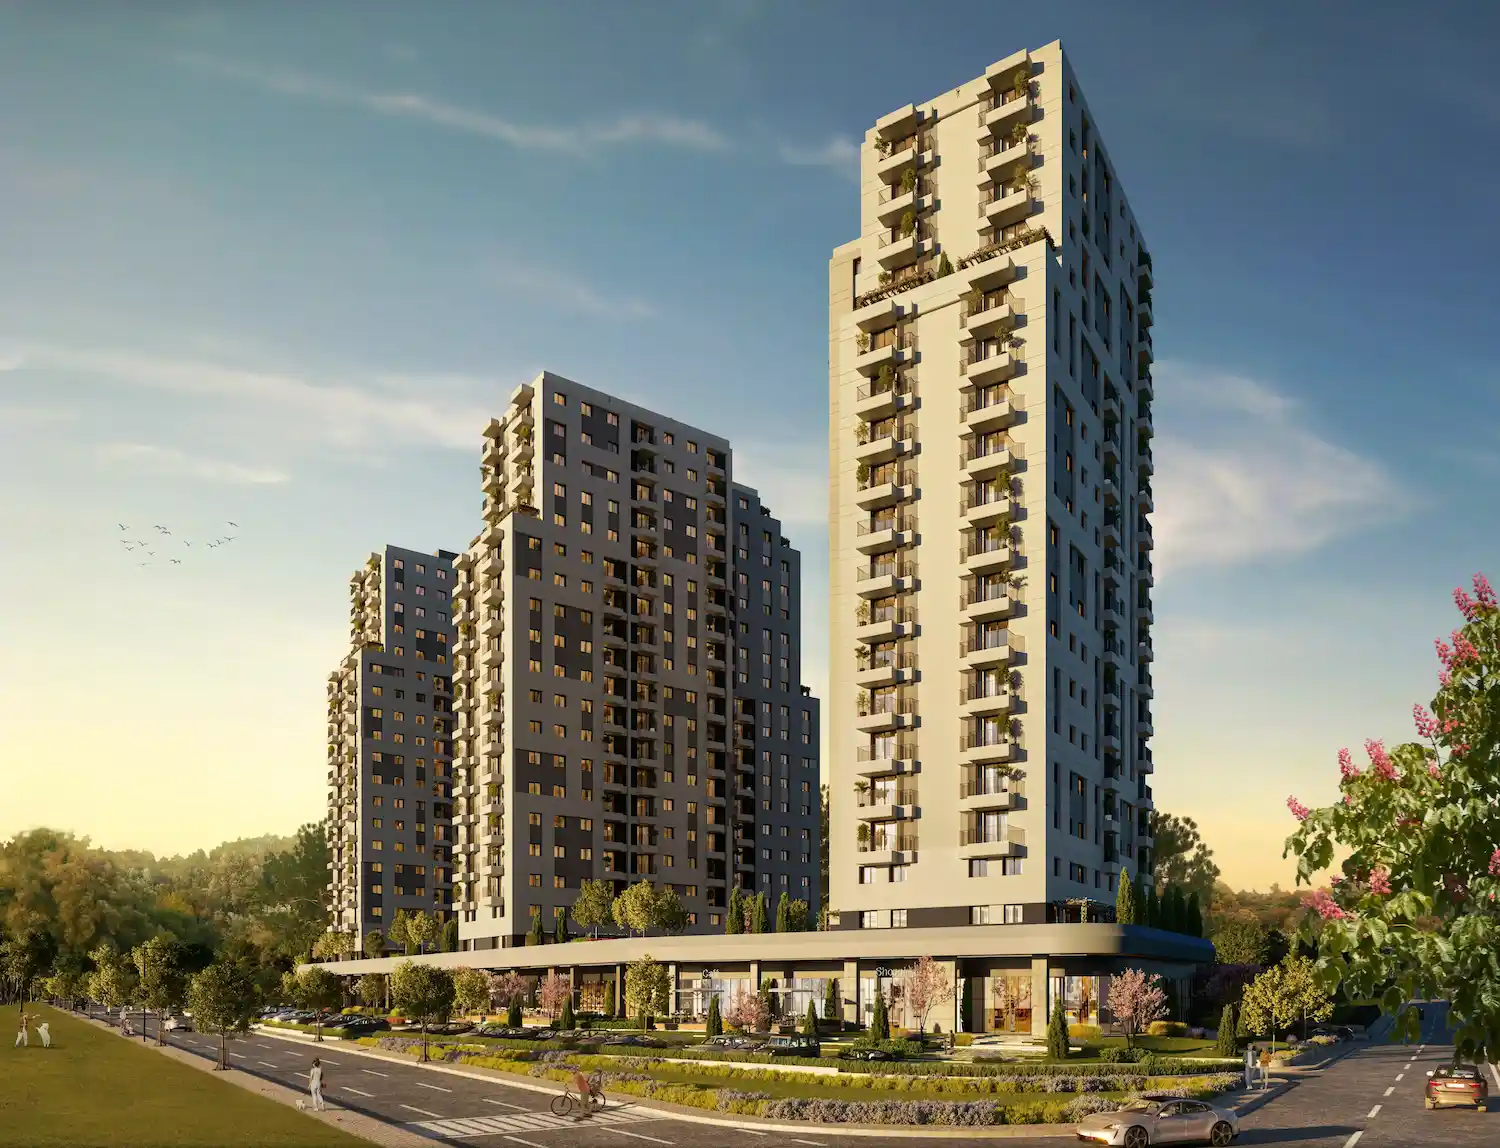
Projects Have same ROI in This Area
Have Question Or Suggestion ?
Please Share Your Thought, To Make It Real
.webp)
.webp)
