Return on Investment In Turkey
We are providing a financial metric for real estate investors as it helps them to determine the profitability of their real estate investment in Turkey
636$
Average Income
465$ - 806$
Min Income - Max Income
42,075$
Cash Price
| Year | Annual Increase | Monthly ROI | Annual ROI |
|---|---|---|---|
| 1 | 18.13 % | 636$ | 7,629$ |
| 2 | 22.67 % | 795$ | 9,537$ |
| 3 | 28.33 % | 993$ | 11,921$ |
| 4 | 35.42 % | 1,242$ | 14,901$ |
| 5 | 44.27 % | 1,552$ | 18,627$ |
| 6 | 55.34 % | 1,940$ | 23,283$ |
| 7 | 69.17 % | 2,425$ | 29,104$ |
| 8 | 86.46 % | 3,032$ | 36,380$ |
| 9 | 108.08 % | 3,790$ | 45,475$ |
| 10 | 135.10 % | 4,737$ | 56,844$ |
253,702$ 602%
Total ROI For 10 Years
806$
Max Income
42,075$
Cash Price
| Year | Annual Increase | Monthly ROI | Annual ROI |
|---|---|---|---|
| 1 | 23.00 % | 806$ | 9,676$ |
| 2 | 28.75 % | 1,008$ | 12,096$ |
| 3 | 35.93 % | 1,260$ | 15,119$ |
| 4 | 44.92 % | 1,575$ | 18,899$ |
| 5 | 56.15 % | 1,969$ | 23,624$ |
| 6 | 70.18 % | 2,461$ | 29,530$ |
| 7 | 87.73 % | 3,076$ | 36,913$ |
| 8 | 109.66 % | 3,845$ | 46,141$ |
| 9 | 137.08 % | 4,806$ | 57,676$ |
| 10 | 171.35 % | 6,008$ | 72,095$ |
321,768$ 764%
Total ROI For 10 Years
465$
Min Income
42,075$
Cash Price
| Year | Annual Increase | Monthly ROI | Annual ROI |
|---|---|---|---|
| 1 | 13.27 % | 465$ | 5,583$ |
| 2 | 16.58 % | 582$ | 6,978$ |
| 3 | 20.73 % | 727$ | 8,723$ |
| 4 | 25.91 % | 909$ | 10,903$ |
| 5 | 32.39 % | 1,136$ | 13,629$ |
| 6 | 40.49 % | 1,420$ | 17,037$ |
| 7 | 50.61 % | 1,775$ | 21,296$ |
| 8 | 63.27 % | 2,218$ | 26,620$ |
| 9 | 79.08 % | 2,773$ | 33,275$ |
| 10 | 98.85 % | 3,466$ | 41,593$ |
185,636$ 441%
Total ROI For 10 Years
District Classification
Rating
a+
Area map
Statistics
Population
323,211
Social Status
Married : 55%
Unmarried : 45%
area
5 Km2
Price Changes Over Last 5 Years
1 Year Change
13.62%
3 Year Change
425.8%
5 Year Change
448.2%
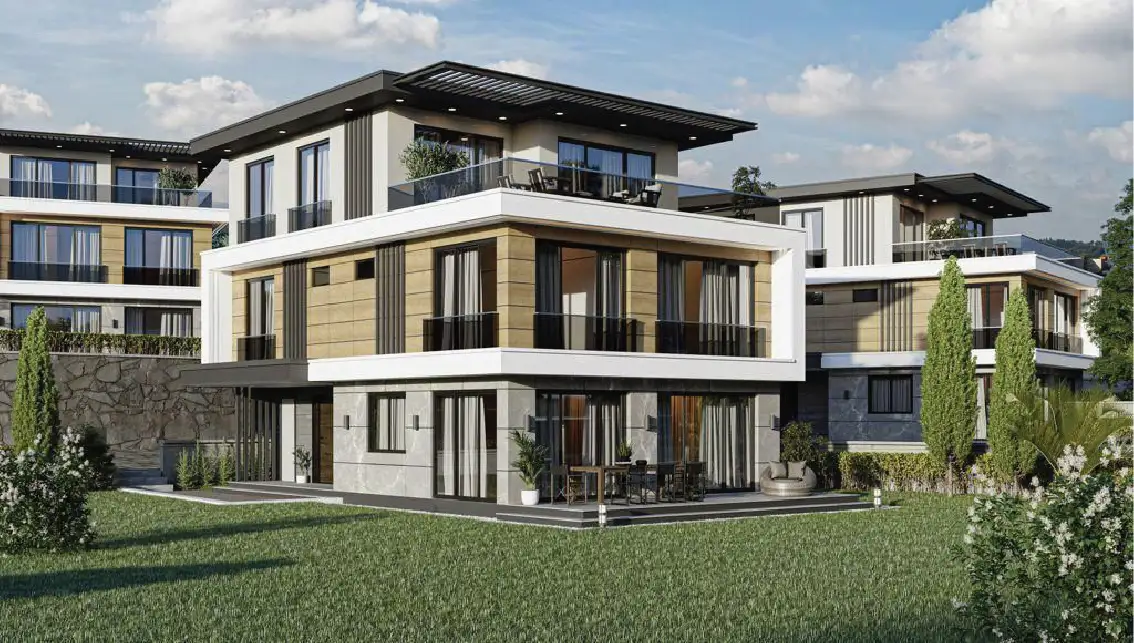
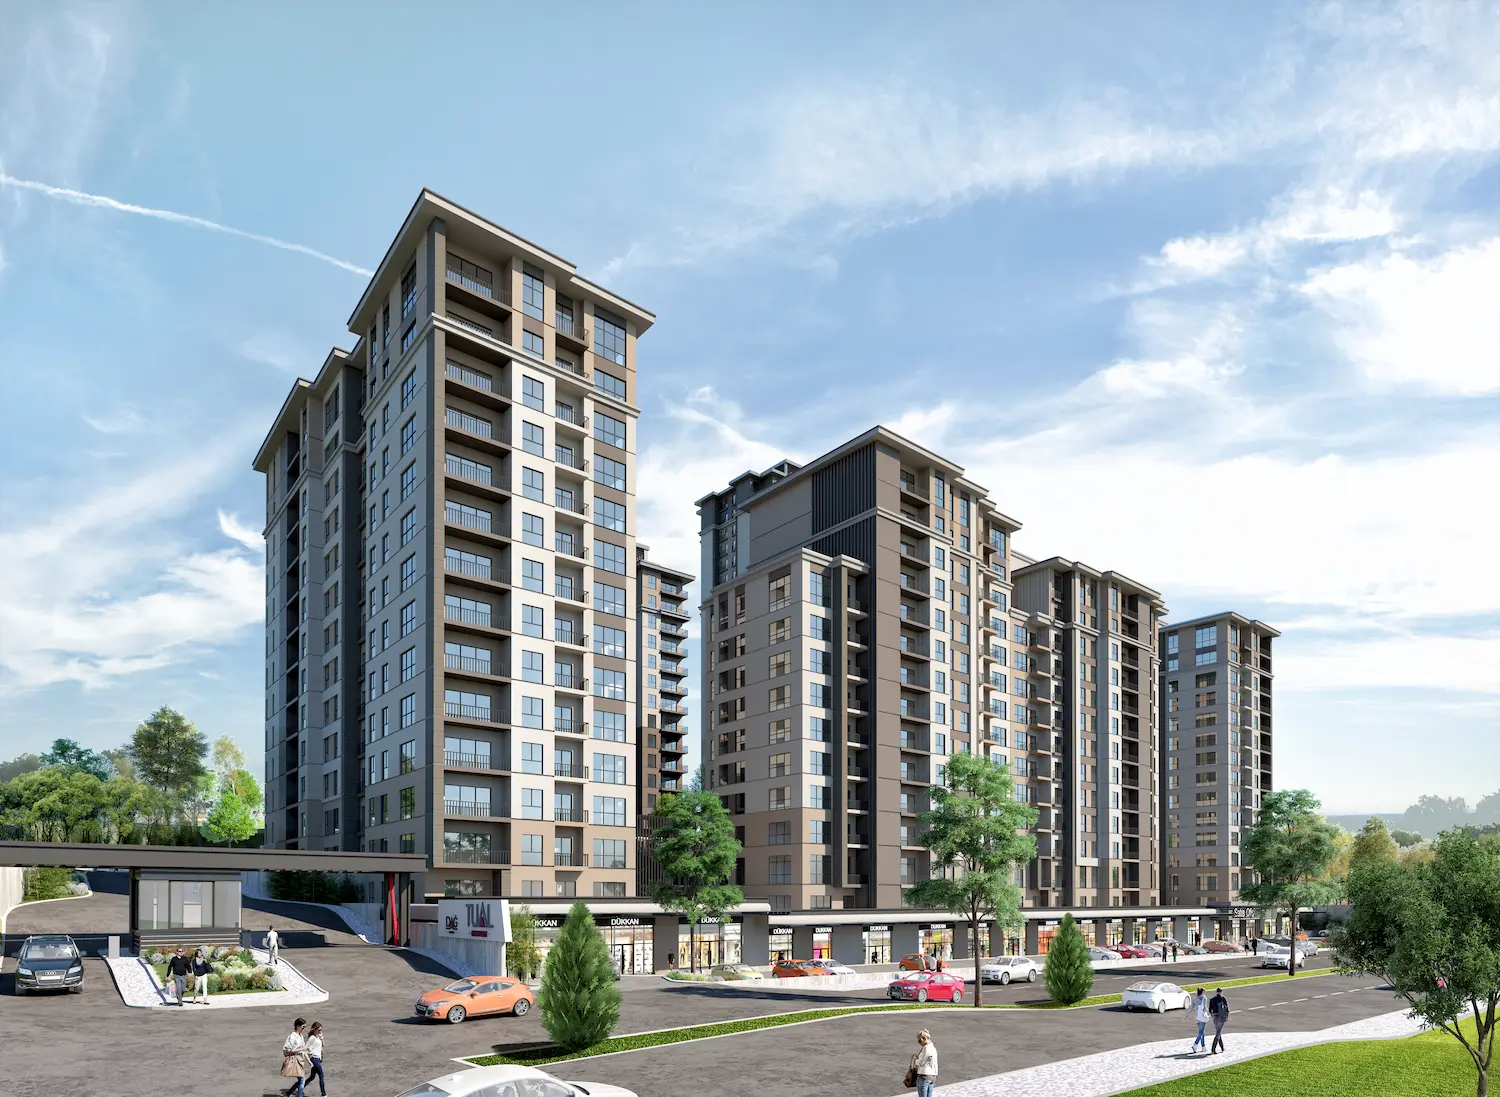
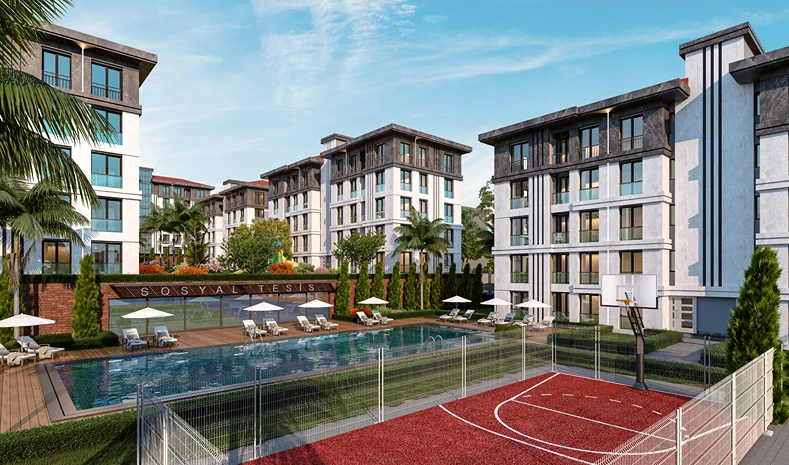
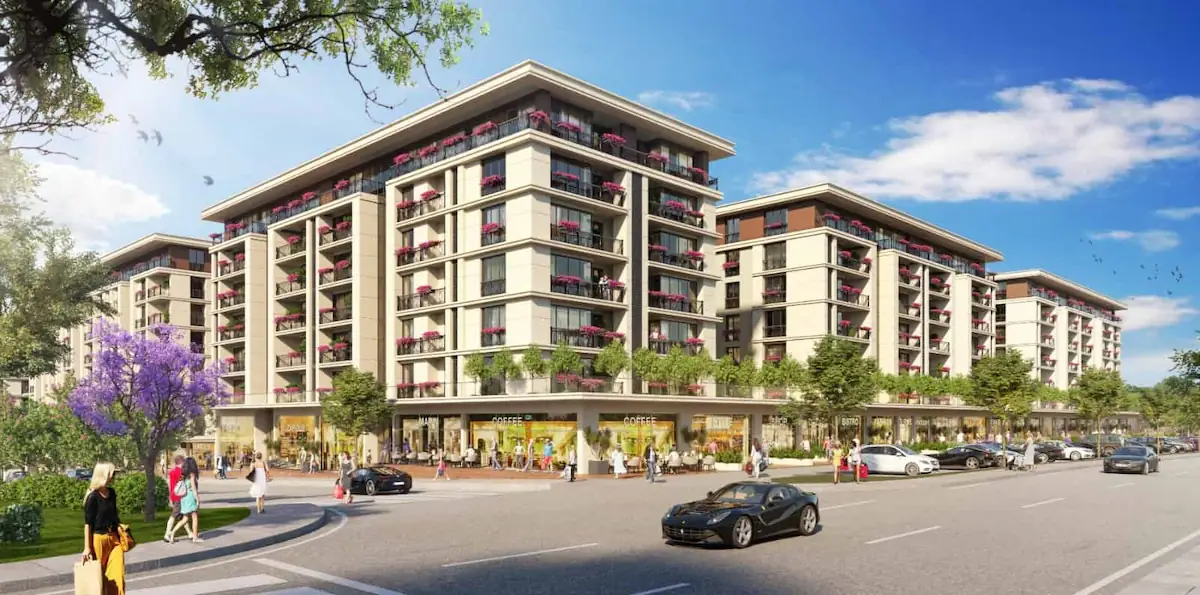
Projects Have same ROI in This Area

.webp)
.webp)

Have Question Or Suggestion ?
Please Share Your Thought, To Make It Real


