Return on Investment In Turkey
We are providing a financial metric for real estate investors as it helps them to determine the profitability of their real estate investment in Turkey
372$
Average Income
217$ - 527$
Min Income - Max Income
129,908$
Cash Price
| Year | Annual Increase | Monthly ROI | Annual ROI |
|---|---|---|---|
| 1 | 3.44 % | 372$ | 4,466$ |
| 2 | 4.30 % | 465$ | 5,583$ |
| 3 | 5.37 % | 582$ | 6,978$ |
| 4 | 6.71 % | 727$ | 8,723$ |
| 5 | 8.39 % | 909$ | 10,903$ |
| 6 | 10.49 % | 1,136$ | 13,629$ |
| 7 | 13.11 % | 1,420$ | 17,037$ |
| 8 | 16.39 % | 1,775$ | 21,296$ |
| 9 | 20.49 % | 2,218$ | 26,620$ |
| 10 | 25.61 % | 2,773$ | 33,275$ |
148,508$ 114%
Total ROI For 10 Years
527$
Max Income
129,908$
Cash Price
| Year | Annual Increase | Monthly ROI | Annual ROI |
|---|---|---|---|
| 1 | 4.87 % | 527$ | 6,327$ |
| 2 | 6.09 % | 659$ | 7,909$ |
| 3 | 7.61 % | 824$ | 9,886$ |
| 4 | 9.51 % | 1,030$ | 12,357$ |
| 5 | 11.89 % | 1,287$ | 15,446$ |
| 6 | 14.86 % | 1,609$ | 19,308$ |
| 7 | 18.58 % | 2,011$ | 24,135$ |
| 8 | 23.22 % | 2,514$ | 30,169$ |
| 9 | 29.03 % | 3,143$ | 37,711$ |
| 10 | 36.29 % | 3,928$ | 47,139$ |
210,387$ 161%
Total ROI For 10 Years
217$
Min Income
129,908$
Cash Price
| Year | Annual Increase | Monthly ROI | Annual ROI |
|---|---|---|---|
| 1 | 2.01 % | 217$ | 2,605$ |
| 2 | 2.51 % | 271$ | 3,256$ |
| 3 | 3.13 % | 339$ | 4,071$ |
| 4 | 3.92 % | 424$ | 5,088$ |
| 5 | 4.90 % | 530$ | 6,360$ |
| 6 | 6.12 % | 663$ | 7,950$ |
| 7 | 7.65 % | 828$ | 9,938$ |
| 8 | 9.56 % | 1,035$ | 12,422$ |
| 9 | 11.95 % | 1,294$ | 15,528$ |
| 10 | 14.94 % | 1,618$ | 19,410$ |
86,630$ 66%
Total ROI For 10 Years
District Classification
Rating
b+
Area map
Statistics
Population
846,000
Social Status
Married : 53%
Unmarried : 47%
area
42 Km2
Price Changes Over Last 5 Years
1 Year Change
13.27%
3 Year Change
255.2%
5 Year Change
315.6%
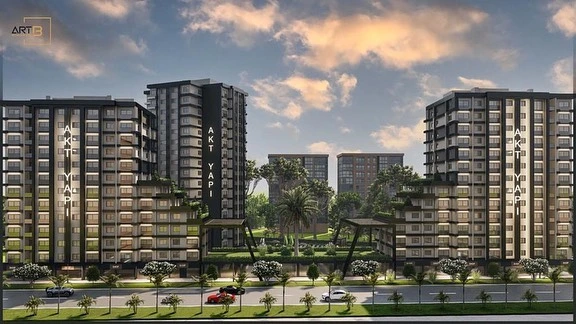
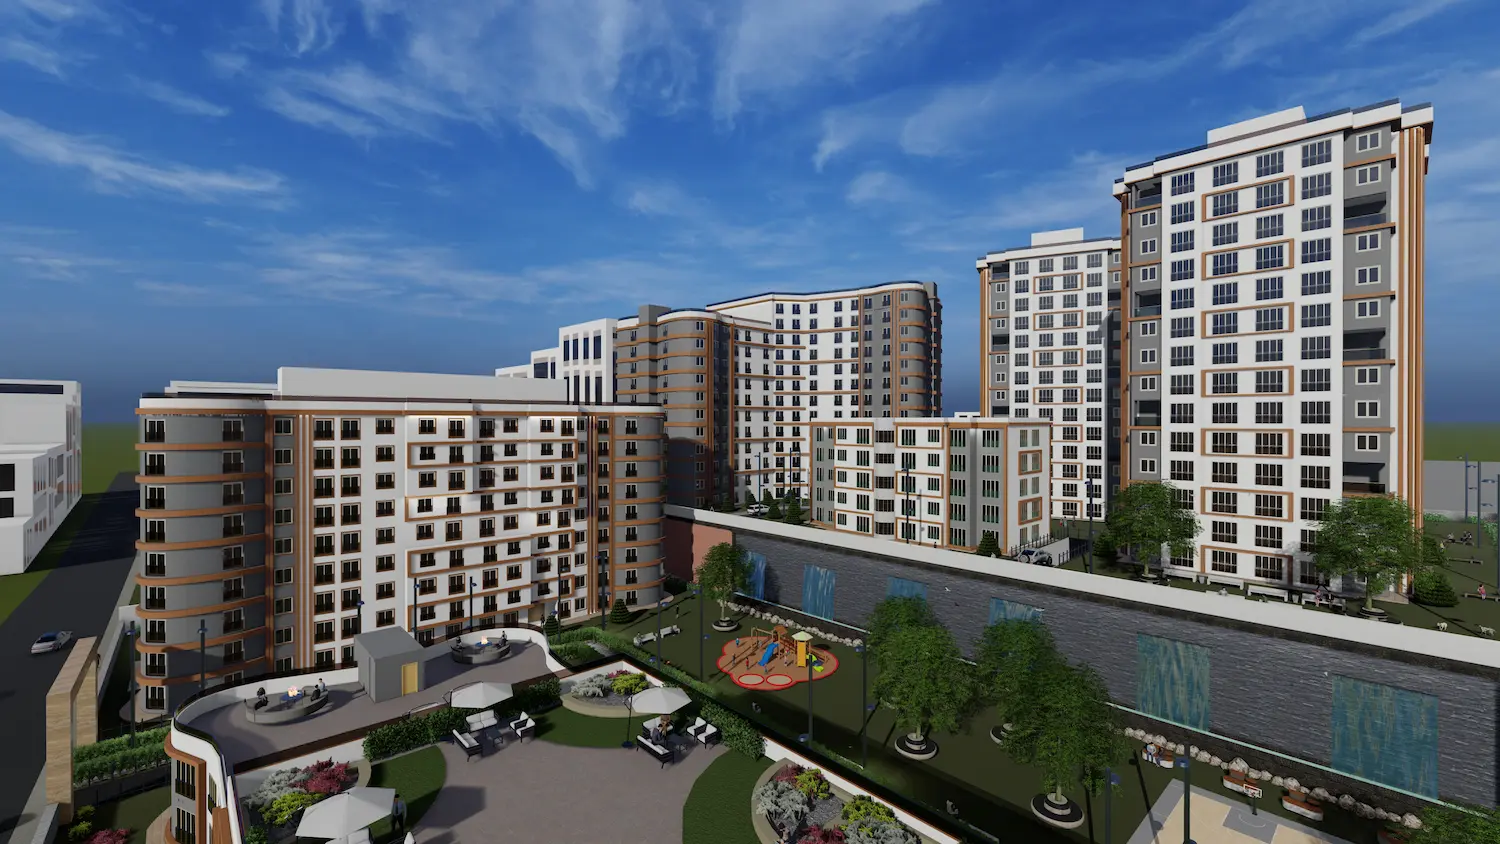
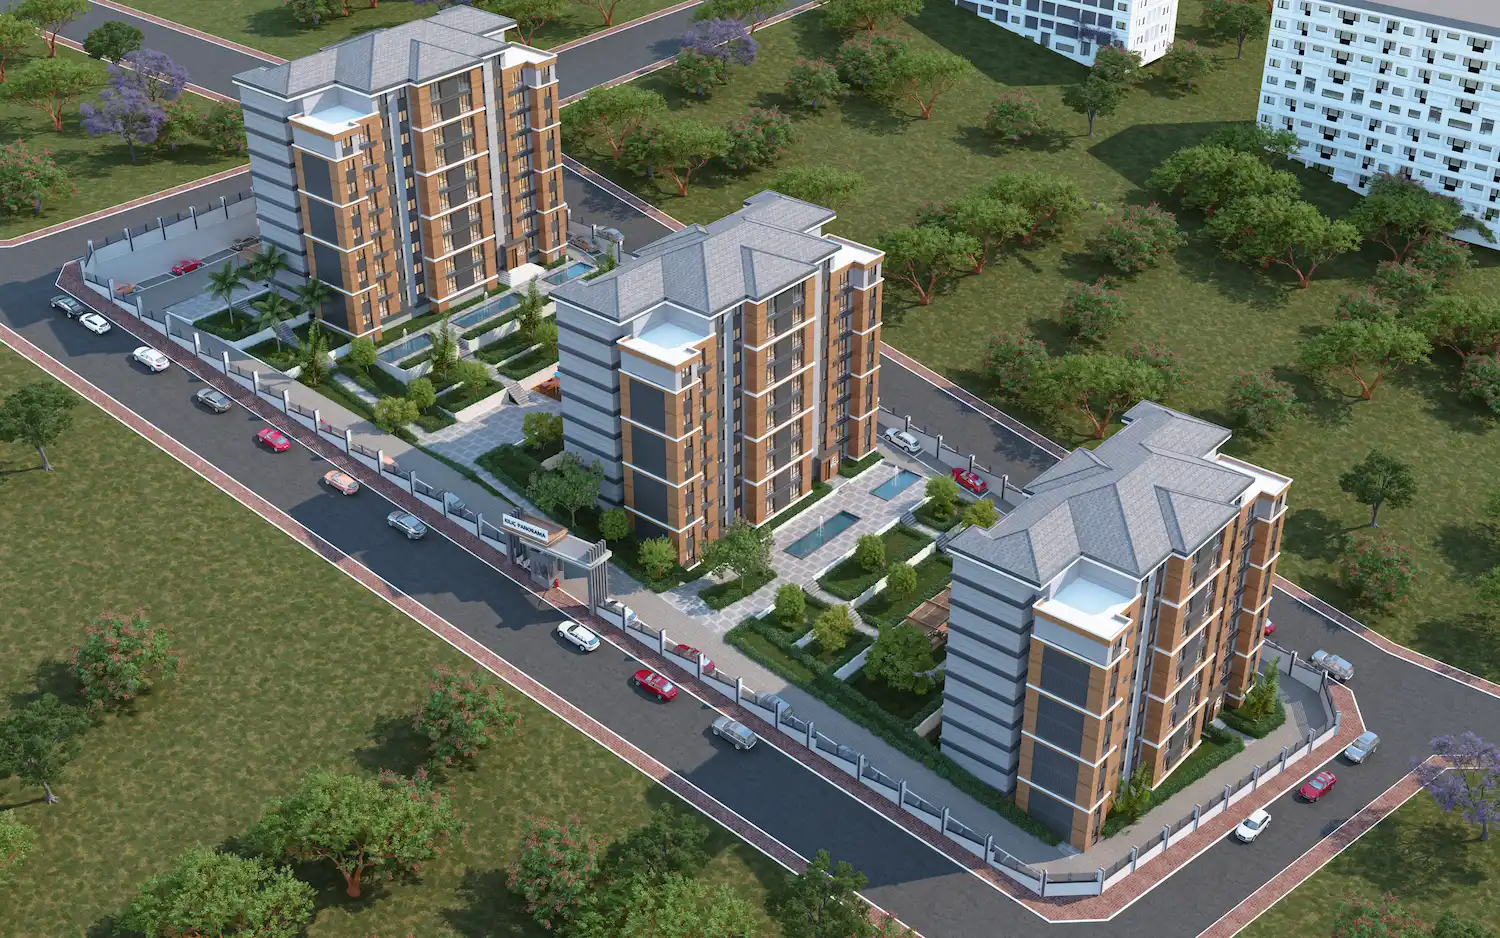
Projects Have same ROI in This Area
.webp)
.webp)


.webp)
Have Question Or Suggestion ?
Please Share Your Thought, To Make It Real


