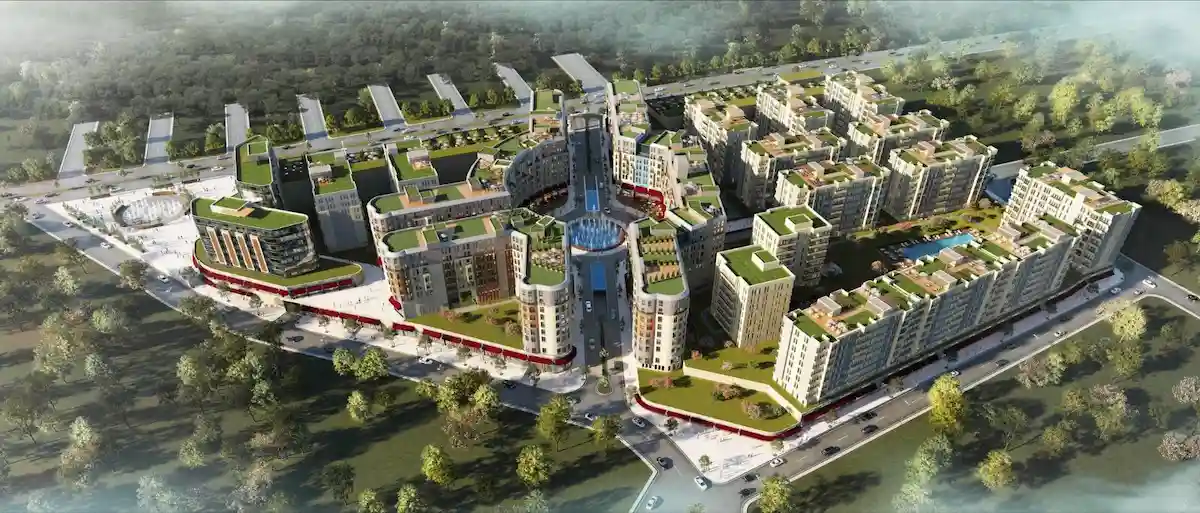
Return on Investment In Turkey
We are providing a financial metric for real estate investors as it helps them to determine the profitability of their real estate investment in Turkey
371$
Average Income
216$ - 525$
Min Income - Max Income
89,300$
Cash Price
| Year | Annual Increase | Monthly ROI | Annual ROI |
|---|---|---|---|
| 1 | 4.98 % | 371$ | 4,448$ |
| 2 | 6.23 % | 463$ | 5,560$ |
| 3 | 7.78 % | 579$ | 6,950$ |
| 4 | 9.73 % | 724$ | 8,687$ |
| 5 | 12.16 % | 905$ | 10,859$ |
| 6 | 15.20 % | 1,131$ | 13,574$ |
| 7 | 19.00 % | 1,414$ | 16,968$ |
| 8 | 23.75 % | 1,767$ | 21,210$ |
| 9 | 29.69 % | 2,209$ | 26,512$ |
| 10 | 37.11 % | 2,762$ | 33,140$ |
147,908$ 165%
Total ROI For 10 Years
525$
Max Income
89,300$
Cash Price
| Year | Annual Increase | Monthly ROI | Annual ROI |
|---|---|---|---|
| 1 | 7.06 % | 525$ | 6,301$ |
| 2 | 8.82 % | 656$ | 7,877$ |
| 3 | 11.03 % | 820$ | 9,846$ |
| 4 | 13.78 % | 1,026$ | 12,307$ |
| 5 | 17.23 % | 1,282$ | 15,384$ |
| 6 | 21.53 % | 1,603$ | 19,230$ |
| 7 | 26.92 % | 2,003$ | 24,038$ |
| 8 | 33.65 % | 2,504$ | 30,047$ |
| 9 | 42.06 % | 3,130$ | 37,559$ |
| 10 | 52.57 % | 3,912$ | 46,948$ |
209,537$ 234%
Total ROI For 10 Years
216$
Min Income
89,300$
Cash Price
| Year | Annual Increase | Monthly ROI | Annual ROI |
|---|---|---|---|
| 1 | 2.91 % | 216$ | 2,595$ |
| 2 | 3.63 % | 270$ | 3,243$ |
| 3 | 4.54 % | 338$ | 4,054$ |
| 4 | 5.67 % | 422$ | 5,068$ |
| 5 | 7.09 % | 528$ | 6,335$ |
| 6 | 8.87 % | 660$ | 7,918$ |
| 7 | 11.08 % | 825$ | 9,898$ |
| 8 | 13.85 % | 1,031$ | 12,372$ |
| 9 | 17.32 % | 1,289$ | 15,465$ |
| 10 | 21.65 % | 1,611$ | 19,332$ |
86,280$ 96%
Total ROI For 10 Years
District Classification
Rating
b+
Area map
Statistics
Population
846,000
Social Status
Married : 53%
Unmarried : 47%
area
42 Km2
Price Changes Over Last 5 Years
1 Year Change
13.27%
3 Year Change
255.2%
5 Year Change
315.6%
Projects Have same ROI in This Area
Have Question Or Suggestion ?
Please Share Your Thought, To Make It Real
.webp)
.webp)
.webp)
