Return on Investment In Turkey
We are providing a financial metric for real estate investors as it helps them to determine the profitability of their real estate investment in Turkey
835$
Average Income
525$ - 1,144$
Min Income - Max Income
123,044$
Cash Price
| Year | Annual Increase | Monthly ROI | Annual ROI |
|---|---|---|---|
| 1 | 8.14 % | 835$ | 10,014$ |
| 2 | 10.17 % | 1,043$ | 12,518$ |
| 3 | 12.72 % | 1,304$ | 15,647$ |
| 4 | 15.90 % | 1,630$ | 19,559$ |
| 5 | 19.87 % | 2,037$ | 24,449$ |
| 6 | 24.84 % | 2,547$ | 30,561$ |
| 7 | 31.05 % | 3,183$ | 38,202$ |
| 8 | 38.81 % | 3,979$ | 47,752$ |
| 9 | 48.51 % | 4,974$ | 59,690$ |
| 10 | 60.64 % | 6,218$ | 74,612$ |
333,005$ 270%
Total ROI For 10 Years
1,144$
Max Income
123,044$
Cash Price
| Year | Annual Increase | Monthly ROI | Annual ROI |
|---|---|---|---|
| 1 | 11.15 % | 1,144$ | 13,723$ |
| 2 | 13.94 % | 1,430$ | 17,154$ |
| 3 | 17.43 % | 1,787$ | 21,443$ |
| 4 | 21.78 % | 2,234$ | 26,803$ |
| 5 | 27.23 % | 2,792$ | 33,504$ |
| 6 | 34.04 % | 3,490$ | 41,880$ |
| 7 | 42.55 % | 4,363$ | 52,350$ |
| 8 | 53.18 % | 5,453$ | 65,438$ |
| 9 | 66.48 % | 6,816$ | 81,797$ |
| 10 | 83.10 % | 8,521$ | 102,247$ |
456,340$ 370%
Total ROI For 10 Years
525$
Min Income
123,044$
Cash Price
| Year | Annual Increase | Monthly ROI | Annual ROI |
|---|---|---|---|
| 1 | 5.12 % | 525$ | 6,305$ |
| 2 | 6.41 % | 657$ | 7,882$ |
| 3 | 8.01 % | 821$ | 9,852$ |
| 4 | 10.01 % | 1,026$ | 12,315$ |
| 5 | 12.51 % | 1,283$ | 15,394$ |
| 6 | 15.64 % | 1,604$ | 19,242$ |
| 7 | 19.55 % | 2,004$ | 24,053$ |
| 8 | 24.44 % | 2,506$ | 30,066$ |
| 9 | 30.54 % | 3,132$ | 37,583$ |
| 10 | 38.18 % | 3,915$ | 46,978$ |
209,670$ 170%
Total ROI For 10 Years
District Classification
Rating
b+
Area map
Statistics
Population
381,110
Social Status
Married : 67%
Unmarried : 26%
area
230 Km2
Price Changes Over Last 5 Years
1 Year Change
17.79%
3 Year Change
202%
5 Year Change
253%
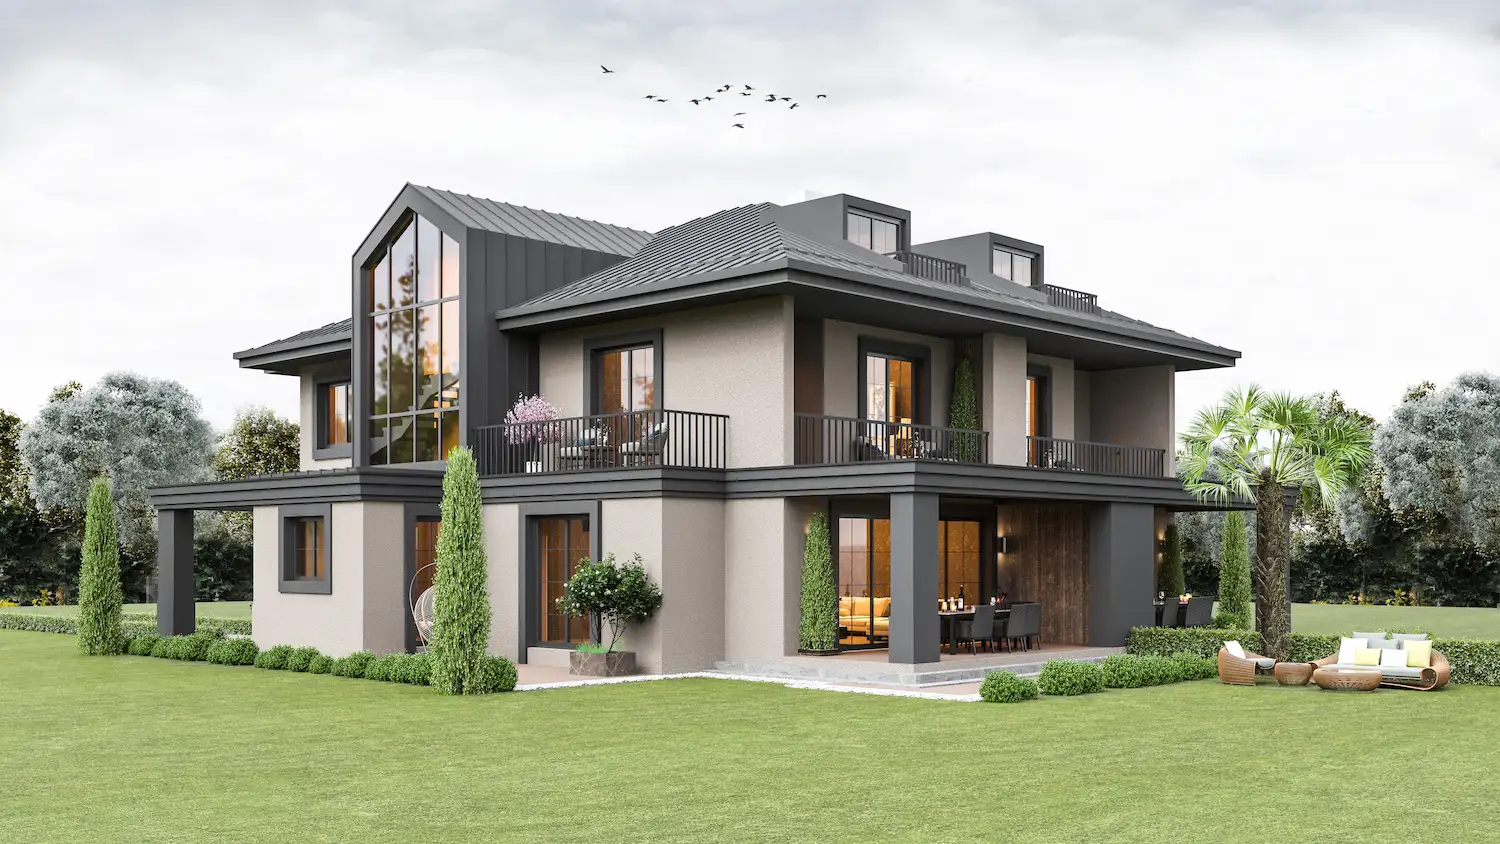
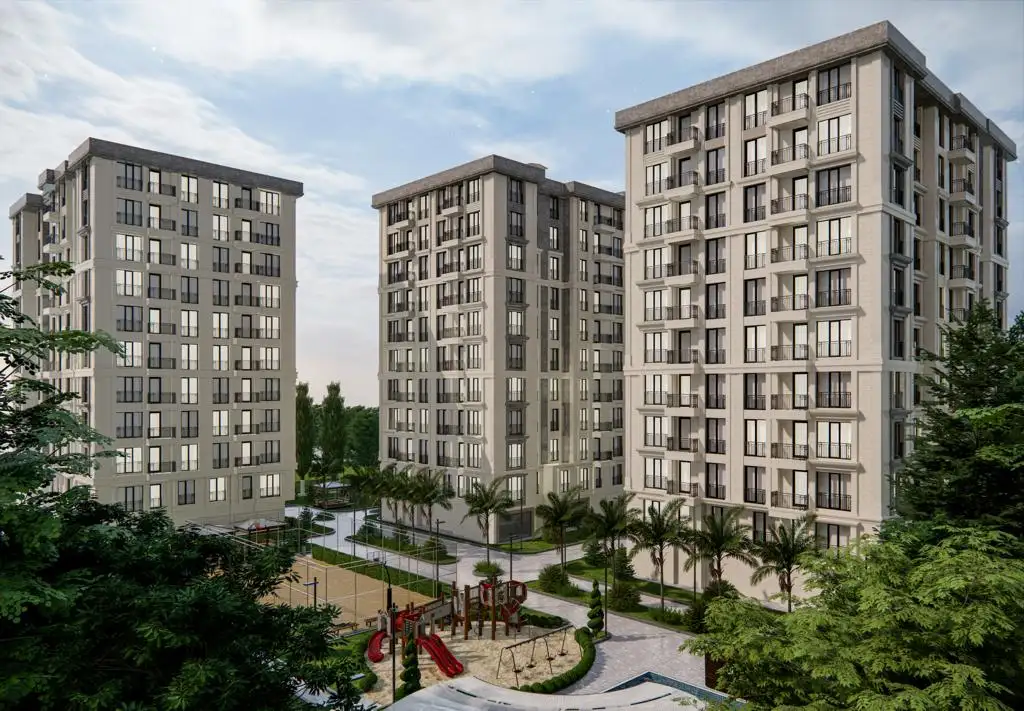
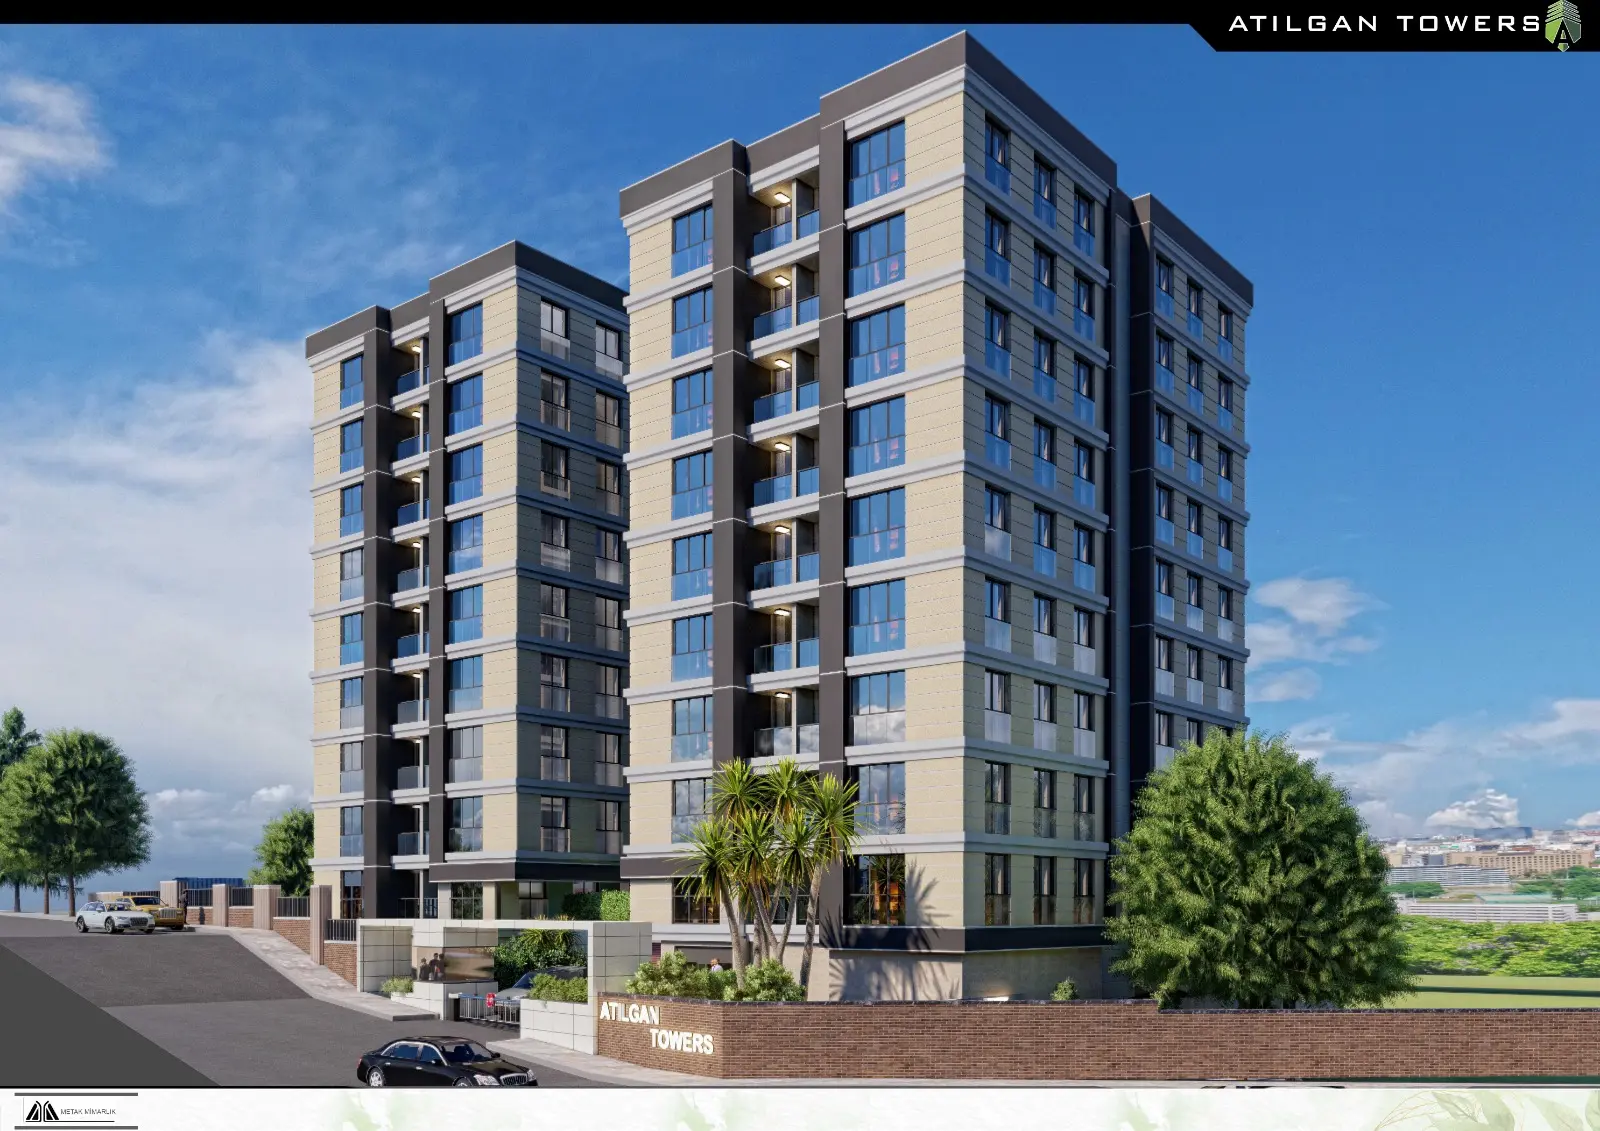
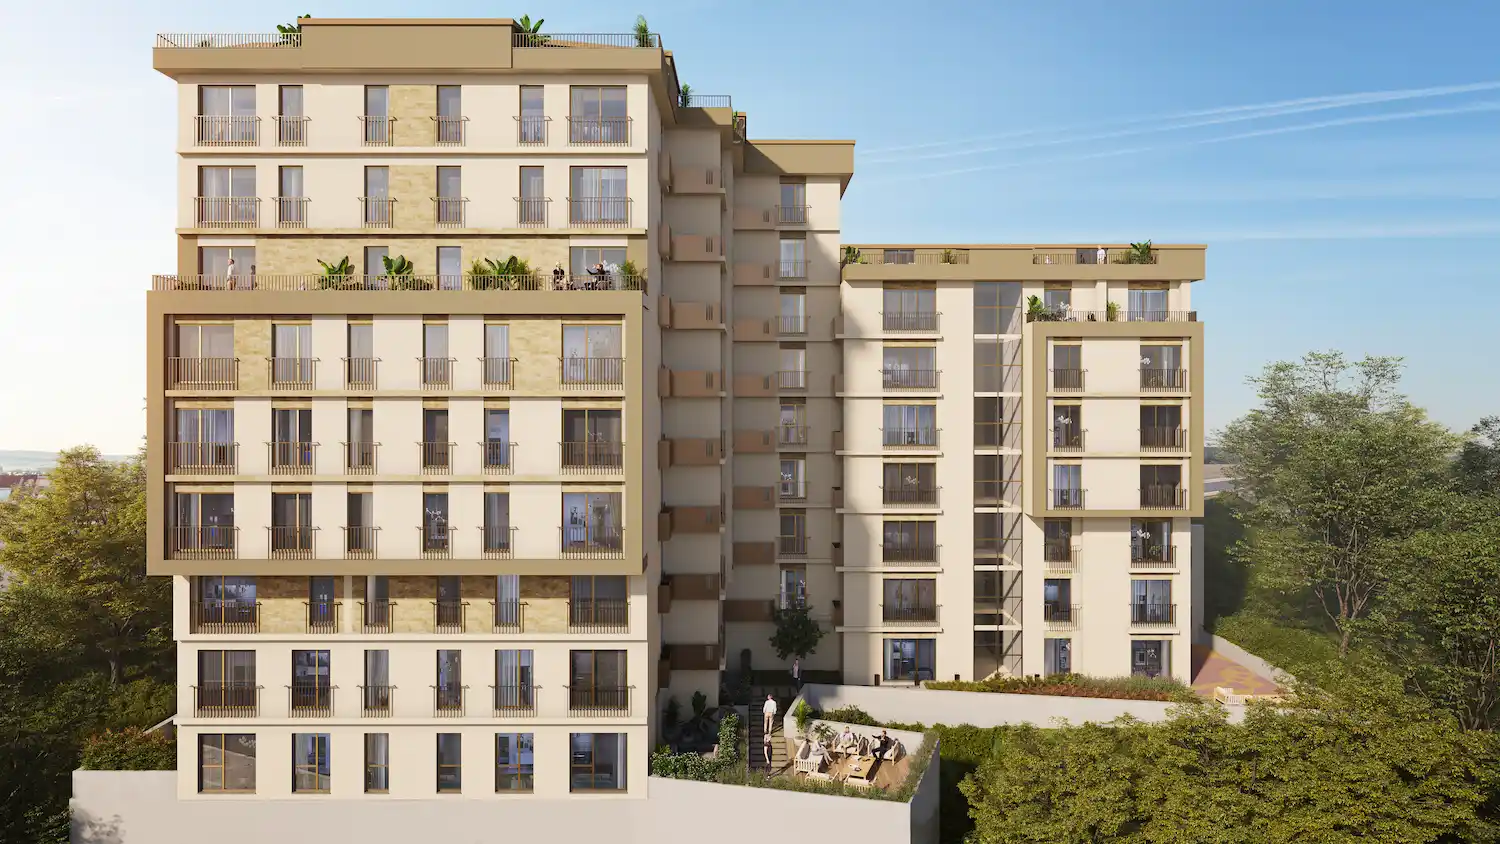
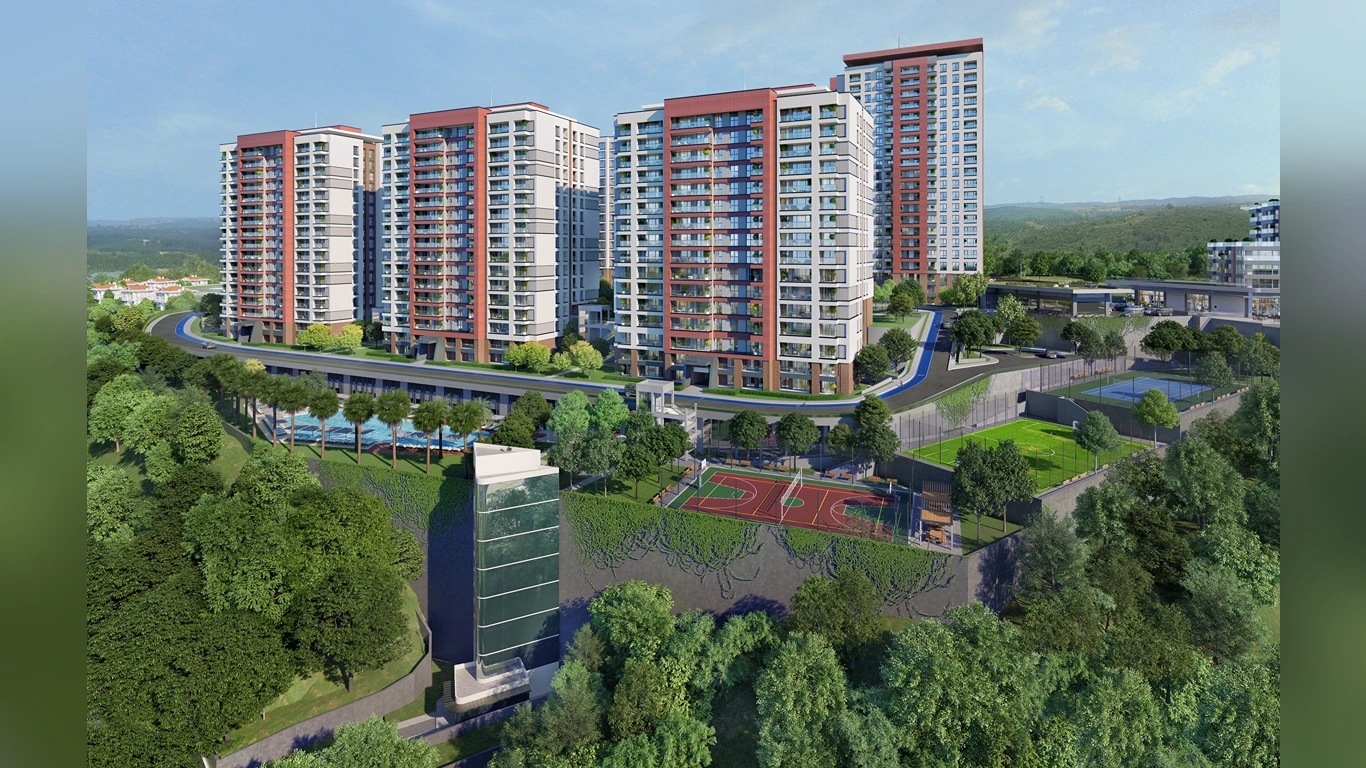
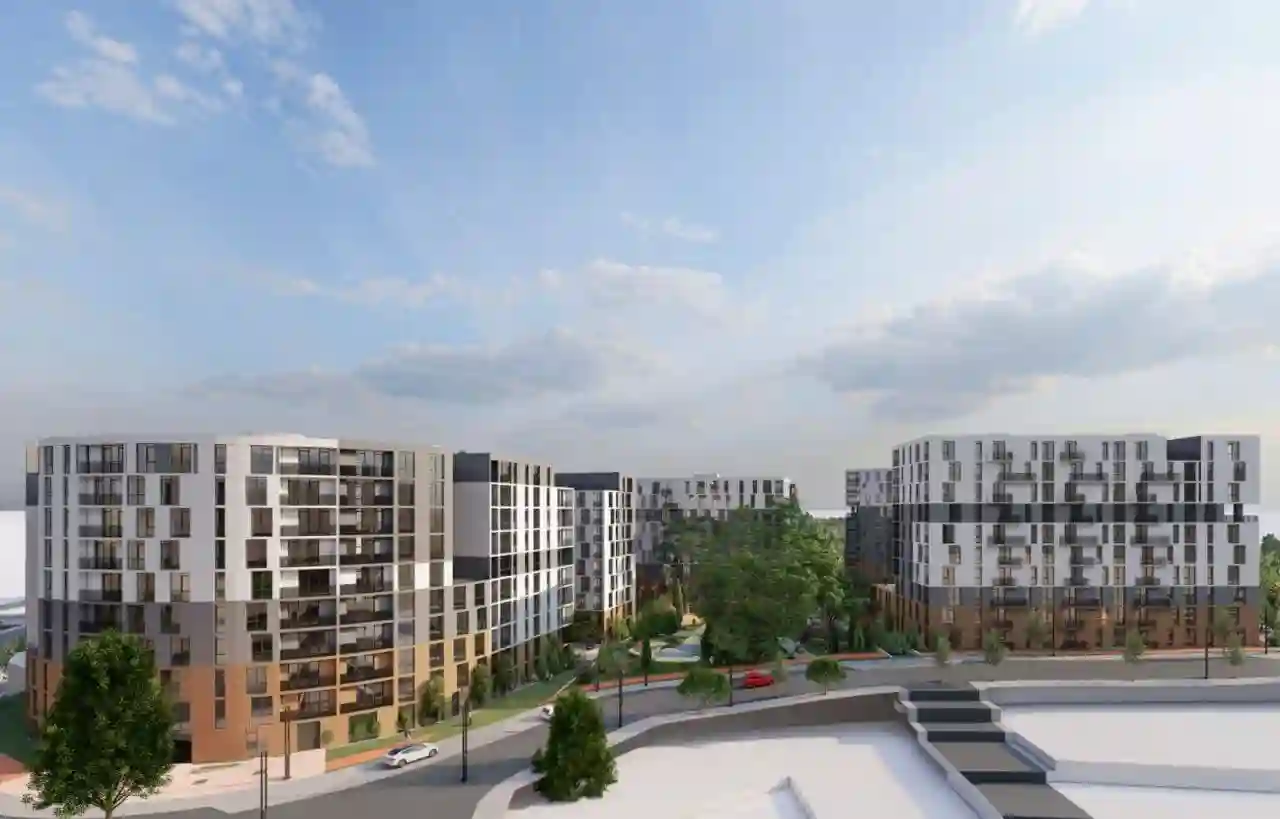
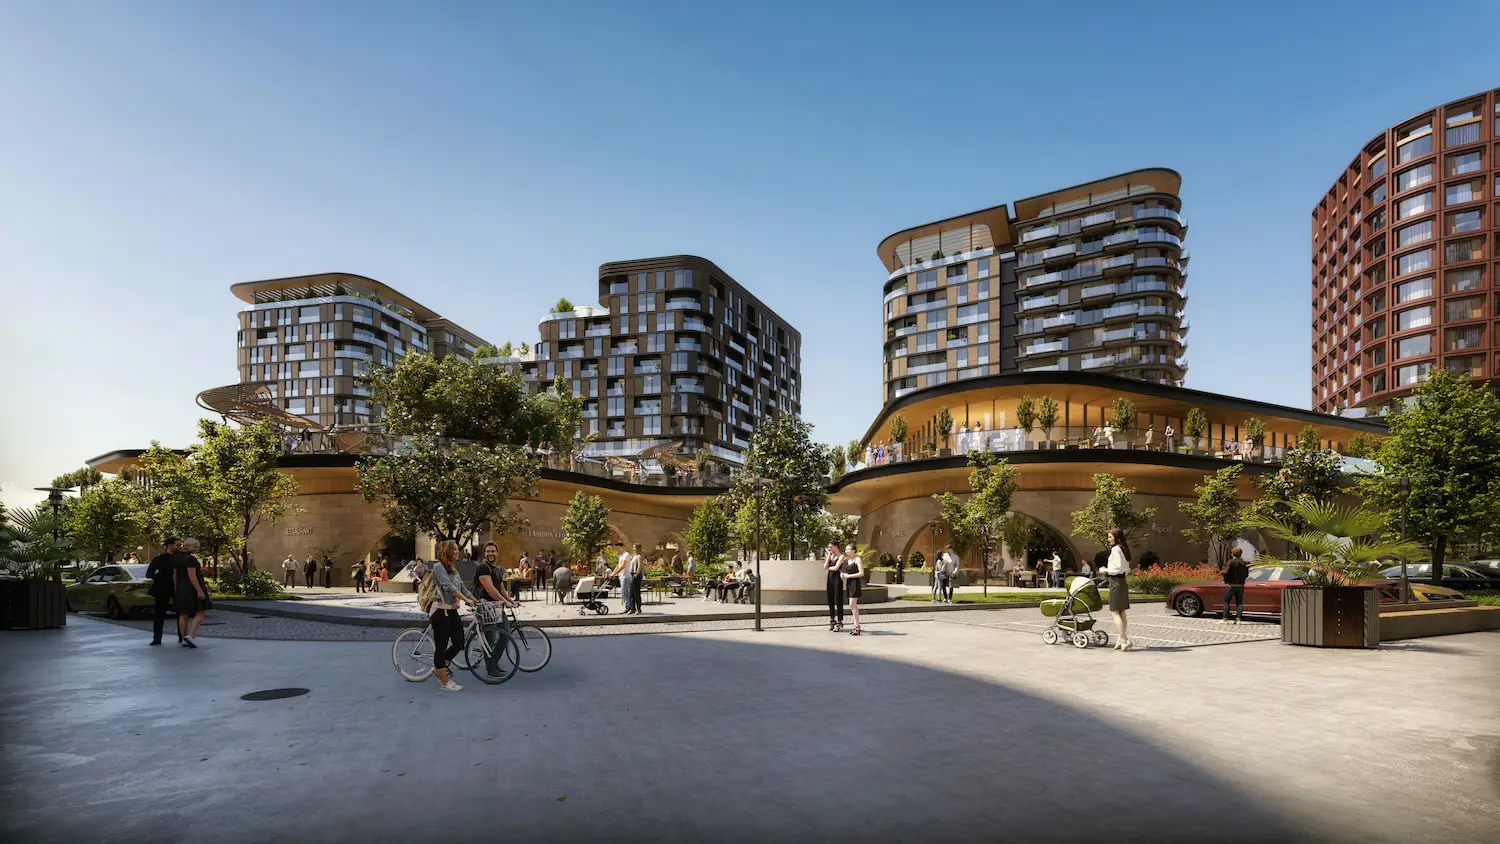
Projects Have same ROI in This Area

.webp)


Have Question Or Suggestion ?
Please Share Your Thought, To Make It Real


