Return on Investment In Turkey
We are providing a financial metric for real estate investors as it helps them to determine the profitability of their real estate investment in Turkey
776€
Average Income
489€ - 1,063€
Min Income - Max Income
208,503€
Cash Price
| Year | Annual Increase | Monthly ROI | Annual ROI |
|---|---|---|---|
| 1 | 4.47 % | 776€ | 9,312€ |
| 2 | 5.58 % | 970€ | 11,641€ |
| 3 | 6.98 % | 1,213€ | 14,551€ |
| 4 | 8.72 % | 1,516€ | 18,188€ |
| 5 | 10.90 % | 1,895€ | 22,735€ |
| 6 | 13.63 % | 2,368€ | 28,419€ |
| 7 | 17.04 % | 2,960€ | 35,524€ |
| 8 | 21.30 % | 3,700€ | 44,405€ |
| 9 | 26.62 % | 4,626€ | 55,507€ |
| 10 | 33.28 % | 5,782€ | 69,383€ |
309,666€ 148%
Total ROI For 10 Years
1,063€
Max Income
208,503€
Cash Price
| Year | Annual Increase | Monthly ROI | Annual ROI |
|---|---|---|---|
| 1 | 6.12 % | 1,063€ | 12,762€ |
| 2 | 7.65 % | 1,329€ | 15,952€ |
| 3 | 9.56 % | 1,662€ | 19,940€ |
| 4 | 11.95 % | 2,077€ | 24,925€ |
| 5 | 14.94 % | 2,596€ | 31,156€ |
| 6 | 18.68 % | 3,245€ | 38,945€ |
| 7 | 23.35 % | 4,057€ | 48,681€ |
| 8 | 29.18 % | 5,071€ | 60,852€ |
| 9 | 36.48 % | 6,339€ | 76,064€ |
| 10 | 45.60 % | 7,923€ | 95,081€ |
424,357€ 203%
Total ROI For 10 Years
489€
Min Income
208,503€
Cash Price
| Year | Annual Increase | Monthly ROI | Annual ROI |
|---|---|---|---|
| 1 | 2.81 % | 489€ | 5,863€ |
| 2 | 3.52 % | 611€ | 7,329€ |
| 3 | 4.39 % | 763€ | 9,162€ |
| 4 | 5.49 % | 954€ | 11,452€ |
| 5 | 6.87 % | 1,193€ | 14,315€ |
| 6 | 8.58 % | 1,491€ | 17,894€ |
| 7 | 10.73 % | 1,864€ | 22,367€ |
| 8 | 13.41 % | 2,330€ | 27,959€ |
| 9 | 16.76 % | 2,912€ | 34,949€ |
| 10 | 20.95 % | 3,640€ | 43,686€ |
194,975€ 93%
Total ROI For 10 Years
District Classification
Rating
b+
Area map
Statistics
Population
381,110
Social Status
Married : 67%
Unmarried : 26%
area
230 Km2
Price Changes Over Last 5 Years
1 Year Change
17.79%
3 Year Change
202%
5 Year Change
253%
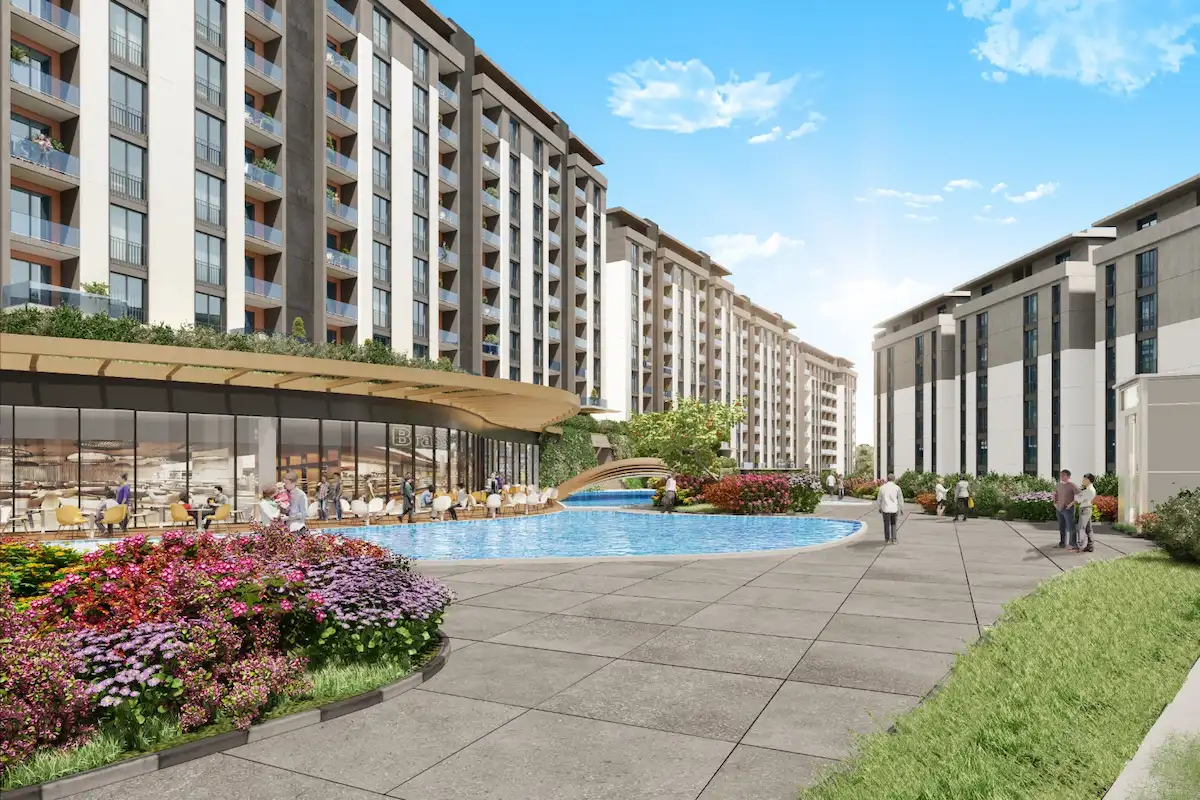
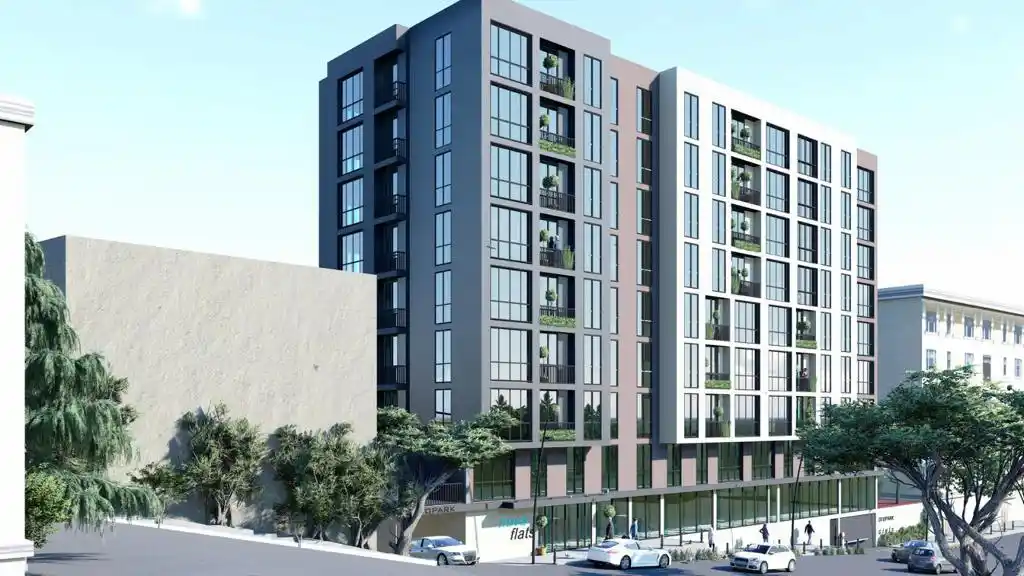
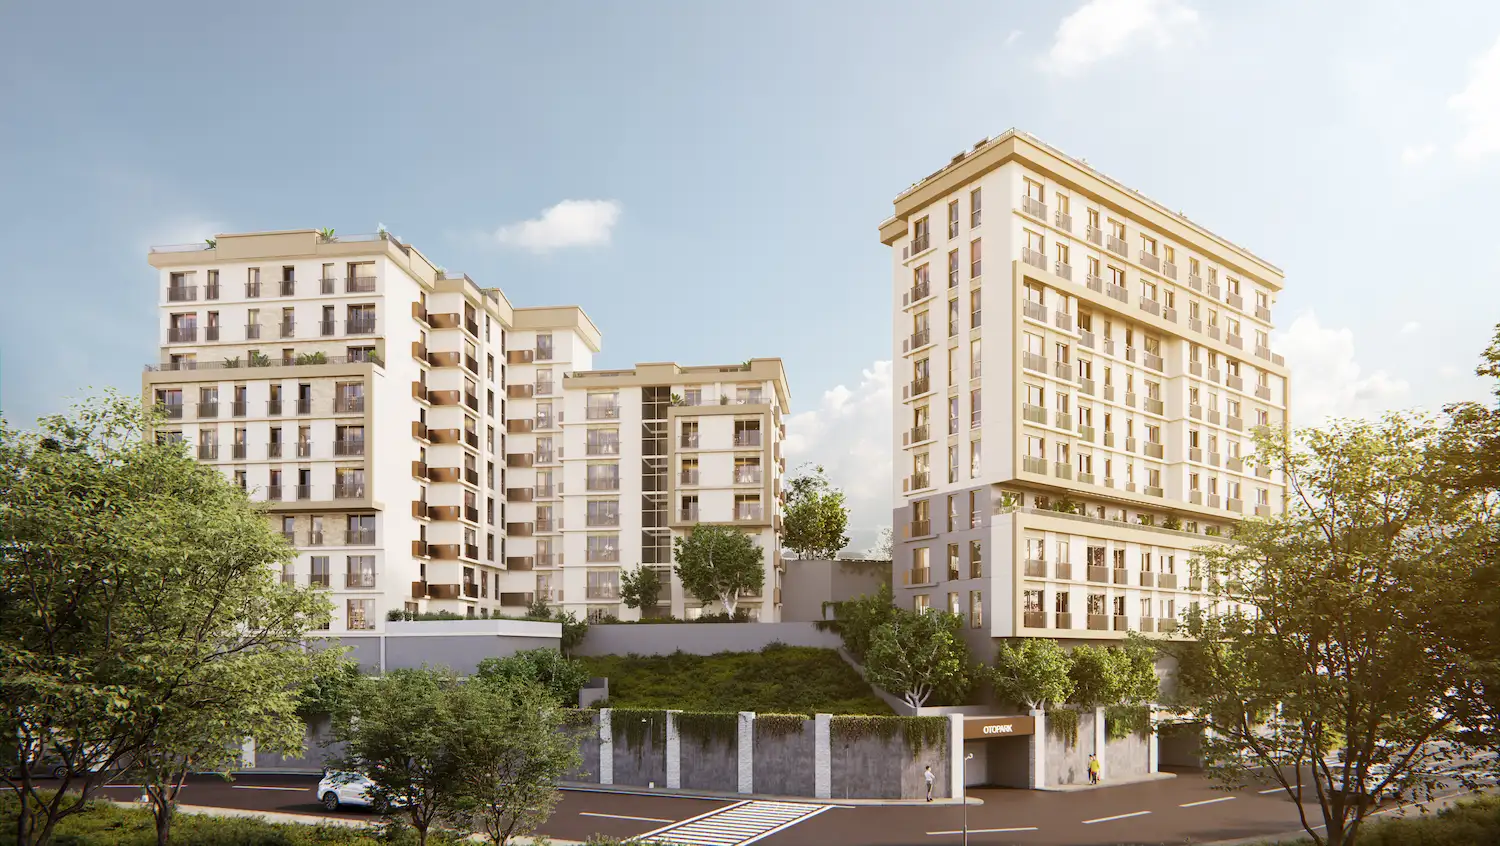
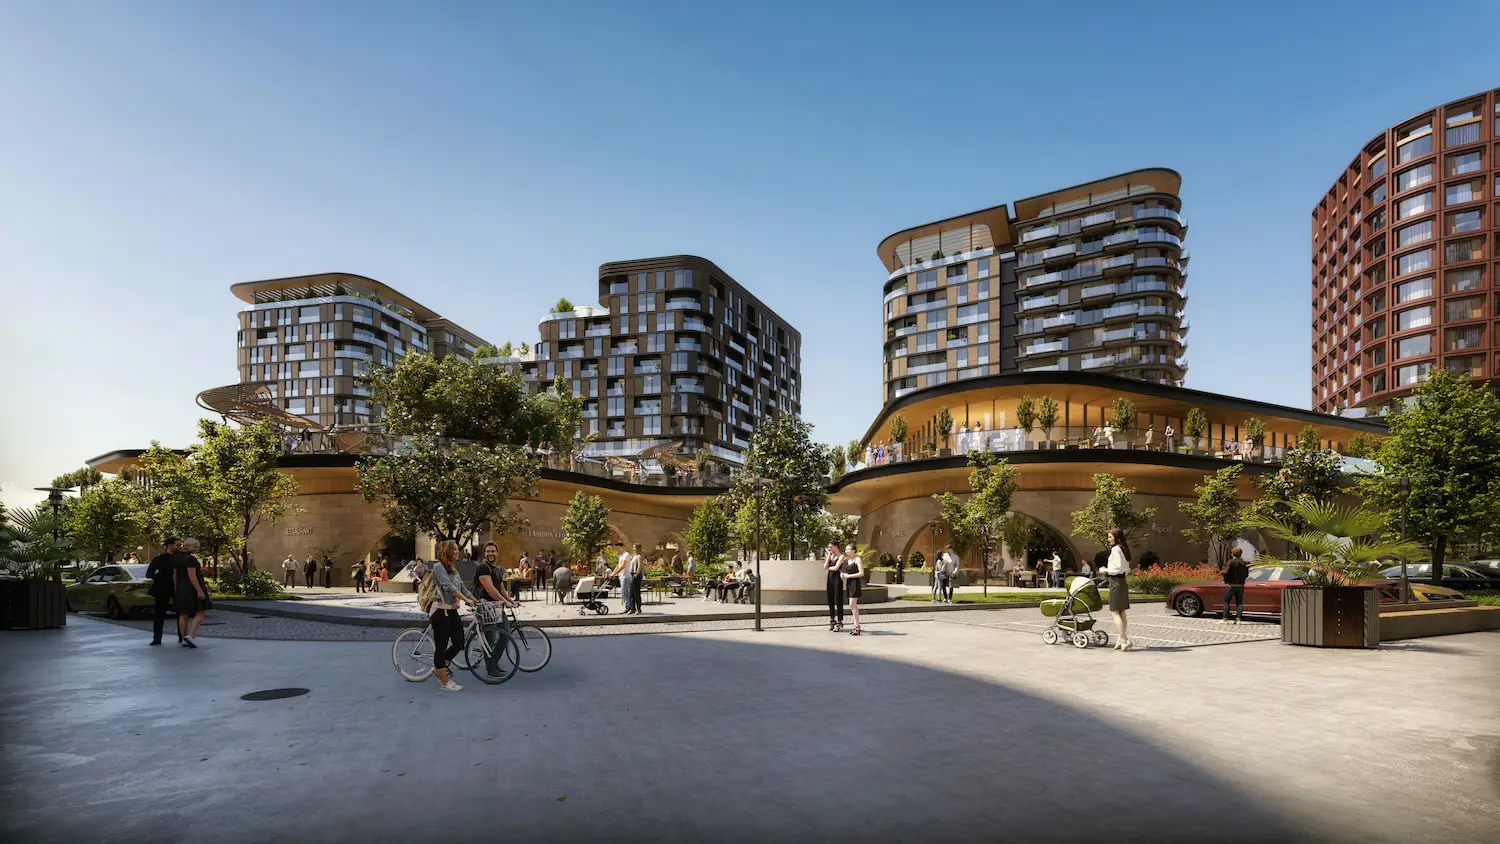
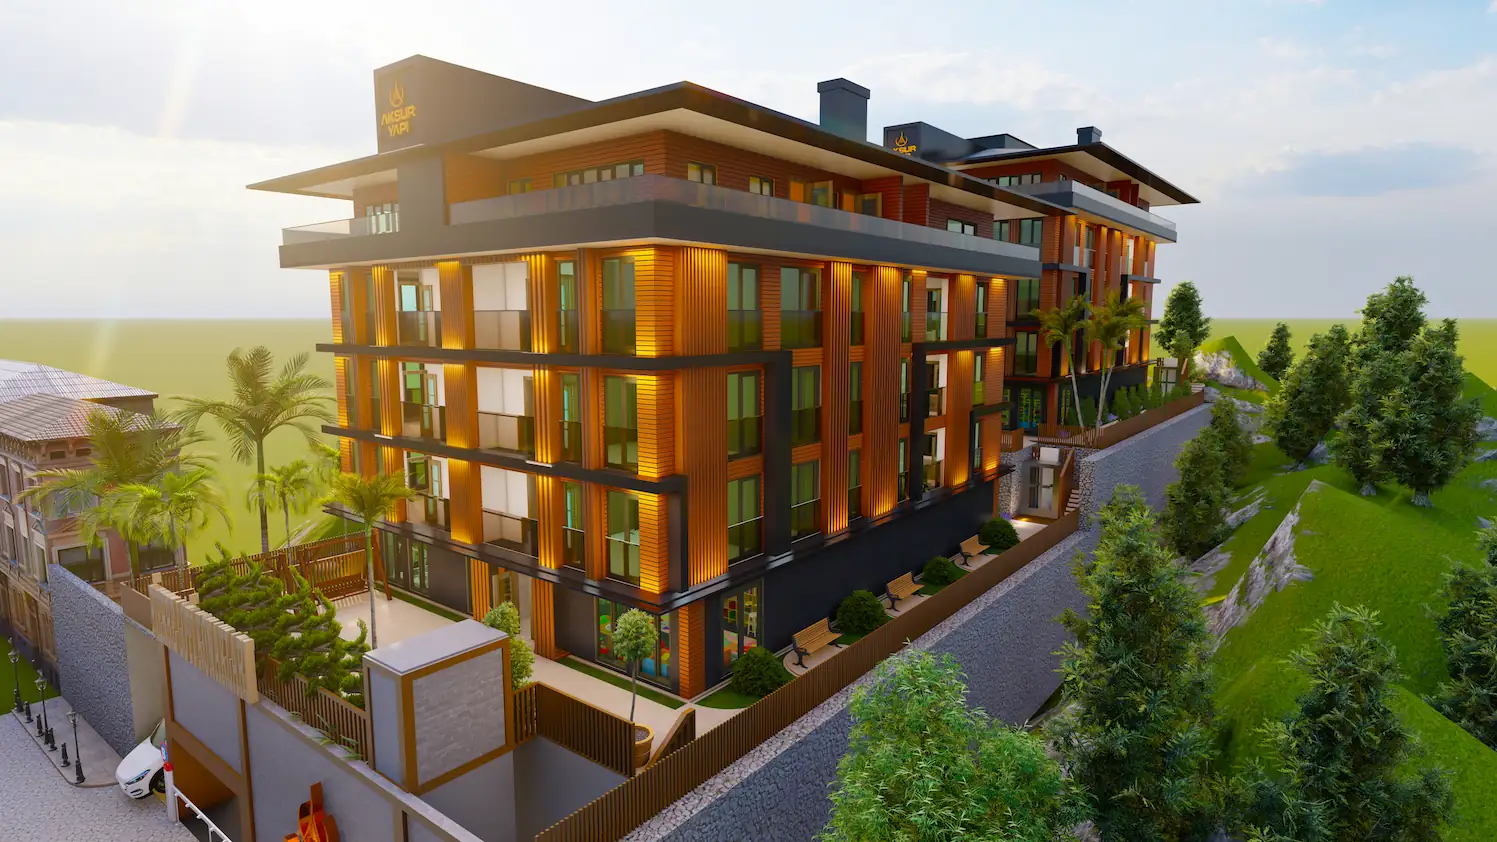
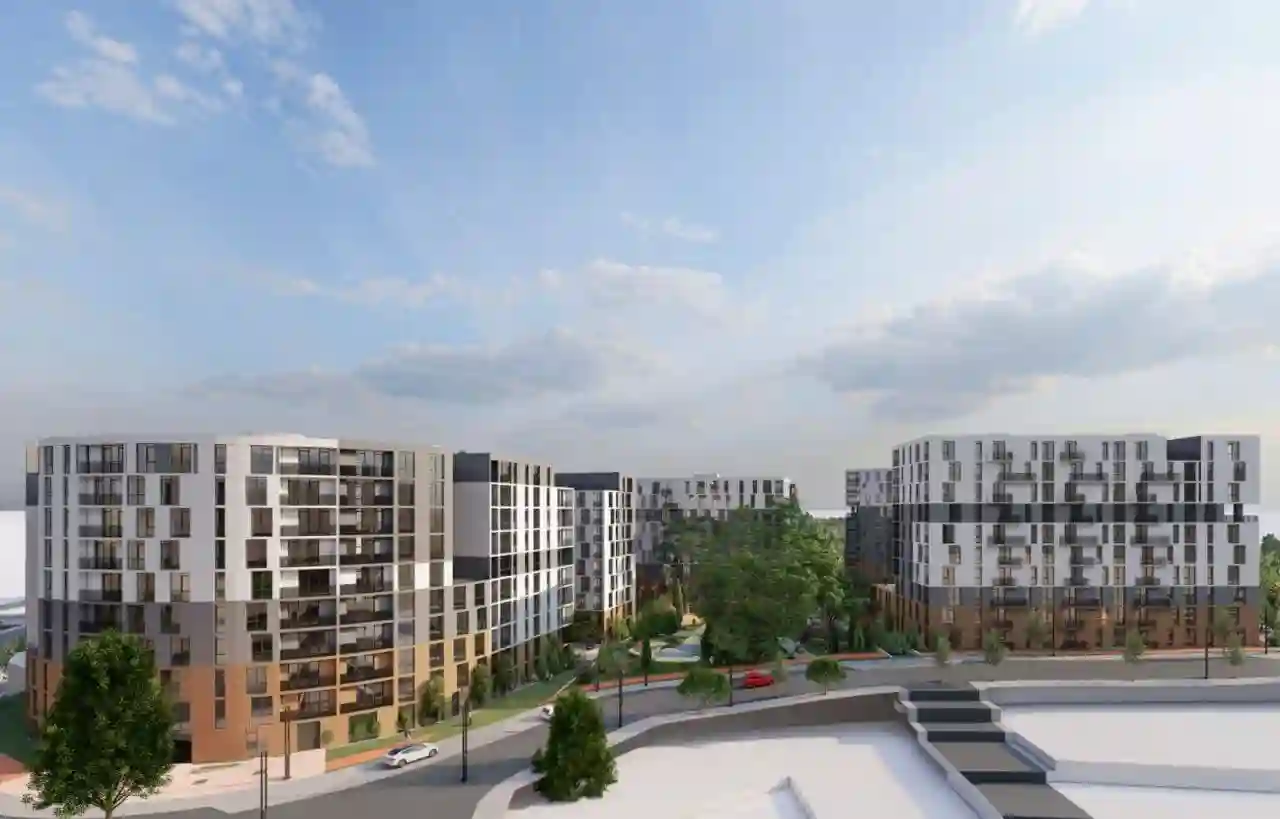
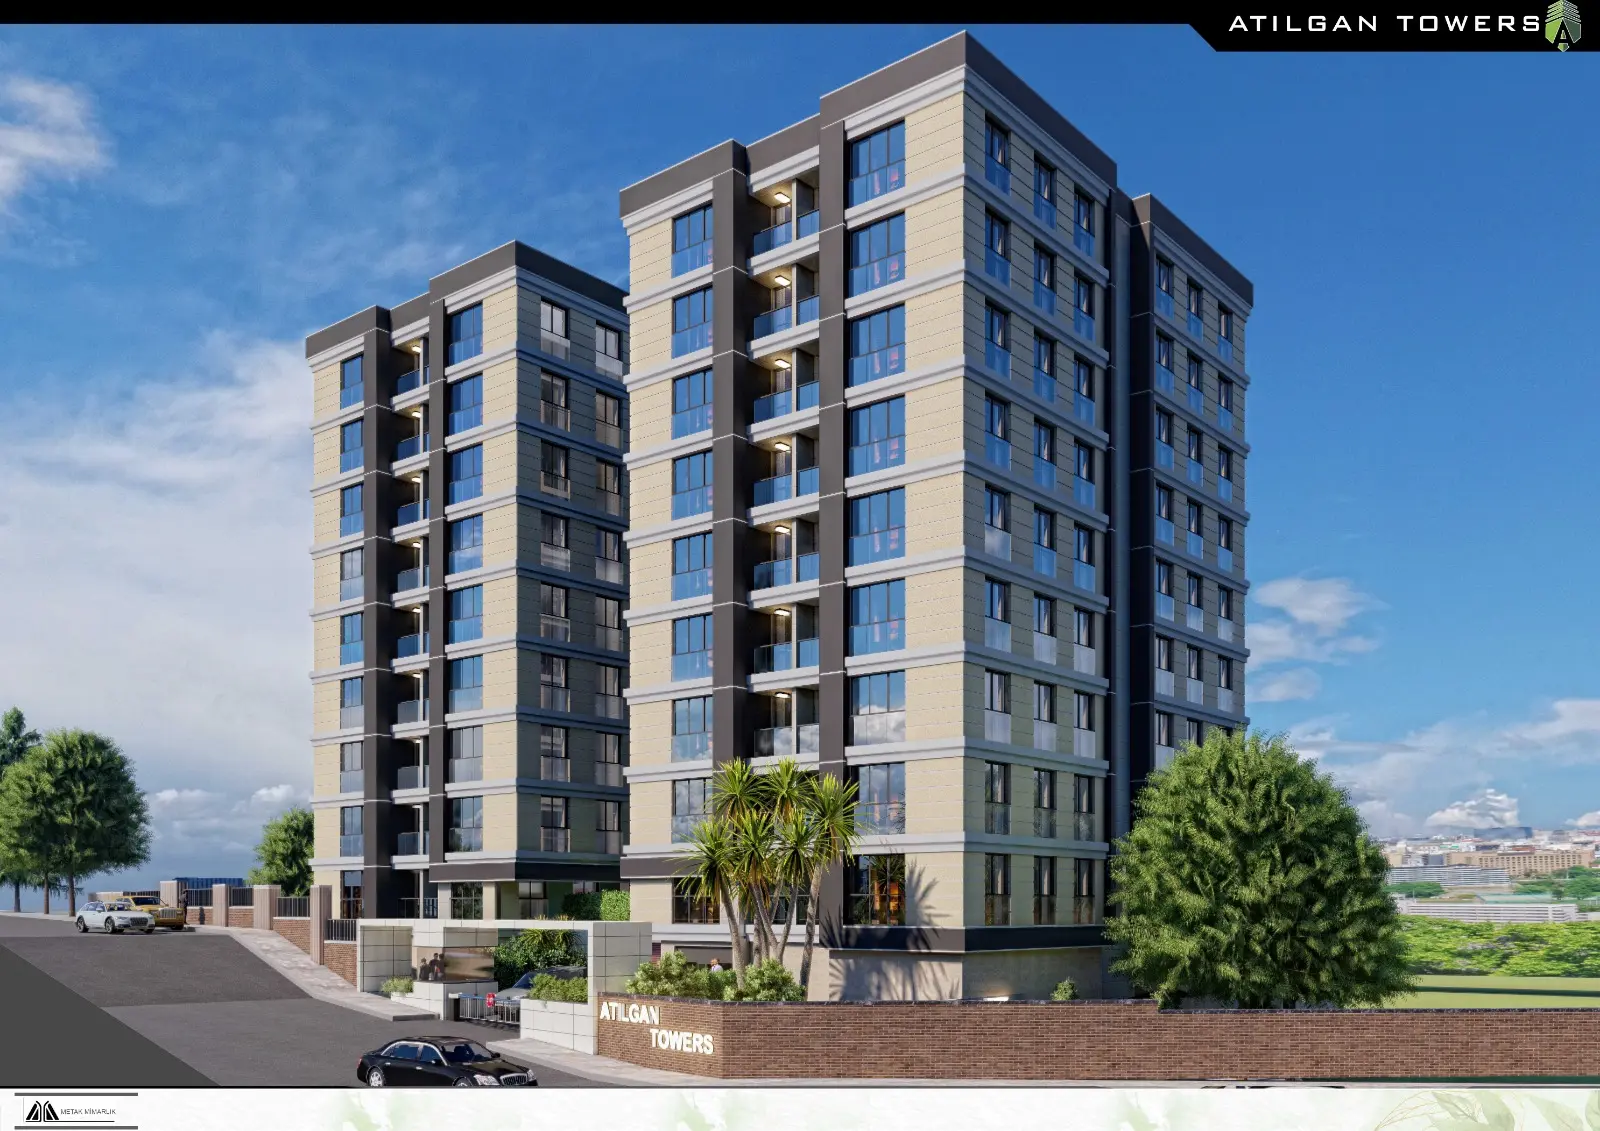
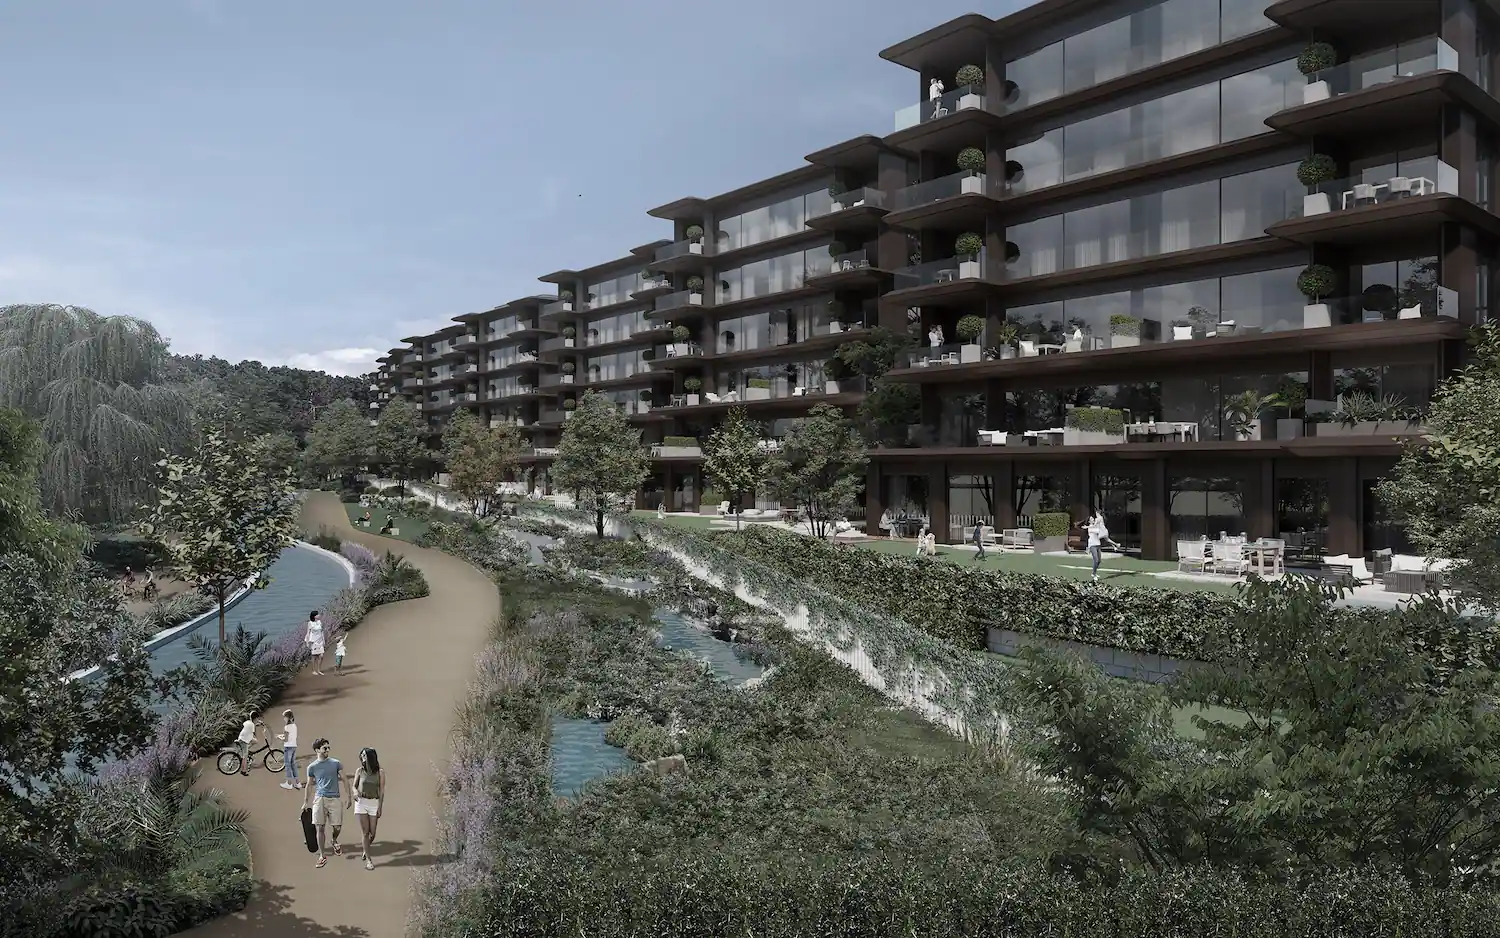
Projects Have same ROI in This Area

.webp)


Have Question Or Suggestion ?
Please Share Your Thought, To Make It Real


