Return on Investment In Turkey
We are providing a financial metric for real estate investors as it helps them to determine the profitability of their real estate investment in Turkey
777€
Average Income
490€ - 1,065€
Min Income - Max Income
339€
Cash Price
| Year | Annual Increase | Monthly ROI | Annual ROI |
|---|---|---|---|
| 1 | 2,751.74 % | 777€ | 9,329€ |
| 2 | 3,439.68 % | 972€ | 11,662€ |
| 3 | 4,299.60 % | 1,215€ | 14,577€ |
| 4 | 5,374.50 % | 1,518€ | 18,221€ |
| 5 | 6,718.13 % | 1,898€ | 22,776€ |
| 6 | 8,397.66 % | 2,373€ | 28,471€ |
| 7 | 10,497.07 % | 2,966€ | 35,588€ |
| 8 | 13,121.34 % | 3,707€ | 44,485€ |
| 9 | 16,401.67 % | 4,634€ | 55,607€ |
| 10 | 20,502.09 % | 5,792€ | 69,508€ |
310,224€ 91,503%
Total ROI For 10 Years
1,065€
Max Income
339€
Cash Price
| Year | Annual Increase | Monthly ROI | Annual ROI |
|---|---|---|---|
| 1 | 3,770.91 % | 1,065€ | 12,785€ |
| 2 | 4,713.64 % | 1,332€ | 15,981€ |
| 3 | 5,892.04 % | 1,665€ | 19,976€ |
| 4 | 7,365.06 % | 2,081€ | 24,970€ |
| 5 | 9,206.32 % | 2,601€ | 31,212€ |
| 6 | 11,507.90 % | 3,251€ | 39,015€ |
| 7 | 14,384.87 % | 4,064€ | 48,769€ |
| 8 | 17,981.09 % | 5,080€ | 60,961€ |
| 9 | 22,476.37 % | 6,350€ | 76,202€ |
| 10 | 28,095.46 % | 7,938€ | 95,252€ |
425,122€ 125,393%
Total ROI For 10 Years
490€
Min Income
339€
Cash Price
| Year | Annual Increase | Monthly ROI | Annual ROI |
|---|---|---|---|
| 1 | 1,732.58 % | 490€ | 5,874€ |
| 2 | 2,165.72 % | 612€ | 7,342€ |
| 3 | 2,707.16 % | 765€ | 9,178€ |
| 4 | 3,383.94 % | 956€ | 11,473€ |
| 5 | 4,229.93 % | 1,195€ | 14,341€ |
| 6 | 5,287.41 % | 1,494€ | 17,926€ |
| 7 | 6,609.27 % | 1,867€ | 22,407€ |
| 8 | 8,261.58 % | 2,334€ | 28,009€ |
| 9 | 10,326.98 % | 2,918€ | 35,012€ |
| 10 | 12,908.72 % | 3,647€ | 43,764€ |
195,326€ 57,613%
Total ROI For 10 Years
District Classification
Rating
b+
Area map
Statistics
Population
381,110
Social Status
Married : 67%
Unmarried : 26%
area
230 Km2
Price Changes Over Last 5 Years
1 Year Change
17.79%
3 Year Change
202%
5 Year Change
253%
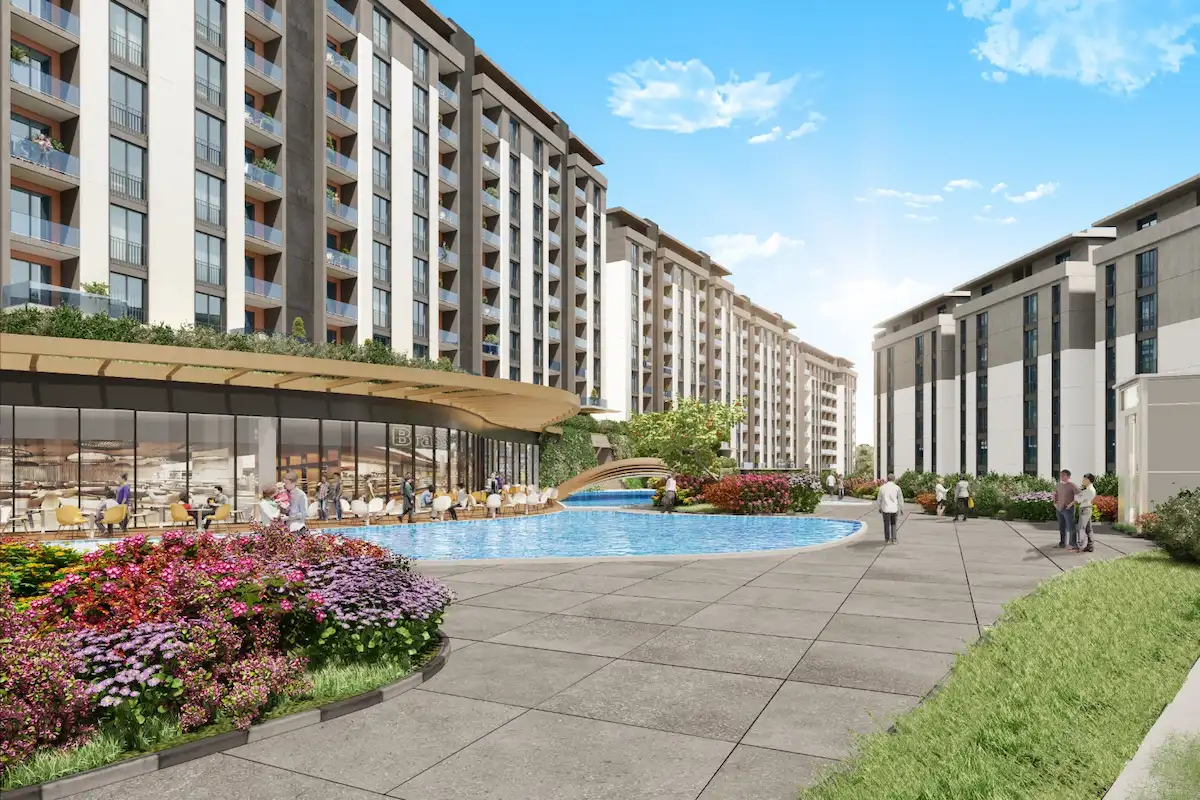
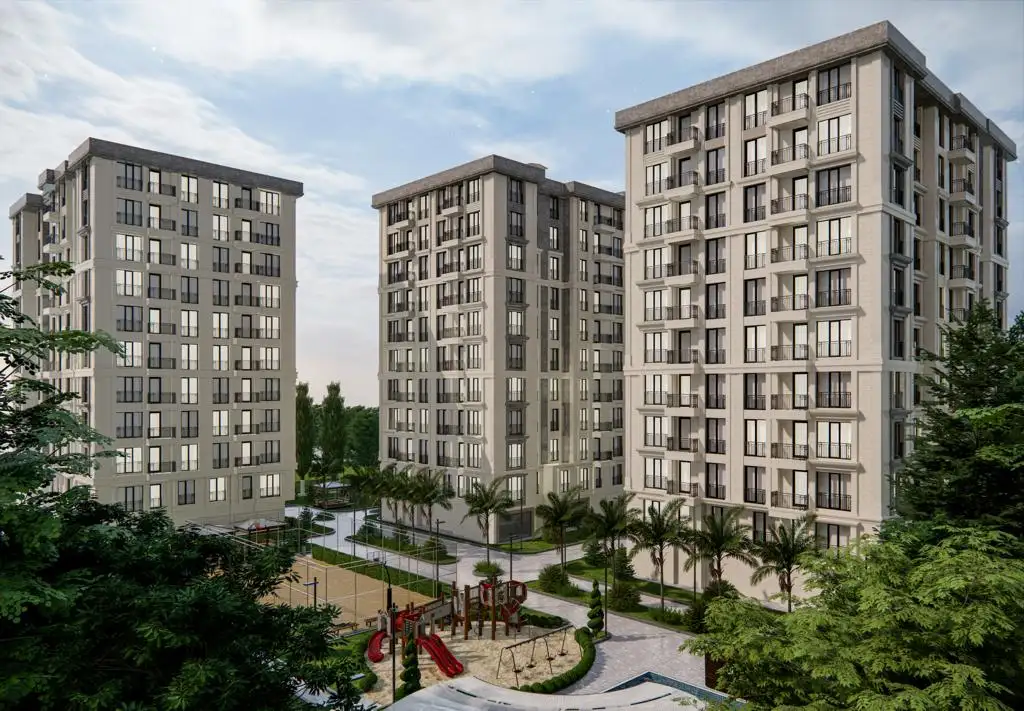
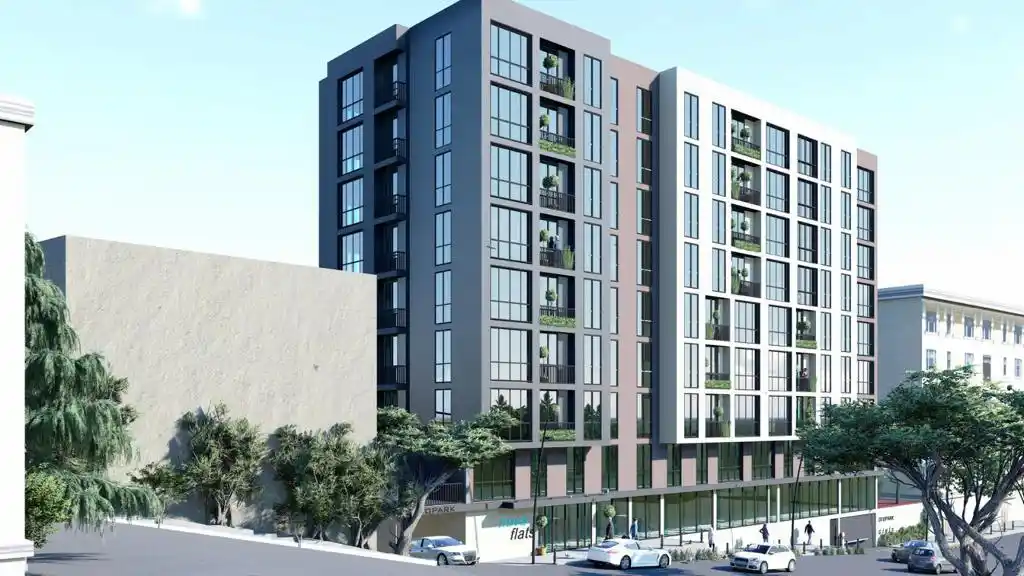
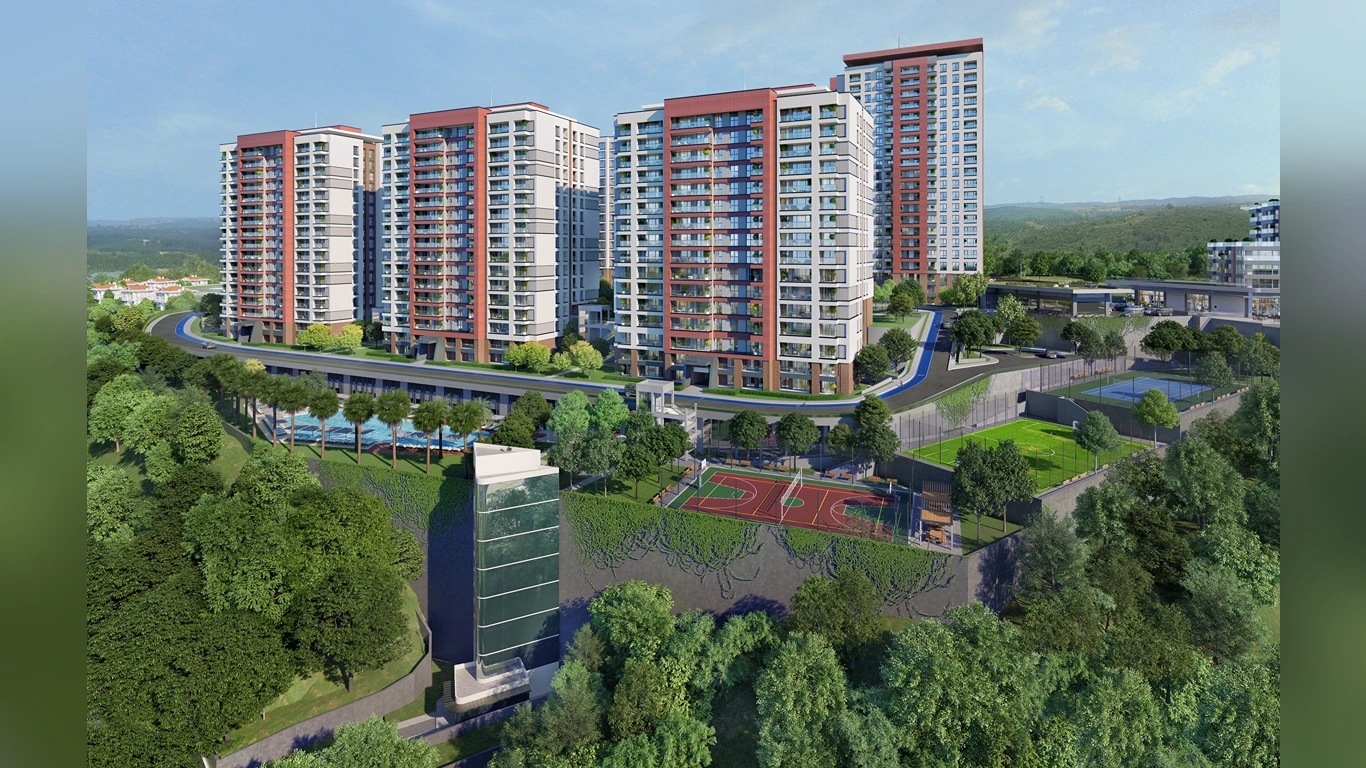
Projects Have same ROI in This Area
.webp)


Have Question Or Suggestion ?
Please Share Your Thought, To Make It Real


