Return on Investment In Turkey
We are providing a financial metric for real estate investors as it helps them to determine the profitability of their real estate investment in Turkey
1,642€
Average Income
1,285€ - 1,999€
Min Income - Max Income
404,521€
Cash Price
| Year | Annual Increase | Monthly ROI | Annual ROI |
|---|---|---|---|
| 1 | 4.87 % | 1,642€ | 19,705€ |
| 2 | 6.09 % | 2,053€ | 24,632€ |
| 3 | 7.61 % | 2,566€ | 30,790€ |
| 4 | 9.51 % | 3,207€ | 38,487€ |
| 5 | 11.89 % | 4,009€ | 48,109€ |
| 6 | 14.87 % | 5,011€ | 60,136€ |
| 7 | 18.58 % | 6,264€ | 75,170€ |
| 8 | 23.23 % | 7,830€ | 93,963€ |
| 9 | 29.04 % | 9,788€ | 117,454€ |
| 10 | 36.29 % | 12,235€ | 146,817€ |
655,263€ 161%
Total ROI For 10 Years
1,999€
Max Income
404,521€
Cash Price
| Year | Annual Increase | Monthly ROI | Annual ROI |
|---|---|---|---|
| 1 | 5.93 % | 1,999€ | 23,989€ |
| 2 | 7.41 % | 2,499€ | 29,987€ |
| 3 | 9.27 % | 3,124€ | 37,483€ |
| 4 | 11.58 % | 3,905€ | 46,854€ |
| 5 | 14.48 % | 4,881€ | 58,567€ |
| 6 | 18.10 % | 6,101€ | 73,209€ |
| 7 | 22.62 % | 7,626€ | 91,512€ |
| 8 | 28.28 % | 9,532€ | 114,390€ |
| 9 | 35.35 % | 11,916€ | 142,987€ |
| 10 | 44.18 % | 14,894€ | 178,734€ |
797,711€ 197%
Total ROI For 10 Years
1,285€
Min Income
404,521€
Cash Price
| Year | Annual Increase | Monthly ROI | Annual ROI |
|---|---|---|---|
| 1 | 3.81 % | 1,285€ | 15,422€ |
| 2 | 4.77 % | 1,606€ | 19,277€ |
| 3 | 5.96 % | 2,008€ | 24,096€ |
| 4 | 7.45 % | 2,510€ | 30,120€ |
| 5 | 9.31 % | 3,138€ | 37,651€ |
| 6 | 11.63 % | 3,922€ | 47,063€ |
| 7 | 14.54 % | 4,902€ | 58,829€ |
| 8 | 18.18 % | 6,128€ | 73,536€ |
| 9 | 22.72 % | 7,660€ | 91,920€ |
| 10 | 28.40 % | 9,575€ | 114,900€ |
512,814€ 126%
Total ROI For 10 Years
District Classification
Rating
b+
Area map
Statistics
Population
381,110
Social Status
Married : 67%
Unmarried : 26%
area
230 Km2
Price Changes Over Last 5 Years
1 Year Change
17.79%
3 Year Change
202%
5 Year Change
253%
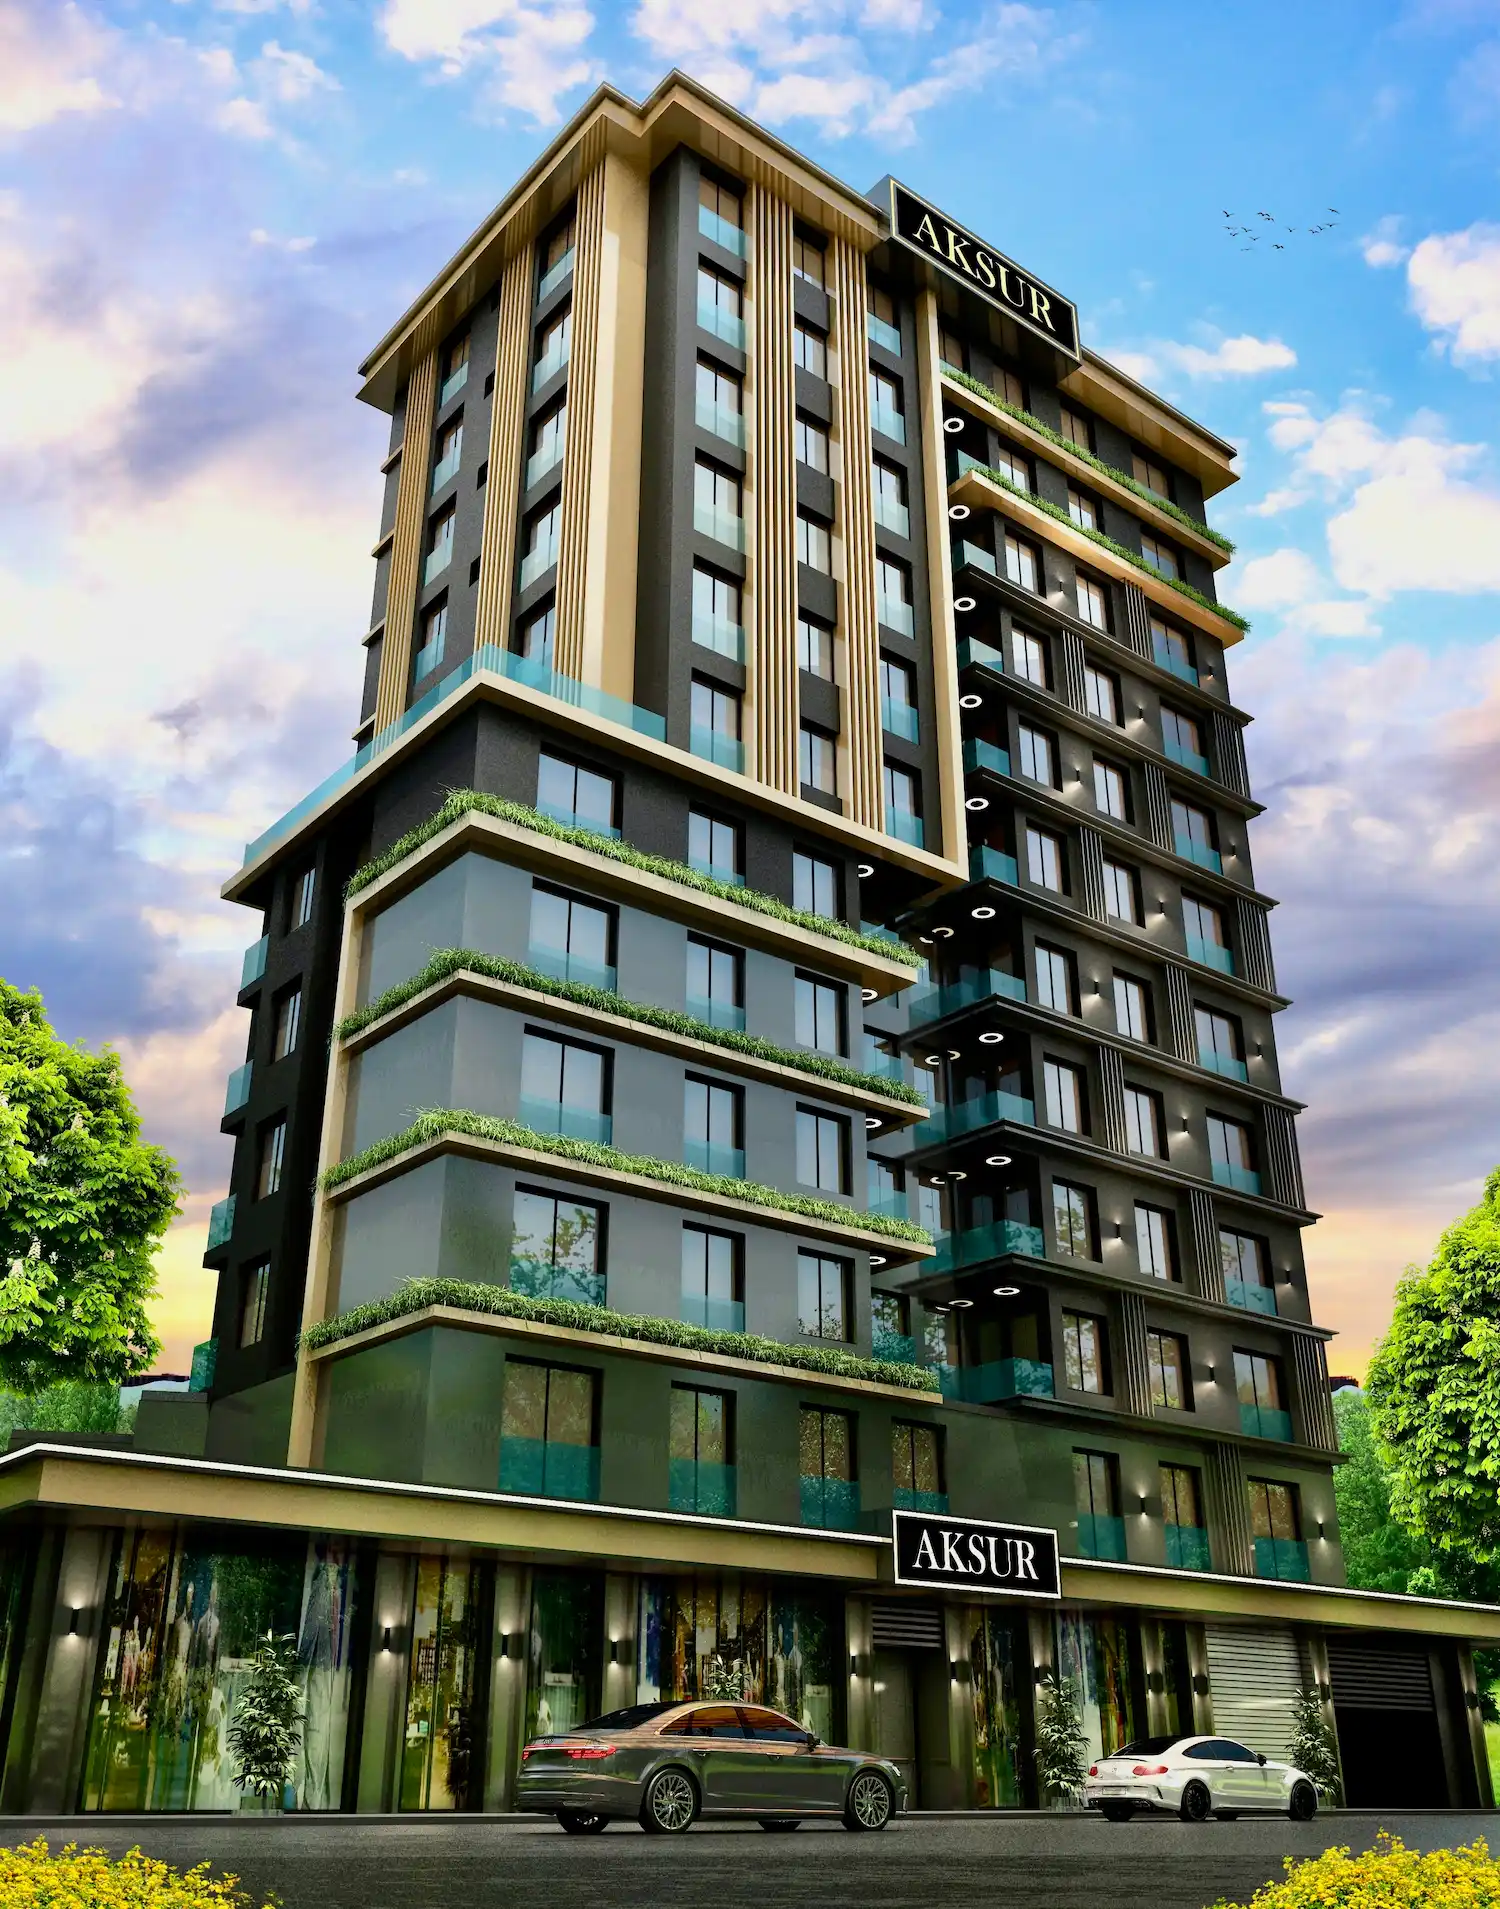
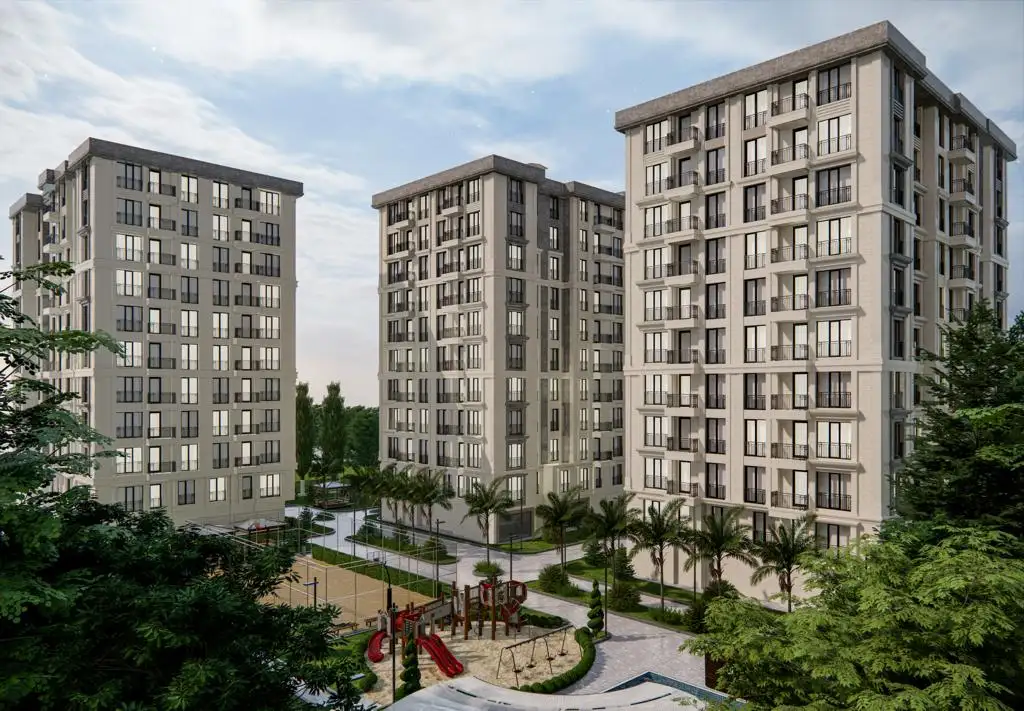
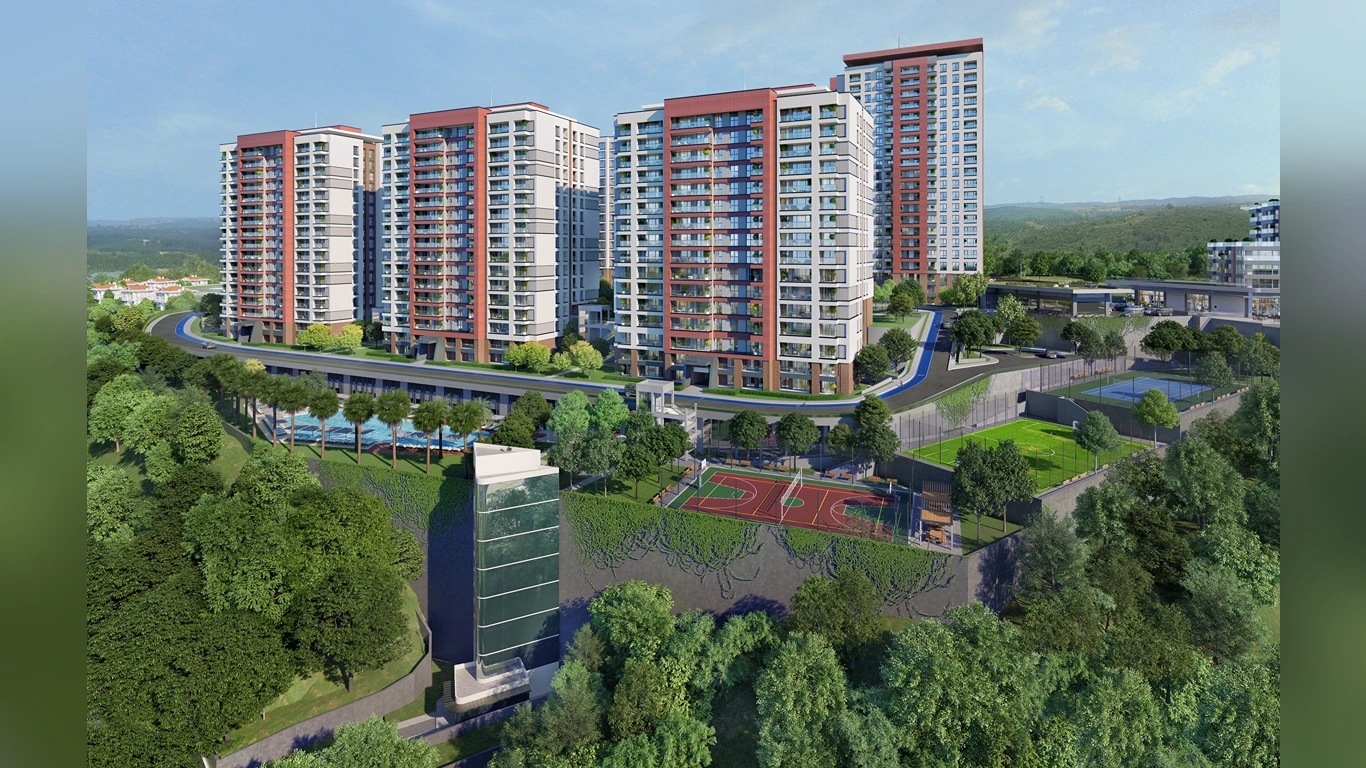
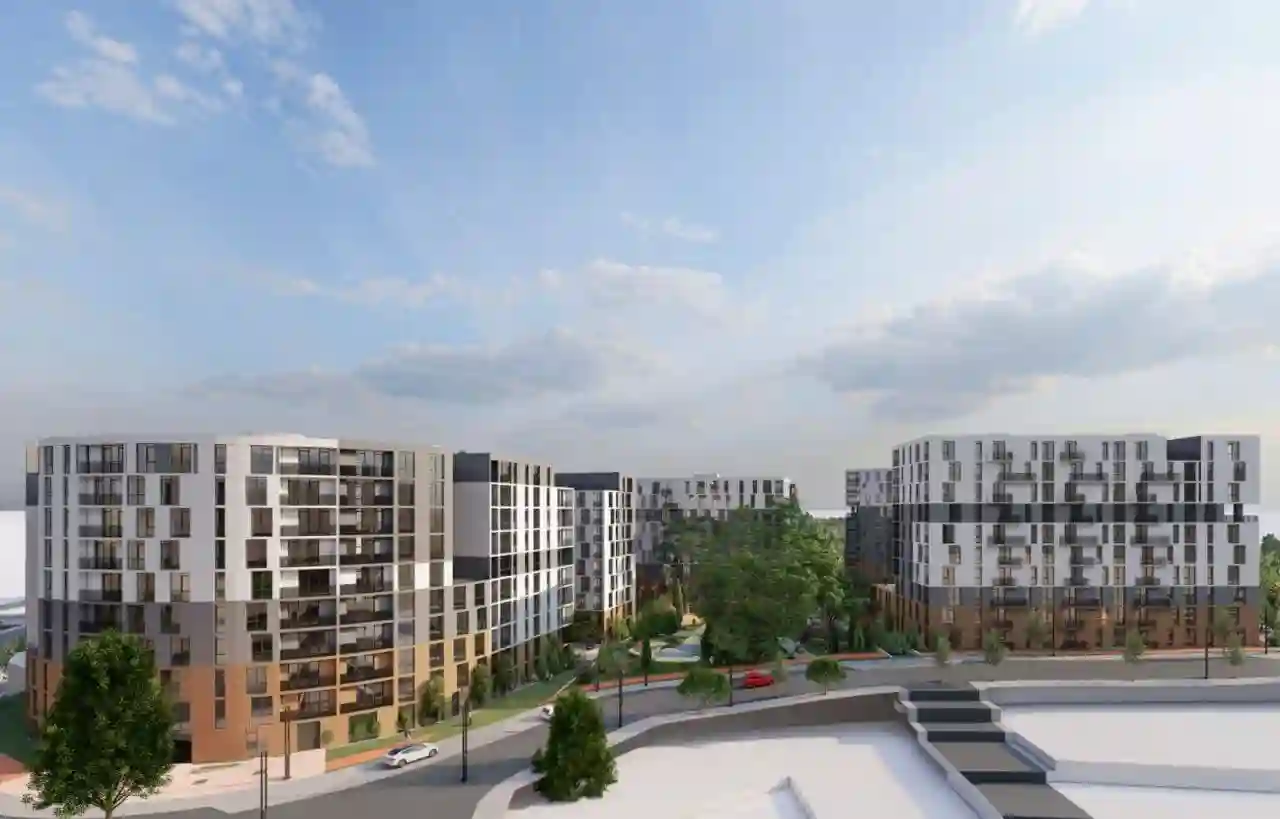
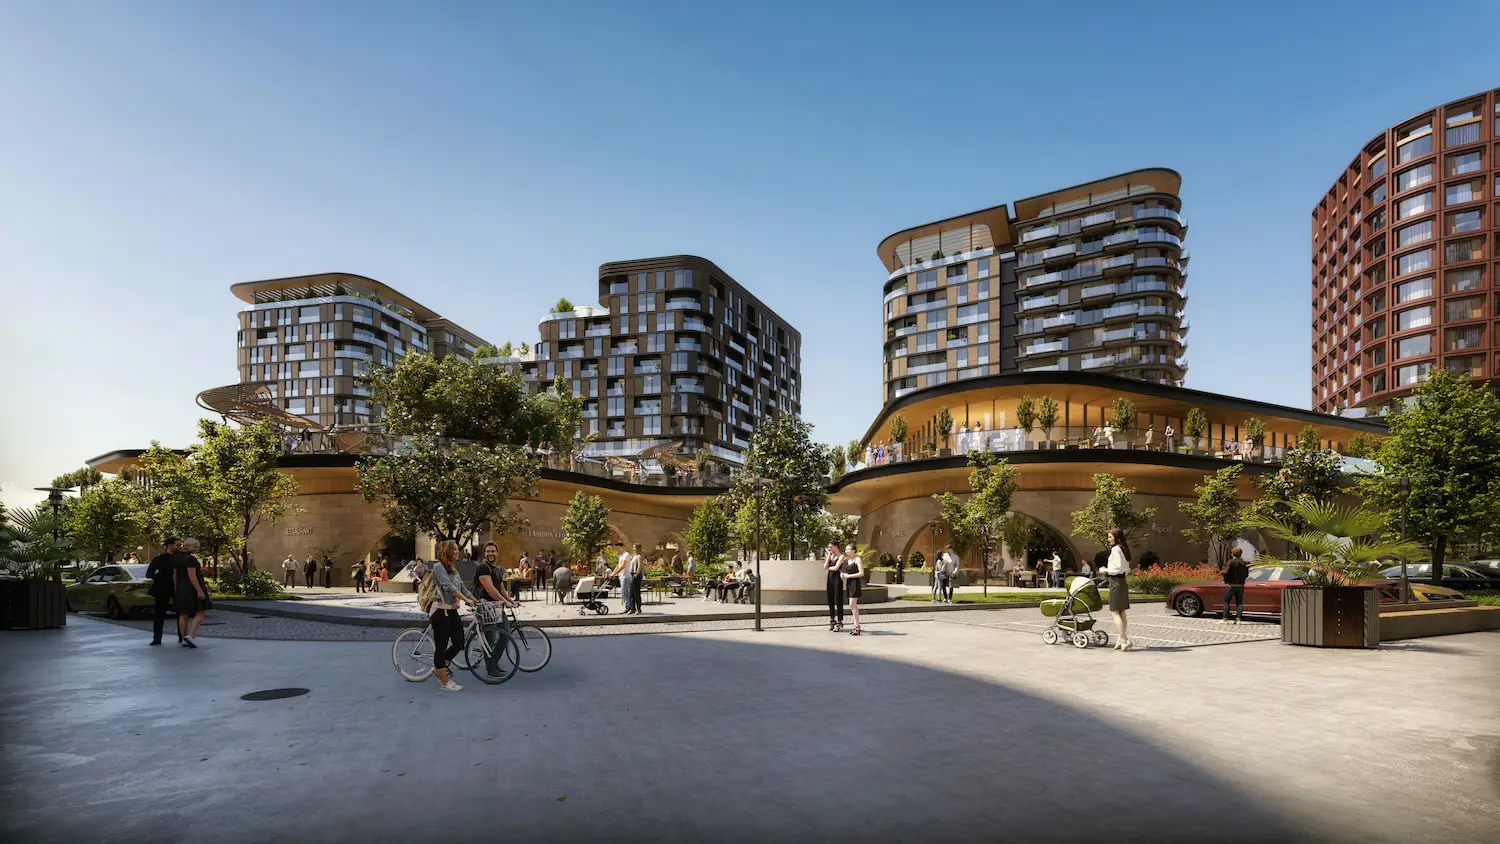
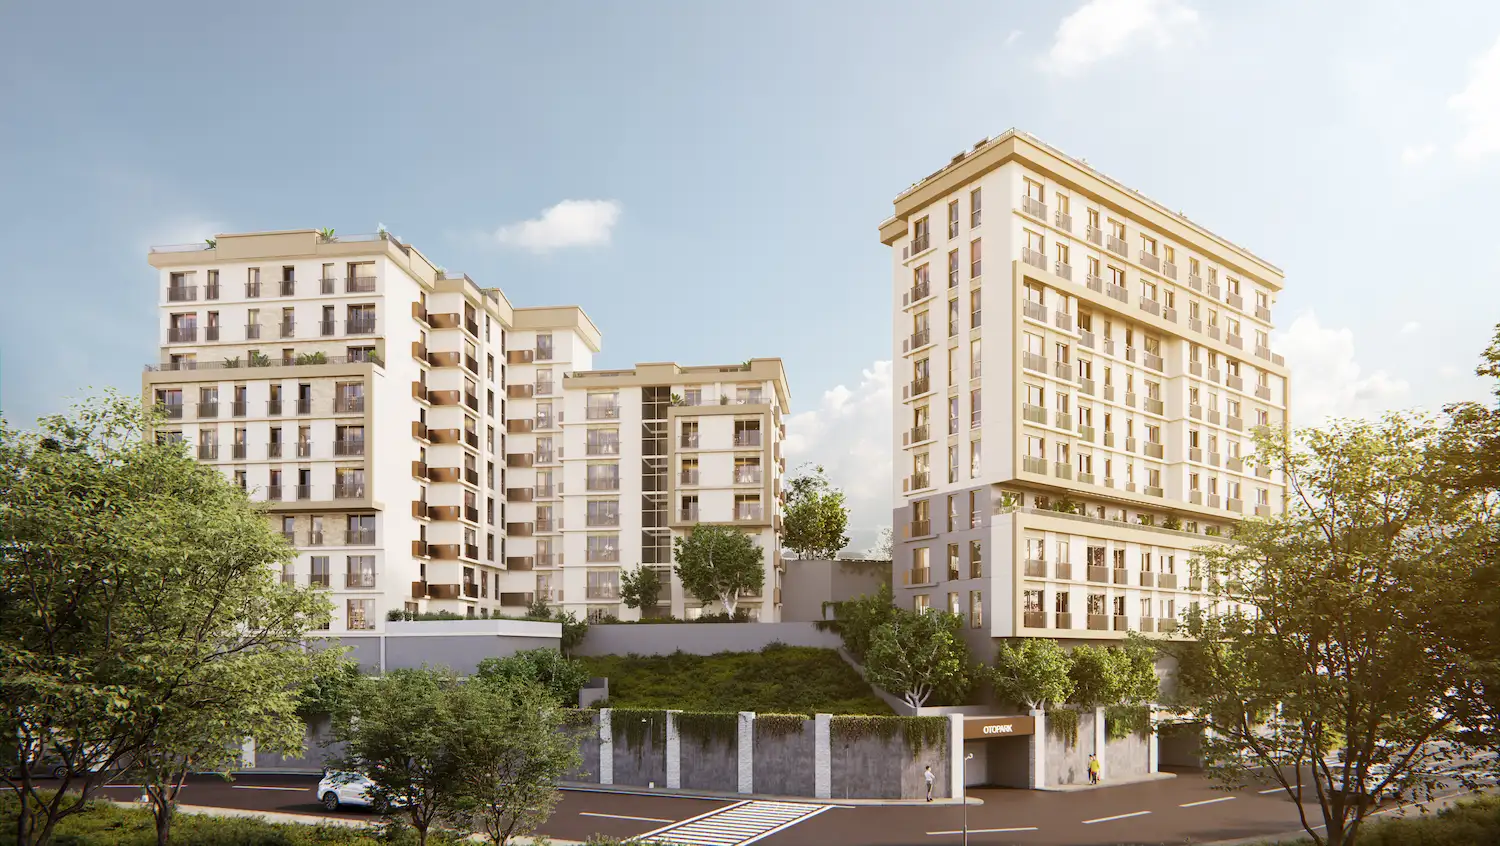
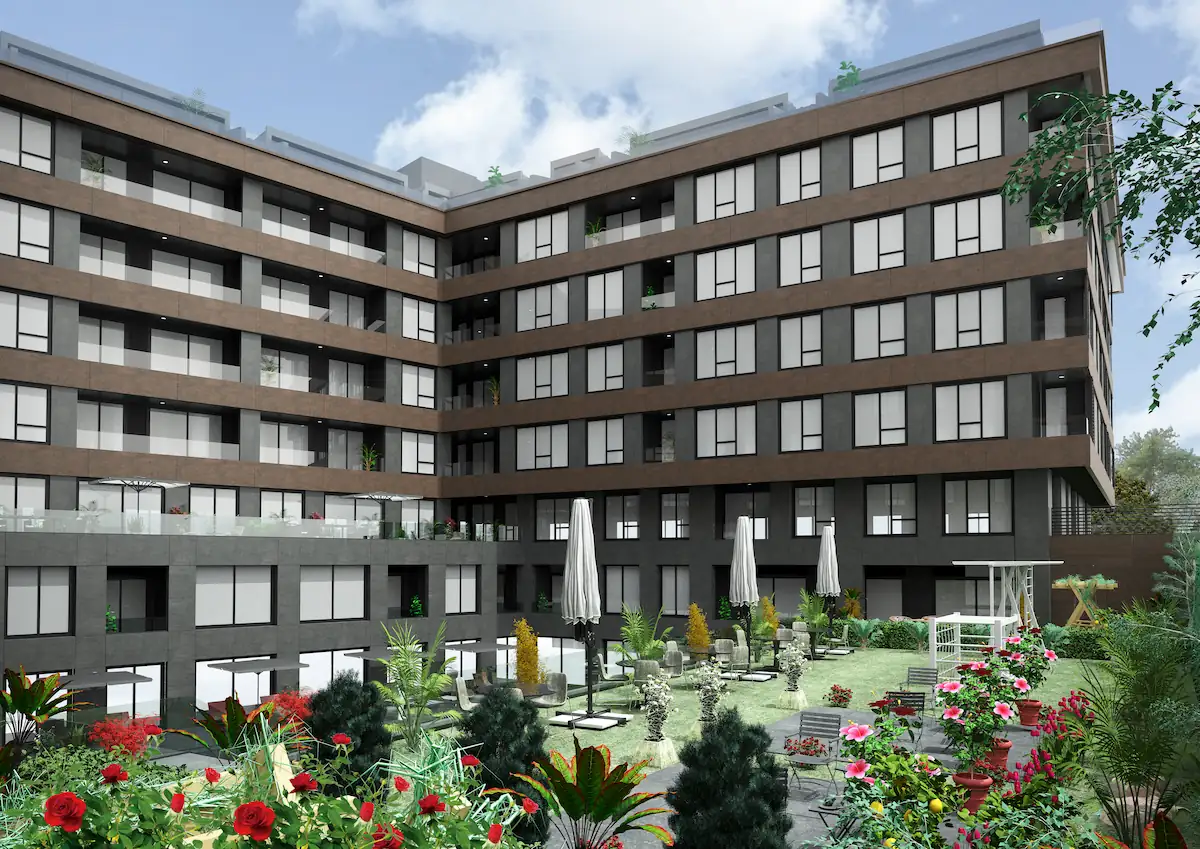
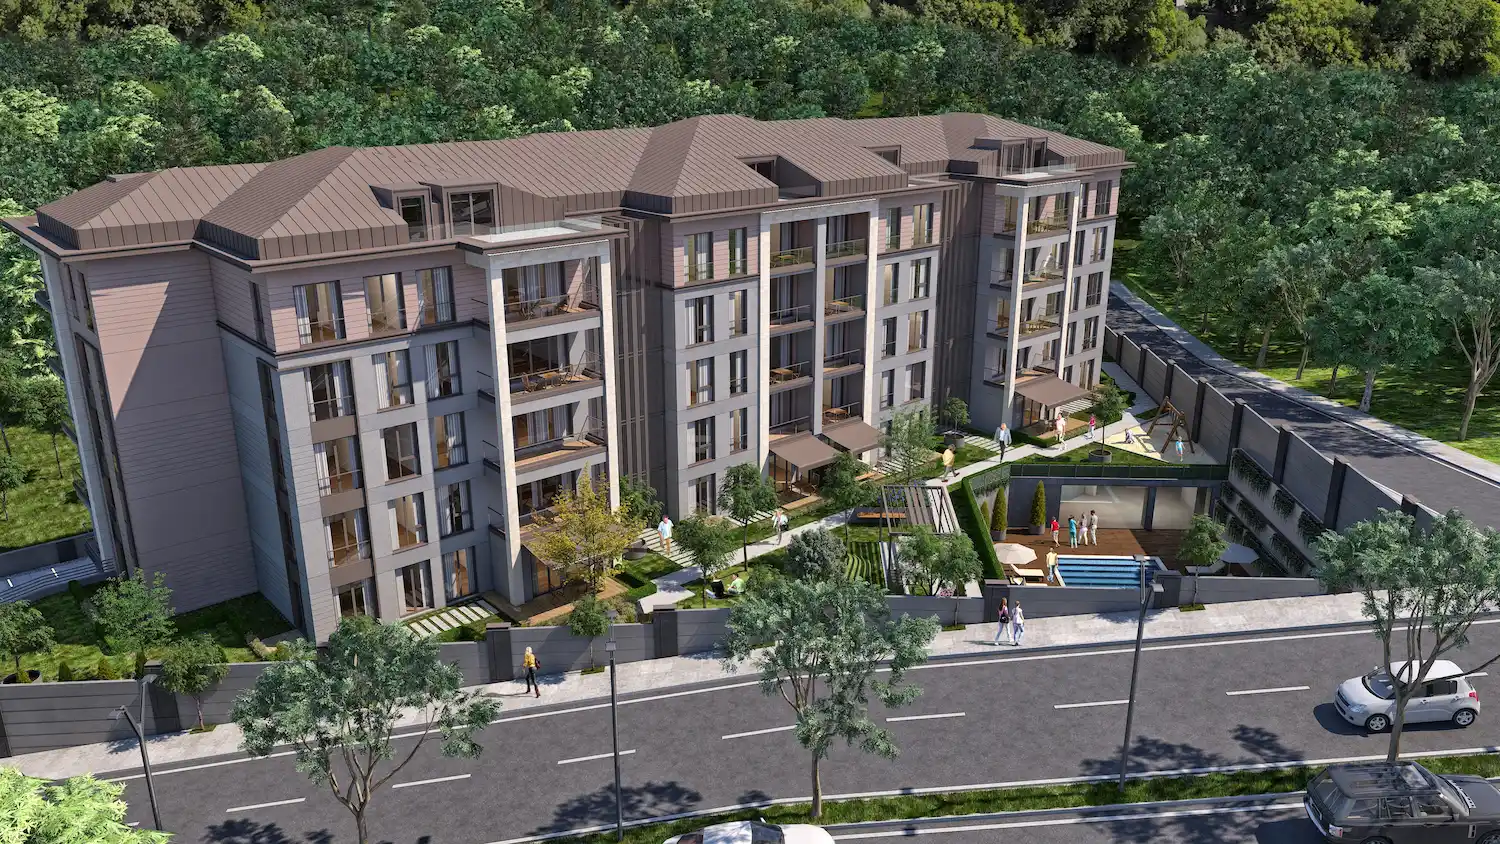
Projects Have same ROI in This Area


Have Question Or Suggestion ?
Please Share Your Thought, To Make It Real


