Return on Investment In Turkey
We are providing a financial metric for real estate investors as it helps them to determine the profitability of their real estate investment in Turkey
1,785$
Average Income
1,397$ - 2,173$
Min Income - Max Income
430,449$
Cash Price
| Year | Annual Increase | Monthly ROI | Annual ROI |
|---|---|---|---|
| 1 | 4.98 % | 1,785$ | 21,415$ |
| 2 | 6.22 % | 2,231$ | 26,769$ |
| 3 | 7.77 % | 2,788$ | 33,462$ |
| 4 | 9.72 % | 3,486$ | 41,827$ |
| 5 | 12.15 % | 4,357$ | 52,284$ |
| 6 | 15.18 % | 5,446$ | 65,355$ |
| 7 | 18.98 % | 6,808$ | 81,693$ |
| 8 | 23.72 % | 8,510$ | 102,117$ |
| 9 | 29.65 % | 10,637$ | 127,646$ |
| 10 | 37.07 % | 13,296$ | 159,557$ |
712,124$ 165%
Total ROI For 10 Years
2,173$
Max Income
430,449$
Cash Price
| Year | Annual Increase | Monthly ROI | Annual ROI |
|---|---|---|---|
| 1 | 6.06 % | 2,173$ | 26,071$ |
| 2 | 7.57 % | 2,716$ | 32,589$ |
| 3 | 9.46 % | 3,395$ | 40,736$ |
| 4 | 11.83 % | 4,243$ | 50,920$ |
| 5 | 14.79 % | 5,304$ | 63,650$ |
| 6 | 18.48 % | 6,630$ | 79,562$ |
| 7 | 23.10 % | 8,288$ | 99,453$ |
| 8 | 28.88 % | 10,360$ | 124,316$ |
| 9 | 36.10 % | 12,950$ | 155,395$ |
| 10 | 45.13 % | 16,187$ | 194,244$ |
866,934$ 201%
Total ROI For 10 Years
1,397$
Min Income
430,449$
Cash Price
| Year | Annual Increase | Monthly ROI | Annual ROI |
|---|---|---|---|
| 1 | 3.89 % | 1,397$ | 16,760$ |
| 2 | 4.87 % | 1,746$ | 20,950$ |
| 3 | 6.08 % | 2,182$ | 26,187$ |
| 4 | 7.60 % | 2,728$ | 32,734$ |
| 5 | 9.51 % | 3,410$ | 40,918$ |
| 6 | 11.88 % | 4,262$ | 51,147$ |
| 7 | 14.85 % | 5,328$ | 63,934$ |
| 8 | 18.57 % | 6,660$ | 79,917$ |
| 9 | 23.21 % | 8,325$ | 99,897$ |
| 10 | 29.01 % | 10,406$ | 124,871$ |
557,315$ 129%
Total ROI For 10 Years
District Classification
Rating
b+
Area map
Statistics
Population
381,110
Social Status
Married : 67%
Unmarried : 26%
area
230 Km2
Price Changes Over Last 5 Years
1 Year Change
17.79%
3 Year Change
202%
5 Year Change
253%
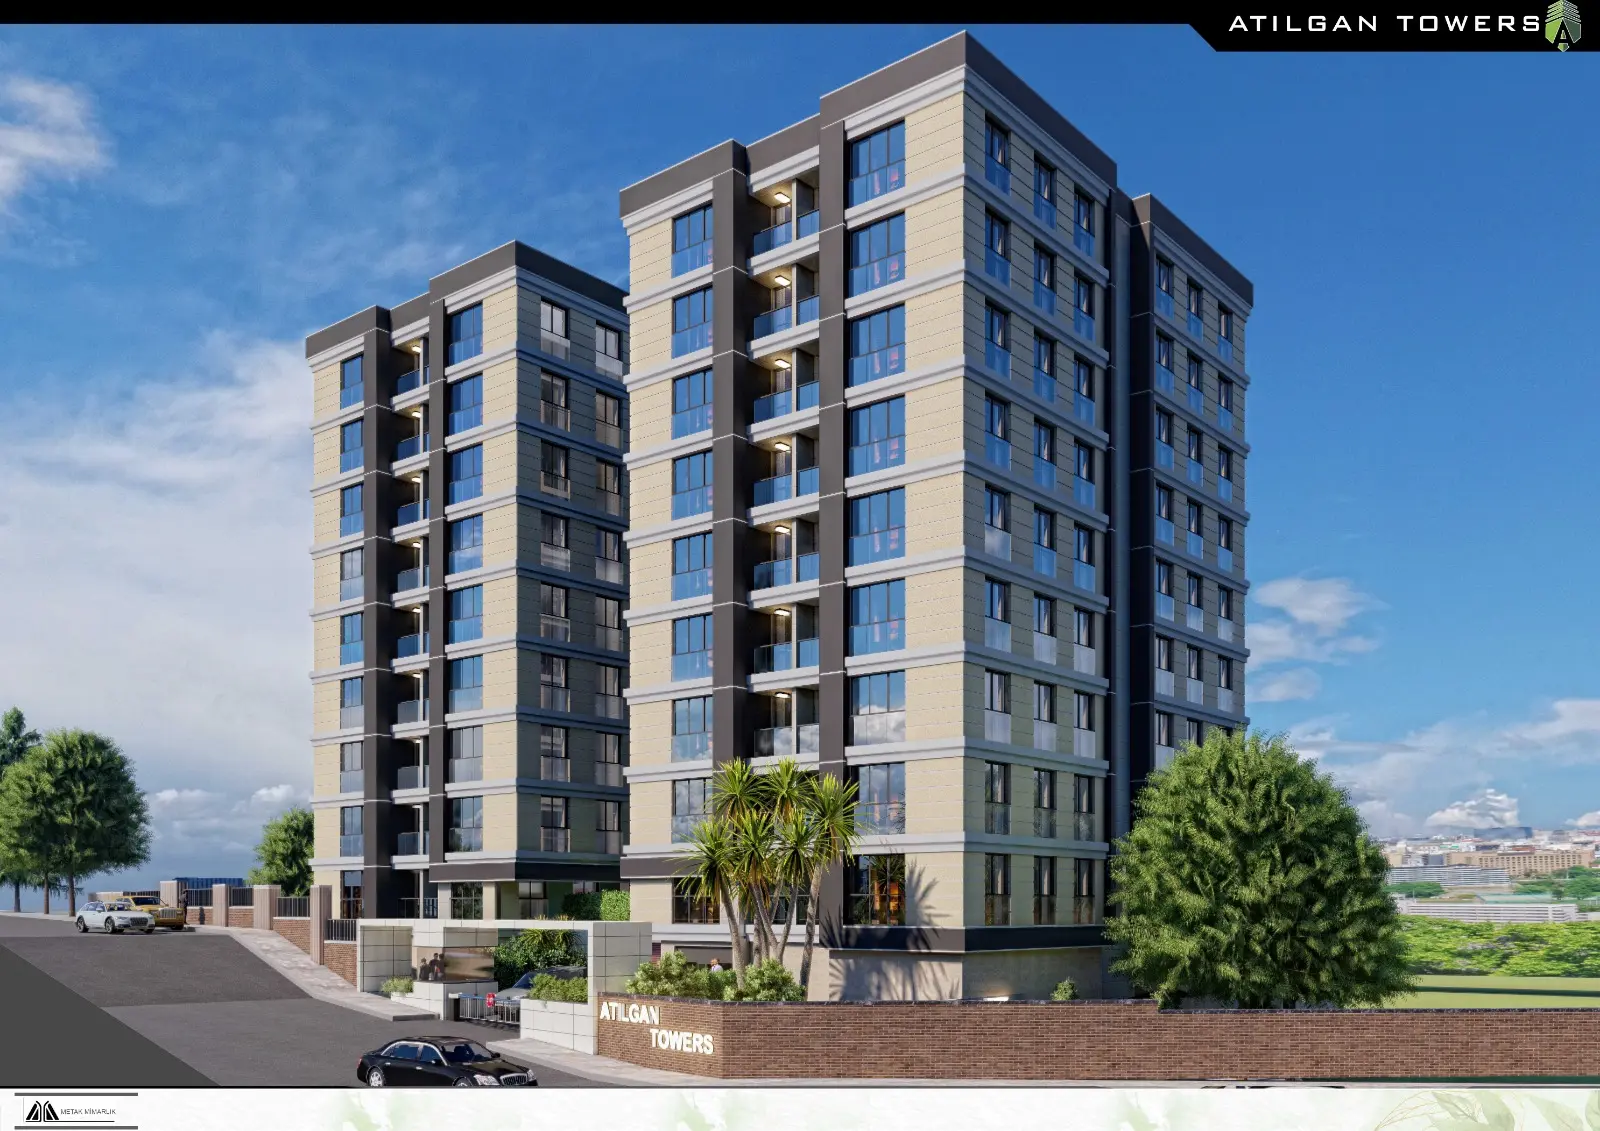
Projects Have same ROI in This Area


.webp)

Have Question Or Suggestion ?
Please Share Your Thought, To Make It Real


