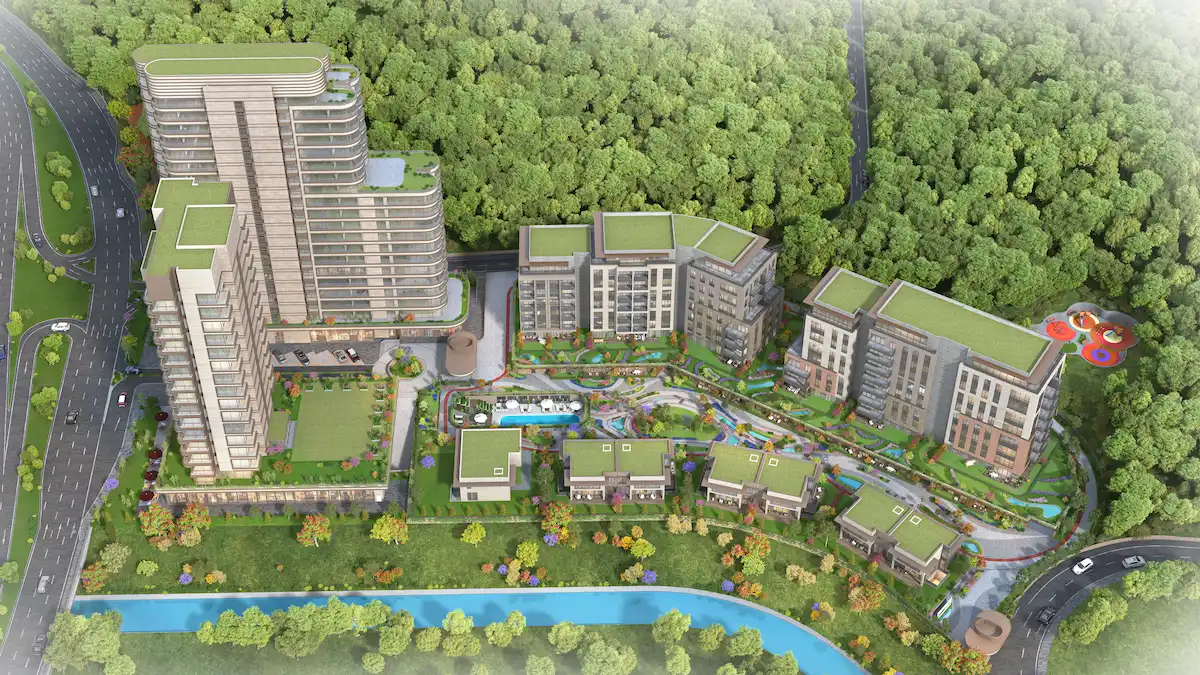
Return on Investment In Turkey
We are providing a financial metric for real estate investors as it helps them to determine the profitability of their real estate investment in Turkey
3,181$
Average Income
2,017$ - 4,345$
Min Income - Max Income
933,856$
Cash Price
| Year | Annual Increase | Monthly ROI | Annual ROI |
|---|---|---|---|
| 1 | 4.09 % | 3,181$ | 38,173$ |
| 2 | 5.11 % | 3,976$ | 47,716$ |
| 3 | 6.39 % | 4,970$ | 59,645$ |
| 4 | 7.98 % | 6,213$ | 74,557$ |
| 5 | 9.98 % | 7,766$ | 93,196$ |
| 6 | 12.47 % | 9,708$ | 116,495$ |
| 7 | 15.59 % | 12,135$ | 145,618$ |
| 8 | 19.49 % | 15,169$ | 182,023$ |
| 9 | 24.36 % | 18,961$ | 227,529$ |
| 10 | 30.46 % | 23,701$ | 284,411$ |
1,269,362$ 135%
Total ROI For 10 Years
4,345$
Max Income
933,856$
Cash Price
| Year | Annual Increase | Monthly ROI | Annual ROI |
|---|---|---|---|
| 1 | 5.58 % | 4,345$ | 52,139$ |
| 2 | 6.98 % | 5,431$ | 65,173$ |
| 3 | 8.72 % | 6,789$ | 81,467$ |
| 4 | 10.90 % | 8,486$ | 101,833$ |
| 5 | 13.63 % | 10,608$ | 127,292$ |
| 6 | 17.04 % | 13,260$ | 159,115$ |
| 7 | 21.30 % | 16,574$ | 198,893$ |
| 8 | 26.62 % | 20,718$ | 248,617$ |
| 9 | 33.28 % | 25,898$ | 310,771$ |
| 10 | 41.60 % | 32,372$ | 388,463$ |
1,733,762$ 185%
Total ROI For 10 Years
2,017$
Min Income
933,856$
Cash Price
| Year | Annual Increase | Monthly ROI | Annual ROI |
|---|---|---|---|
| 1 | 2.59 % | 2,017$ | 24,207$ |
| 2 | 3.24 % | 2,522$ | 30,259$ |
| 3 | 4.05 % | 3,152$ | 37,824$ |
| 4 | 5.06 % | 3,940$ | 47,280$ |
| 5 | 6.33 % | 4,925$ | 59,100$ |
| 6 | 7.91 % | 6,156$ | 73,875$ |
| 7 | 9.89 % | 7,695$ | 92,343$ |
| 8 | 12.36 % | 9,619$ | 115,429$ |
| 9 | 15.45 % | 12,024$ | 144,286$ |
| 10 | 19.31 % | 15,030$ | 180,358$ |
804,961$ 86%
Total ROI For 10 Years
District Classification
Rating
A+
Area map
Statistics
Population
349,970
Social Status
Married : 55%
Unmarried : 32%
area
174 Km2
Price Changes Over Last 5 Years
1 Year Change
11.84%
3 Year Change
445.3%
5 Year Change
490%
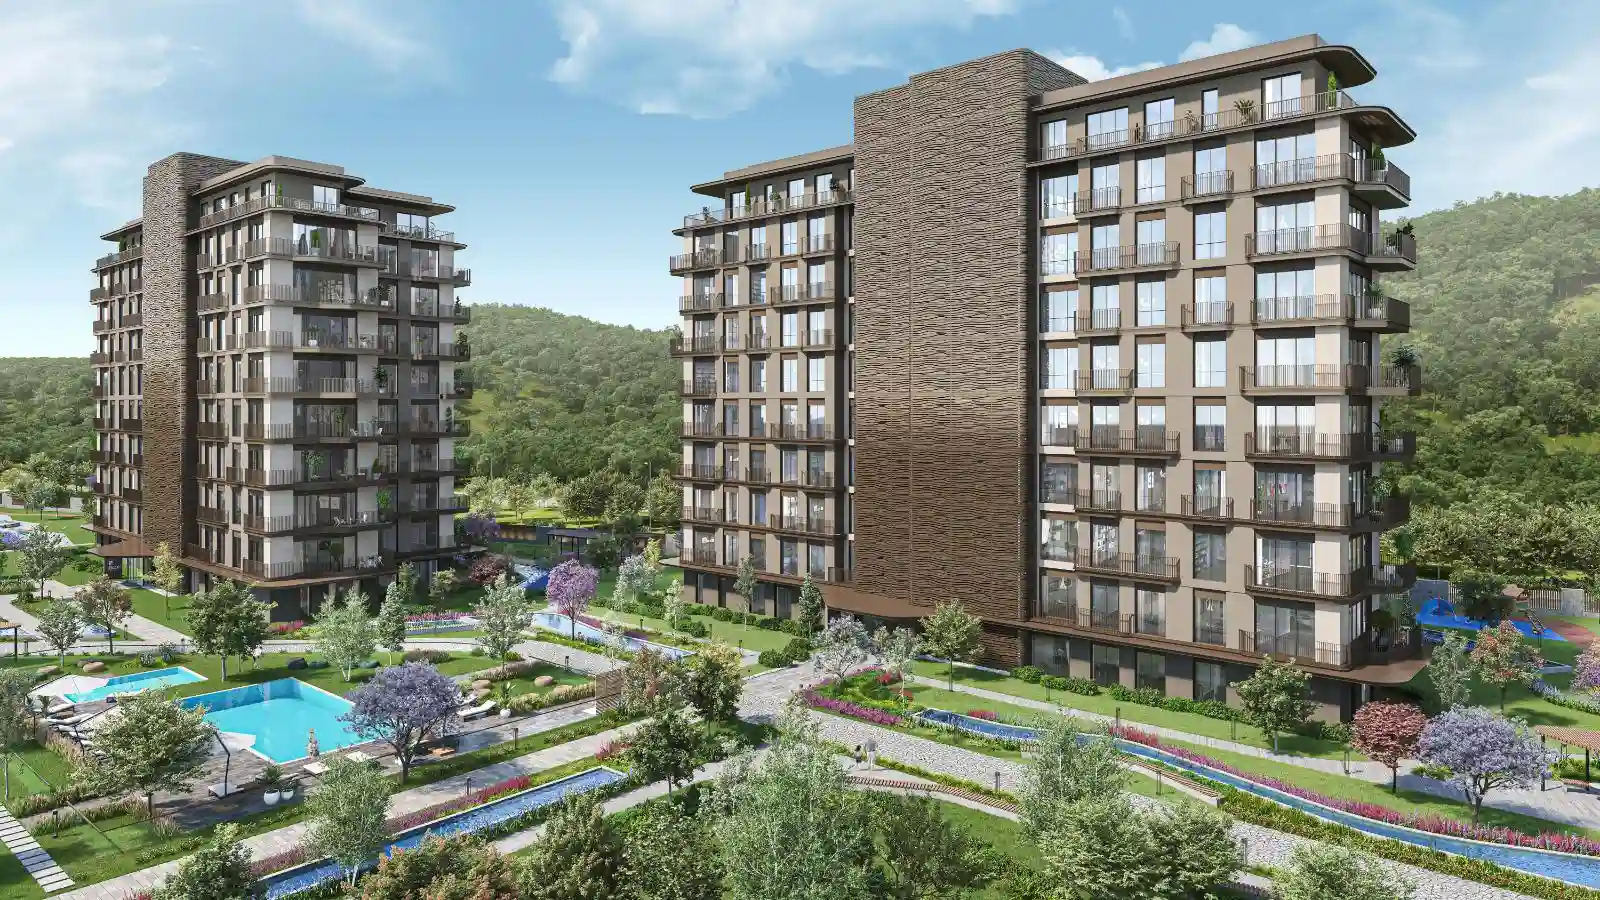
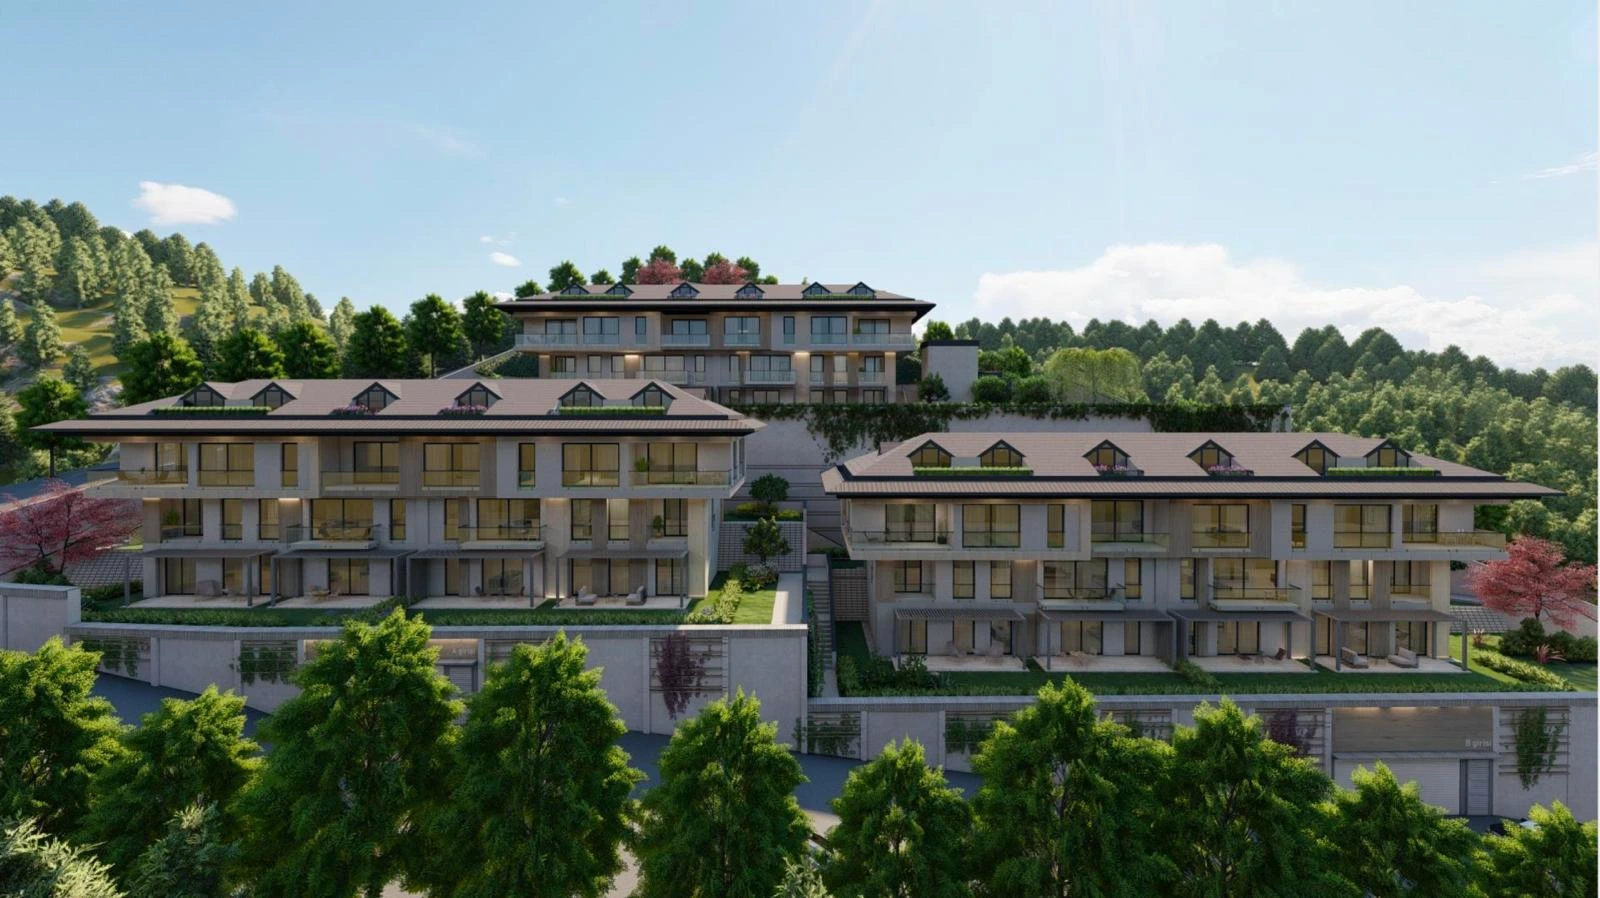
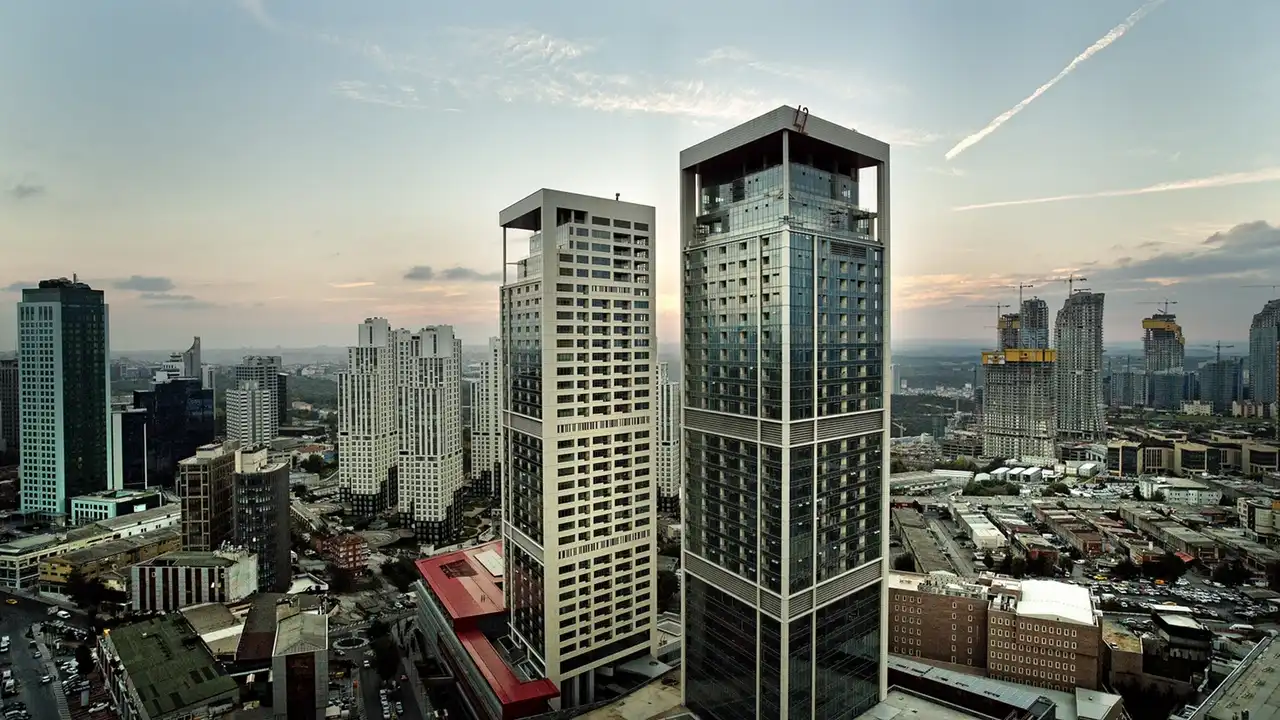
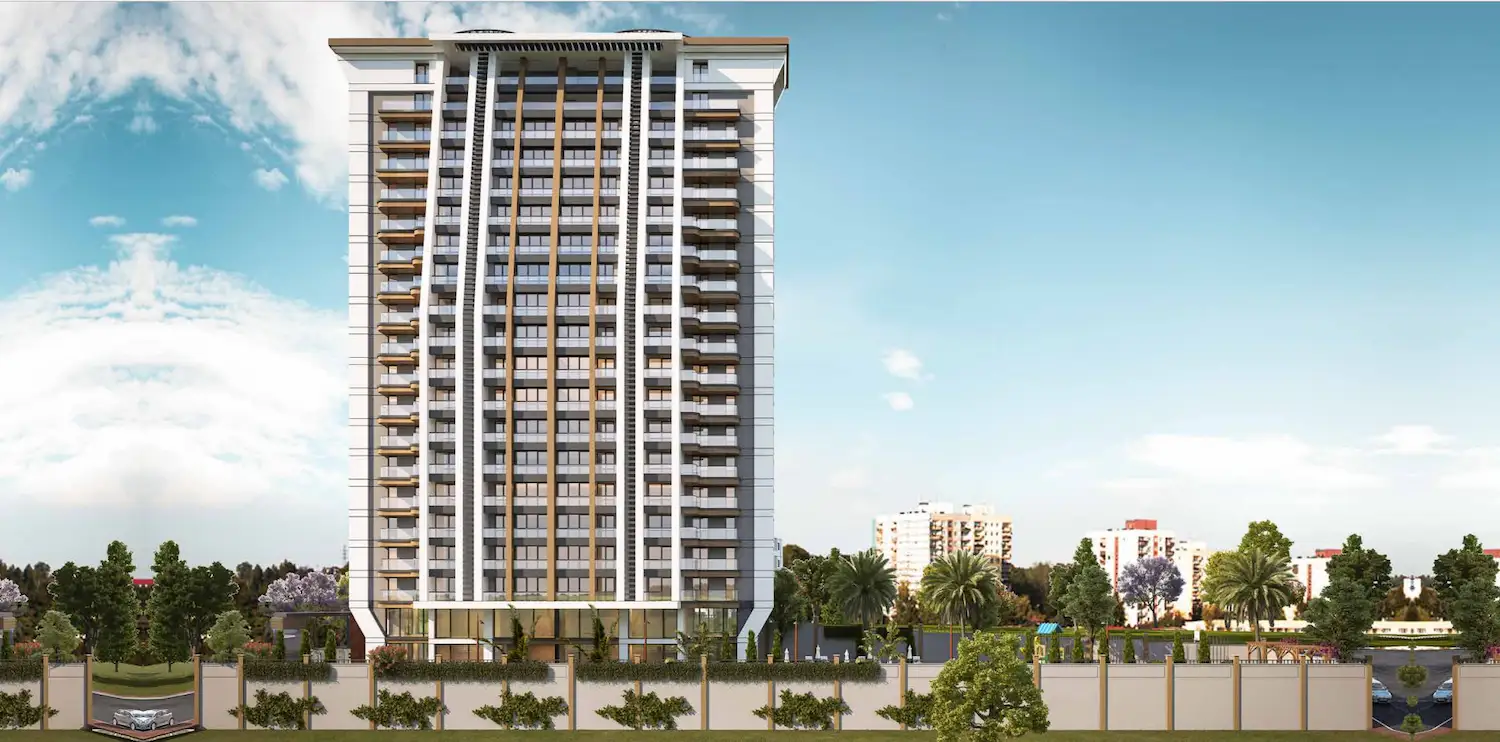
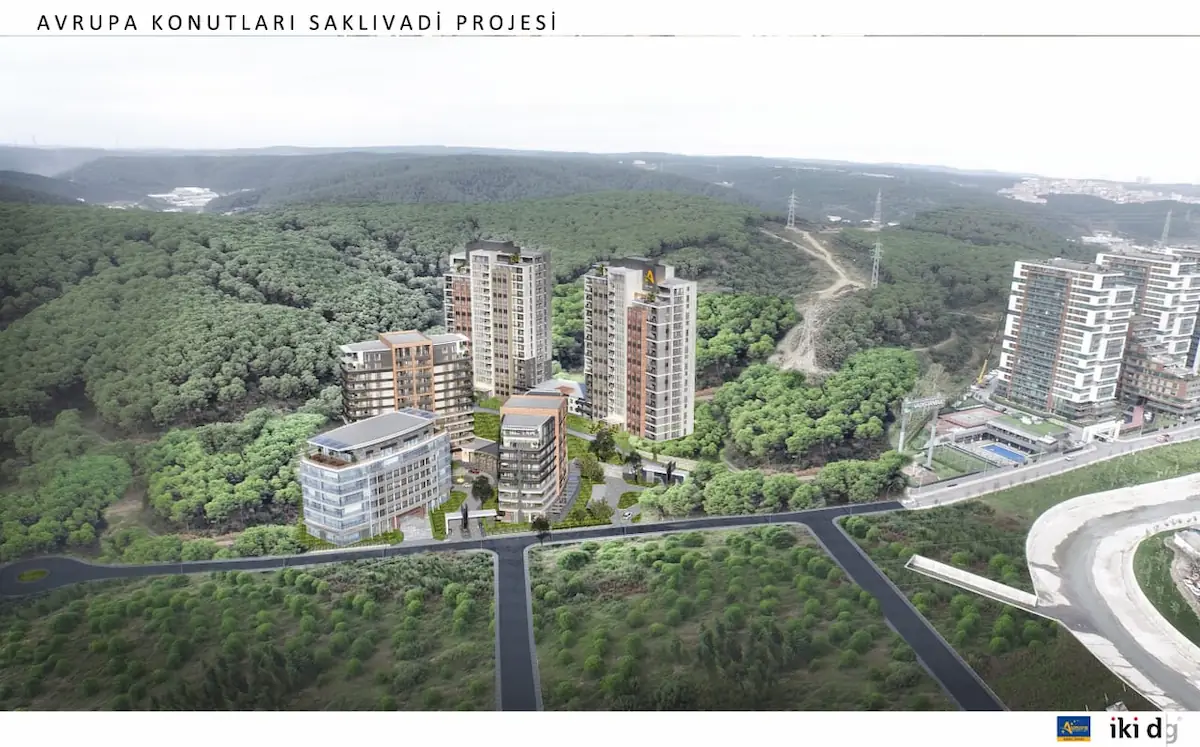
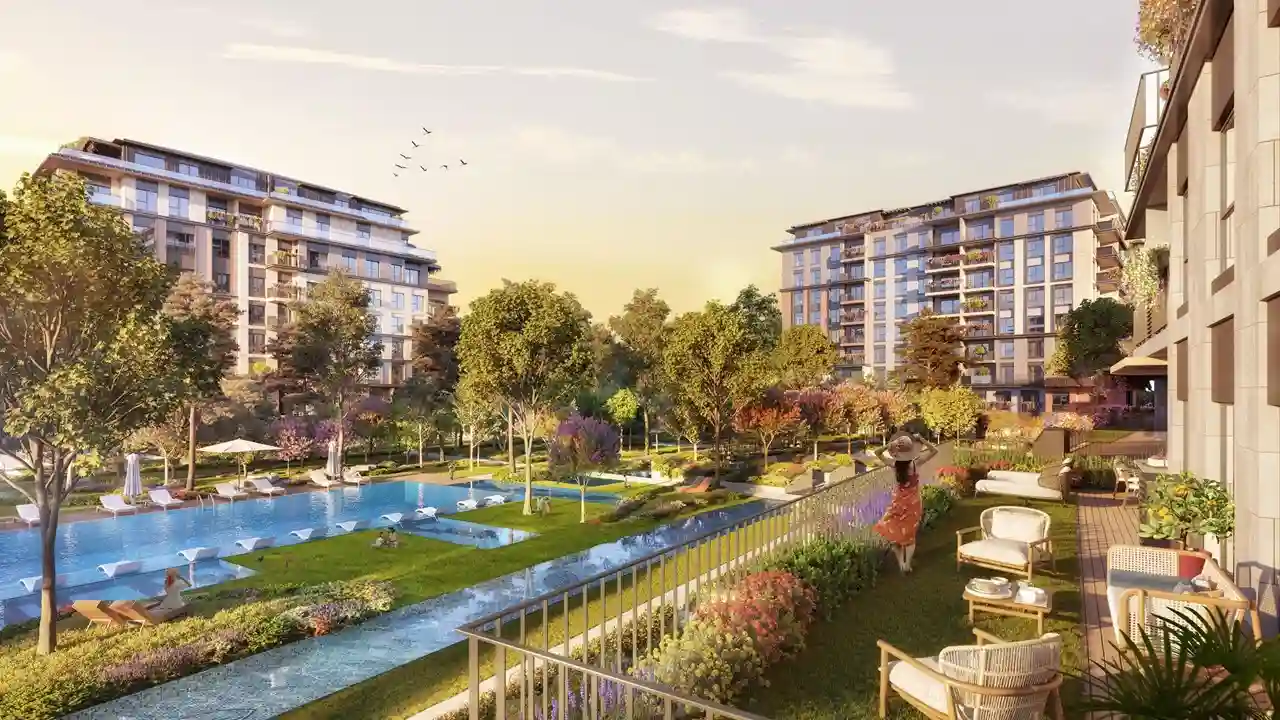
Projects Have same ROI in This Area
.webp)

Have Question Or Suggestion ?
Please Share Your Thought, To Make It Real


