Return on Investment In Turkey
We are providing a financial metric for real estate investors as it helps them to determine the profitability of their real estate investment in Turkey
342€
Average Income
285€ - 399€
Min Income - Max Income
175,257€
Cash Price
| Year | Annual Increase | Monthly ROI | Annual ROI |
|---|---|---|---|
| 1 | 2.34 % | 342€ | 4,099€ |
| 2 | 2.92 % | 427€ | 5,124€ |
| 3 | 3.65 % | 534€ | 6,405€ |
| 4 | 4.57 % | 667€ | 8,007€ |
| 5 | 5.71 % | 834€ | 10,008€ |
| 6 | 7.14 % | 1,043€ | 12,510€ |
| 7 | 8.92 % | 1,303€ | 15,638€ |
| 8 | 11.15 % | 1,629€ | 19,547€ |
| 9 | 13.94 % | 2,036€ | 24,434€ |
| 10 | 17.43 % | 2,545€ | 30,543€ |
136,317€ 77%
Total ROI For 10 Years
399€
Max Income
175,257€
Cash Price
| Year | Annual Increase | Monthly ROI | Annual ROI |
|---|---|---|---|
| 1 | 2.73 % | 399€ | 4,783€ |
| 2 | 3.41 % | 498€ | 5,978€ |
| 3 | 4.26 % | 623€ | 7,473€ |
| 4 | 5.33 % | 778€ | 9,341€ |
| 5 | 6.66 % | 973€ | 11,676€ |
| 6 | 8.33 % | 1,216€ | 14,595€ |
| 7 | 10.41 % | 1,520€ | 18,244€ |
| 8 | 13.01 % | 1,900€ | 22,805€ |
| 9 | 16.27 % | 2,376€ | 28,507€ |
| 10 | 20.33 % | 2,969€ | 35,633€ |
159,036€ 90%
Total ROI For 10 Years
285€
Min Income
175,257€
Cash Price
| Year | Annual Increase | Monthly ROI | Annual ROI |
|---|---|---|---|
| 1 | 1.95 % | 285€ | 3,416€ |
| 2 | 2.44 % | 356€ | 4,270€ |
| 3 | 3.05 % | 445€ | 5,338€ |
| 4 | 3.81 % | 556€ | 6,672€ |
| 5 | 4.76 % | 695€ | 8,340€ |
| 6 | 5.95 % | 869€ | 10,425€ |
| 7 | 7.44 % | 1,086€ | 13,032€ |
| 8 | 9.29 % | 1,357€ | 16,290€ |
| 9 | 11.62 % | 1,697€ | 20,362€ |
| 10 | 14.52 % | 2,121€ | 25,452€ |
113,597€ 64%
Total ROI For 10 Years
District Classification
Rating
B+
Area map
Statistics
Population
44,001
Social Status
Married : 62%
Unmarried : 27%
area
138 Km2
Price Changes Over Last 5 Years
1 Year Change
10.99%
3 Year Change
420.1%
5 Year Change
462.4%
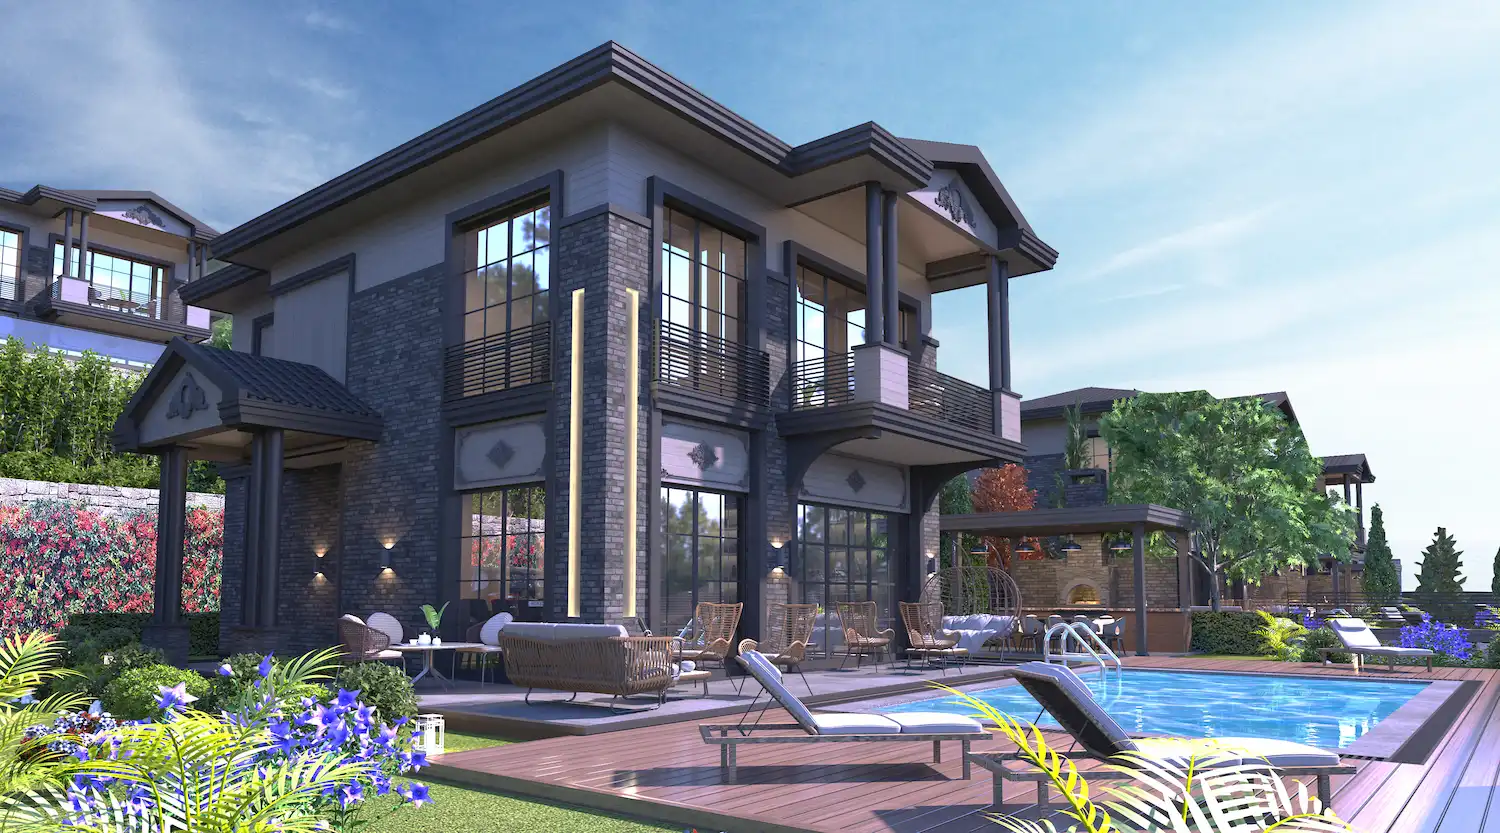
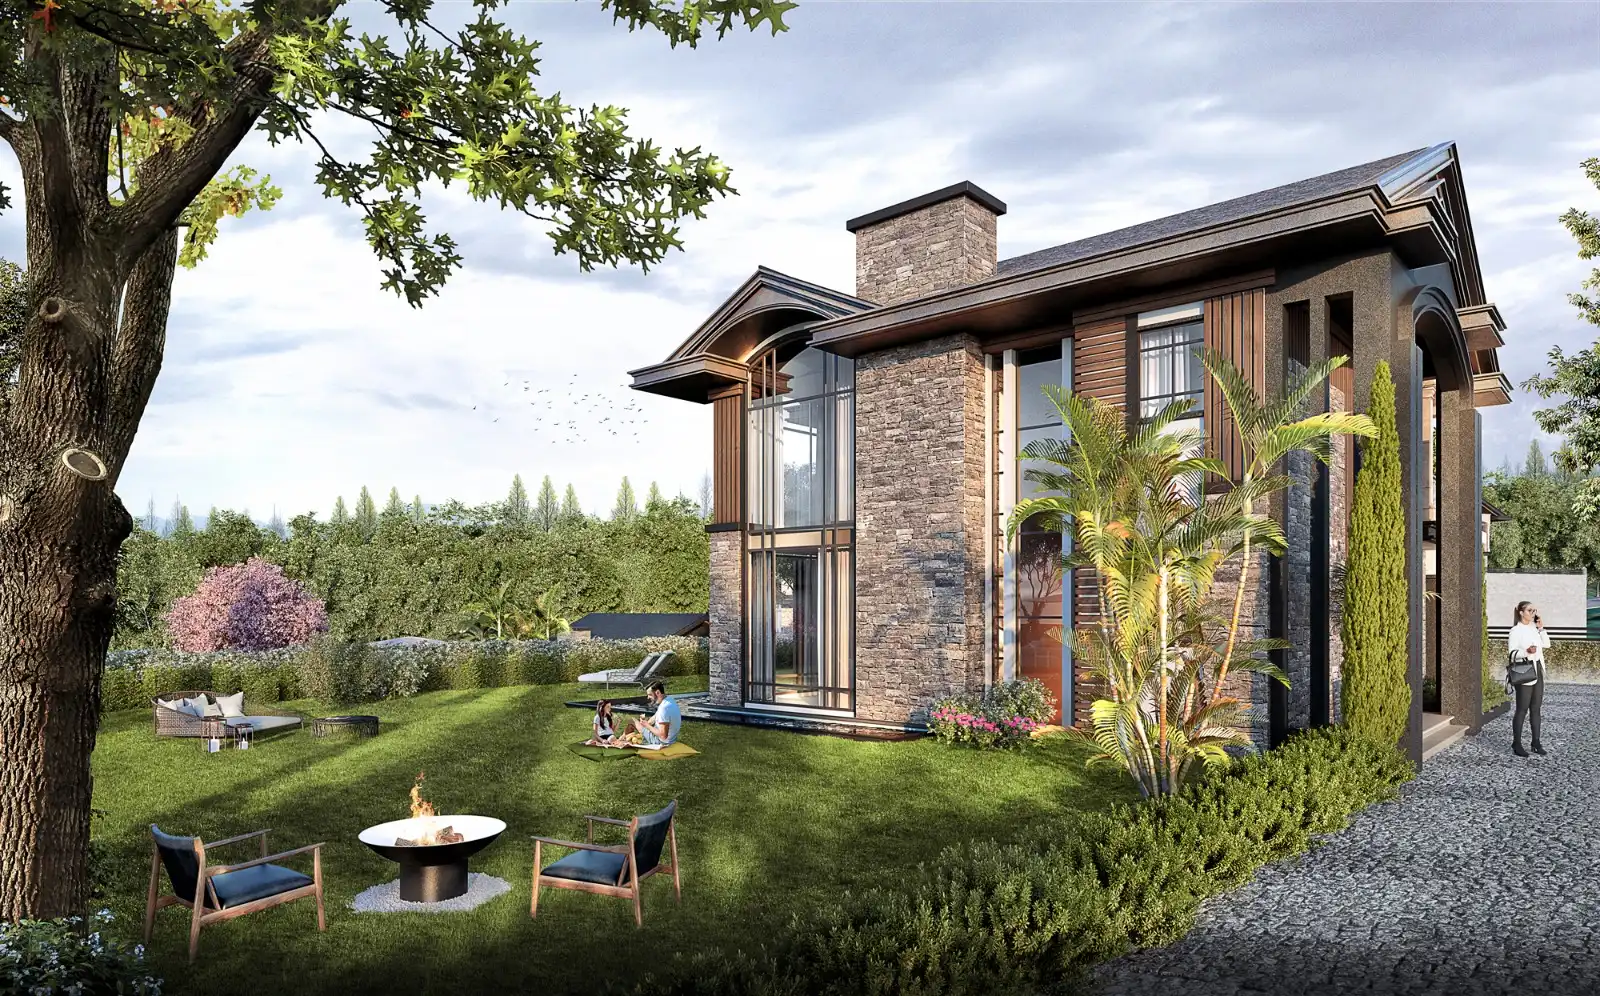
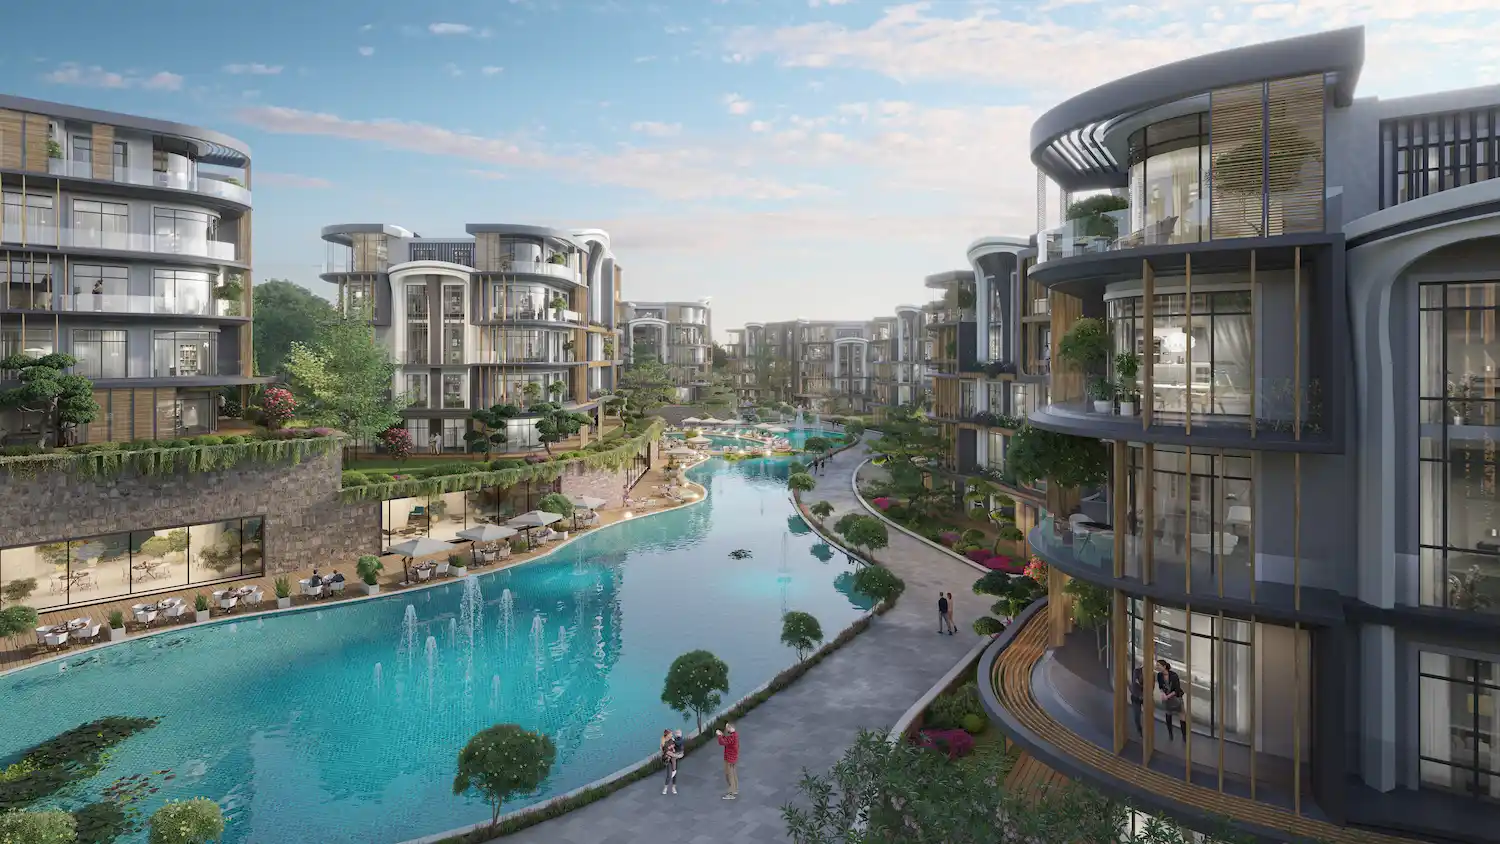
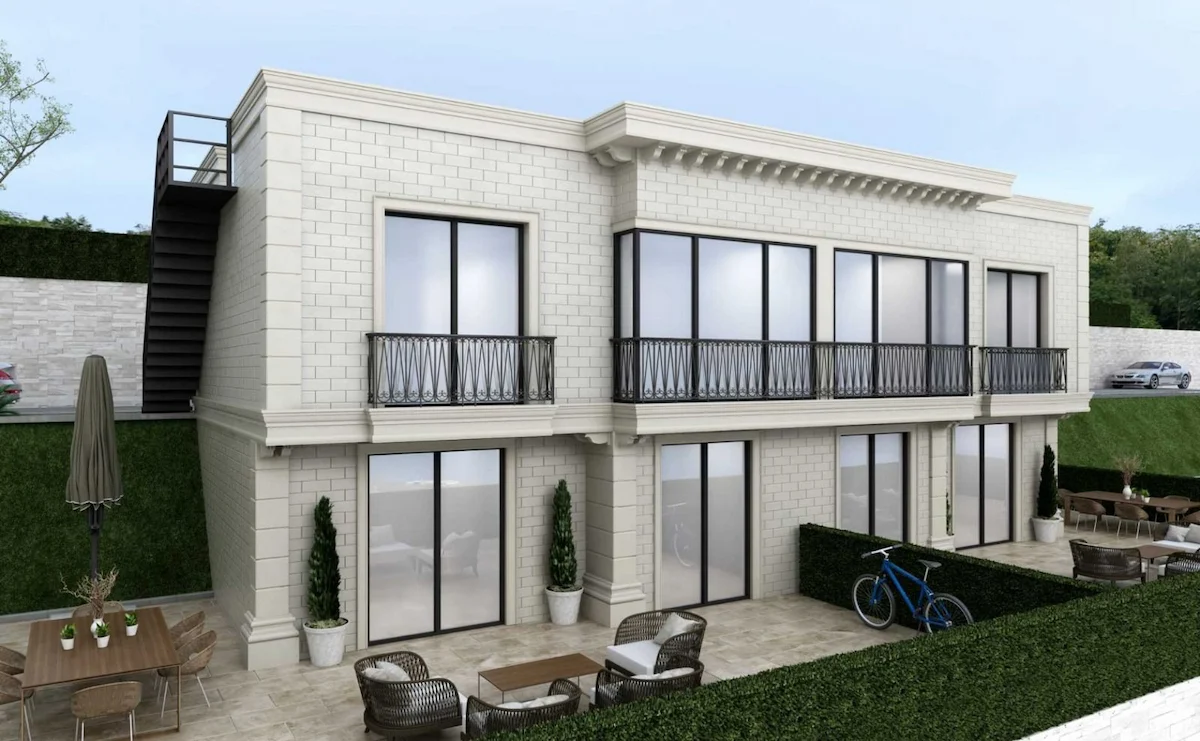
Projects Have same ROI in This Area
Have Question Or Suggestion ?
Please Share Your Thought, To Make It Real


