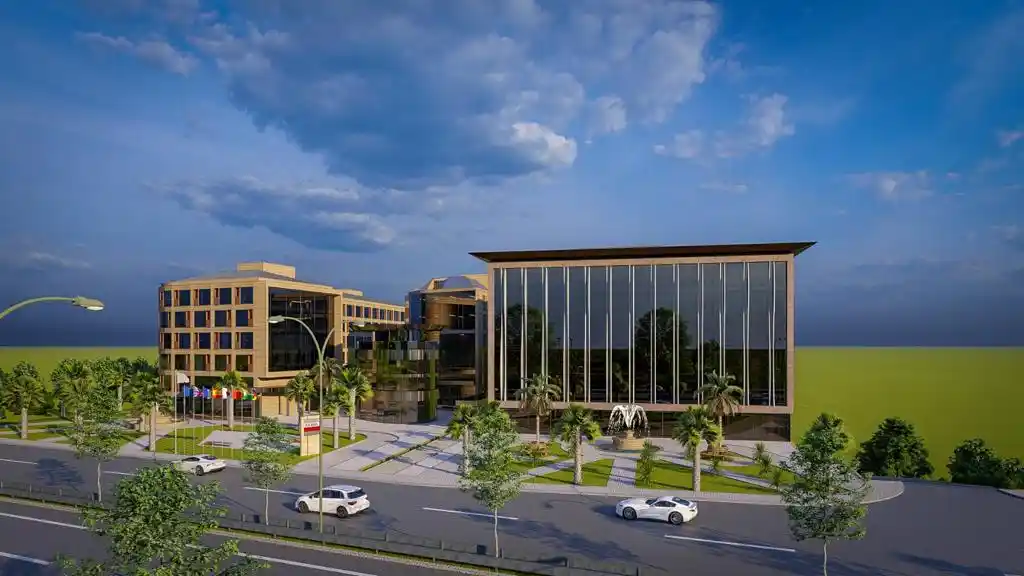
Return on Investment In Turkey
We are providing a financial metric for real estate investors as it helps them to determine the profitability of their real estate investment in Turkey
868$
Average Income
558$ - 1,178$
Min Income - Max Income
150,551$
Cash Price
| Year | Annual Increase | Monthly ROI | Annual ROI |
|---|---|---|---|
| 1 | 6.92 % | 868$ | 10,413$ |
| 2 | 8.65 % | 1,085$ | 13,016$ |
| 3 | 10.81 % | 1,356$ | 16,270$ |
| 4 | 13.51 % | 1,695$ | 20,338$ |
| 5 | 16.89 % | 2,119$ | 25,423$ |
| 6 | 21.11 % | 2,648$ | 31,778$ |
| 7 | 26.38 % | 3,310$ | 39,723$ |
| 8 | 32.98 % | 4,138$ | 49,654$ |
| 9 | 41.23 % | 5,172$ | 62,067$ |
| 10 | 51.53 % | 6,465$ | 77,584$ |
346,266$ 229%
Total ROI For 10 Years
1,178$
Max Income
150,551$
Cash Price
| Year | Annual Increase | Monthly ROI | Annual ROI |
|---|---|---|---|
| 1 | 9.39 % | 1,178$ | 14,132$ |
| 2 | 11.73 % | 1,472$ | 17,665$ |
| 3 | 14.67 % | 1,840$ | 22,081$ |
| 4 | 18.33 % | 2,300$ | 27,602$ |
| 5 | 22.92 % | 2,875$ | 34,502$ |
| 6 | 28.65 % | 3,594$ | 43,128$ |
| 7 | 35.81 % | 4,492$ | 53,910$ |
| 8 | 44.76 % | 5,616$ | 67,387$ |
| 9 | 55.95 % | 7,019$ | 84,234$ |
| 10 | 69.94 % | 8,774$ | 105,292$ |
469,932$ 312%
Total ROI For 10 Years
558$
Min Income
150,551$
Cash Price
| Year | Annual Increase | Monthly ROI | Annual ROI |
|---|---|---|---|
| 1 | 4.45 % | 558$ | 6,694$ |
| 2 | 5.56 % | 697$ | 8,368$ |
| 3 | 6.95 % | 872$ | 10,460$ |
| 4 | 8.68 % | 1,090$ | 13,074$ |
| 5 | 10.86 % | 1,362$ | 16,343$ |
| 6 | 13.57 % | 1,702$ | 20,429$ |
| 7 | 16.96 % | 2,128$ | 25,536$ |
| 8 | 21.20 % | 2,660$ | 31,920$ |
| 9 | 26.50 % | 3,325$ | 39,900$ |
| 10 | 33.13 % | 4,156$ | 49,875$ |
222,600$ 147%
Total ROI For 10 Years
District Classification
Rating
B-
Area map
Statistics
Population
711,894
Social Status
Married : 63%
Unmarried : 28%
area
167 Km2
Price Changes Over Last 5 Years
1 Year Change
17.58%
3 Year Change
281.3%
5 Year Change
294.6%
Projects Have same ROI in This Area
Have Question Or Suggestion ?
Please Share Your Thought, To Make It Real
.webp)
.webp)
