Return on Investment In Turkey
We are providing a financial metric for real estate investors as it helps them to determine the profitability of their real estate investment in Turkey
2,850د.إ
Average Income
1,710د.إ - 3,990د.إ
Min Income - Max Income
61,263د.إ
Cash Price
| Year | Annual Increase | Monthly ROI | Annual ROI |
|---|---|---|---|
| 1 | 55.82 % | 2,850د.إ | 34,197د.إ |
| 2 | 69.78 % | 3,562د.إ | 42,746د.إ |
| 3 | 87.22 % | 4,453د.إ | 53,433د.إ |
| 4 | 109.02 % | 5,566د.إ | 66,791د.إ |
| 5 | 136.28 % | 6,957د.إ | 83,489د.إ |
| 6 | 170.35 % | 8,697د.إ | 104,362د.إ |
| 7 | 212.94 % | 10,871د.إ | 130,452د.إ |
| 8 | 266.17 % | 13,589د.إ | 163,065د.إ |
| 9 | 332.72 % | 16,986د.إ | 203,831د.إ |
| 10 | 415.89 % | 21,232د.إ | 254,789د.إ |
1,137,156د.إ 1,856%
Total ROI For 10 Years
3,990د.إ
Max Income
61,263د.إ
Cash Price
| Year | Annual Increase | Monthly ROI | Annual ROI |
|---|---|---|---|
| 1 | 78.15 % | 3,990د.إ | 47,876د.إ |
| 2 | 97.69 % | 4,987د.إ | 59,845د.إ |
| 3 | 122.11 % | 6,234د.إ | 74,806د.إ |
| 4 | 152.63 % | 7,792د.إ | 93,508د.إ |
| 5 | 190.79 % | 9,740د.إ | 116,885د.إ |
| 6 | 238.49 % | 12,176د.إ | 146,106د.إ |
| 7 | 298.11 % | 15,219د.إ | 182,633د.إ |
| 8 | 372.64 % | 19,024د.إ | 228,291د.إ |
| 9 | 465.80 % | 23,780د.إ | 285,364د.إ |
| 10 | 582.25 % | 29,725د.إ | 356,705د.إ |
1,592,018د.إ 2,598%
Total ROI For 10 Years
1,710د.إ
Min Income
61,263د.إ
Cash Price
| Year | Annual Increase | Monthly ROI | Annual ROI |
|---|---|---|---|
| 1 | 33.49 % | 1,710د.إ | 20,518د.إ |
| 2 | 41.87 % | 2,137د.إ | 25,648د.إ |
| 3 | 52.33 % | 2,672د.إ | 32,060د.إ |
| 4 | 65.41 % | 3,340د.إ | 40,075د.إ |
| 5 | 81.77 % | 4,174د.إ | 50,094د.إ |
| 6 | 102.21 % | 5,218د.إ | 62,617د.إ |
| 7 | 127.76 % | 6,523د.إ | 78,271د.إ |
| 8 | 159.70 % | 8,153د.إ | 97,839د.إ |
| 9 | 199.63 % | 10,192د.إ | 122,299د.إ |
| 10 | 249.54 % | 12,739د.إ | 152,873د.إ |
682,294د.إ 1,113%
Total ROI For 10 Years
District Classification
Rating
a
Area map
Statistics
Population
448,882
Social Status
Married : 56%
Unmarried : 46%
area
52 Km2
Price Changes Over Last 5 Years
1 Year Change
13.64%
3 Year Change
339%
5 Year Change
370.8%
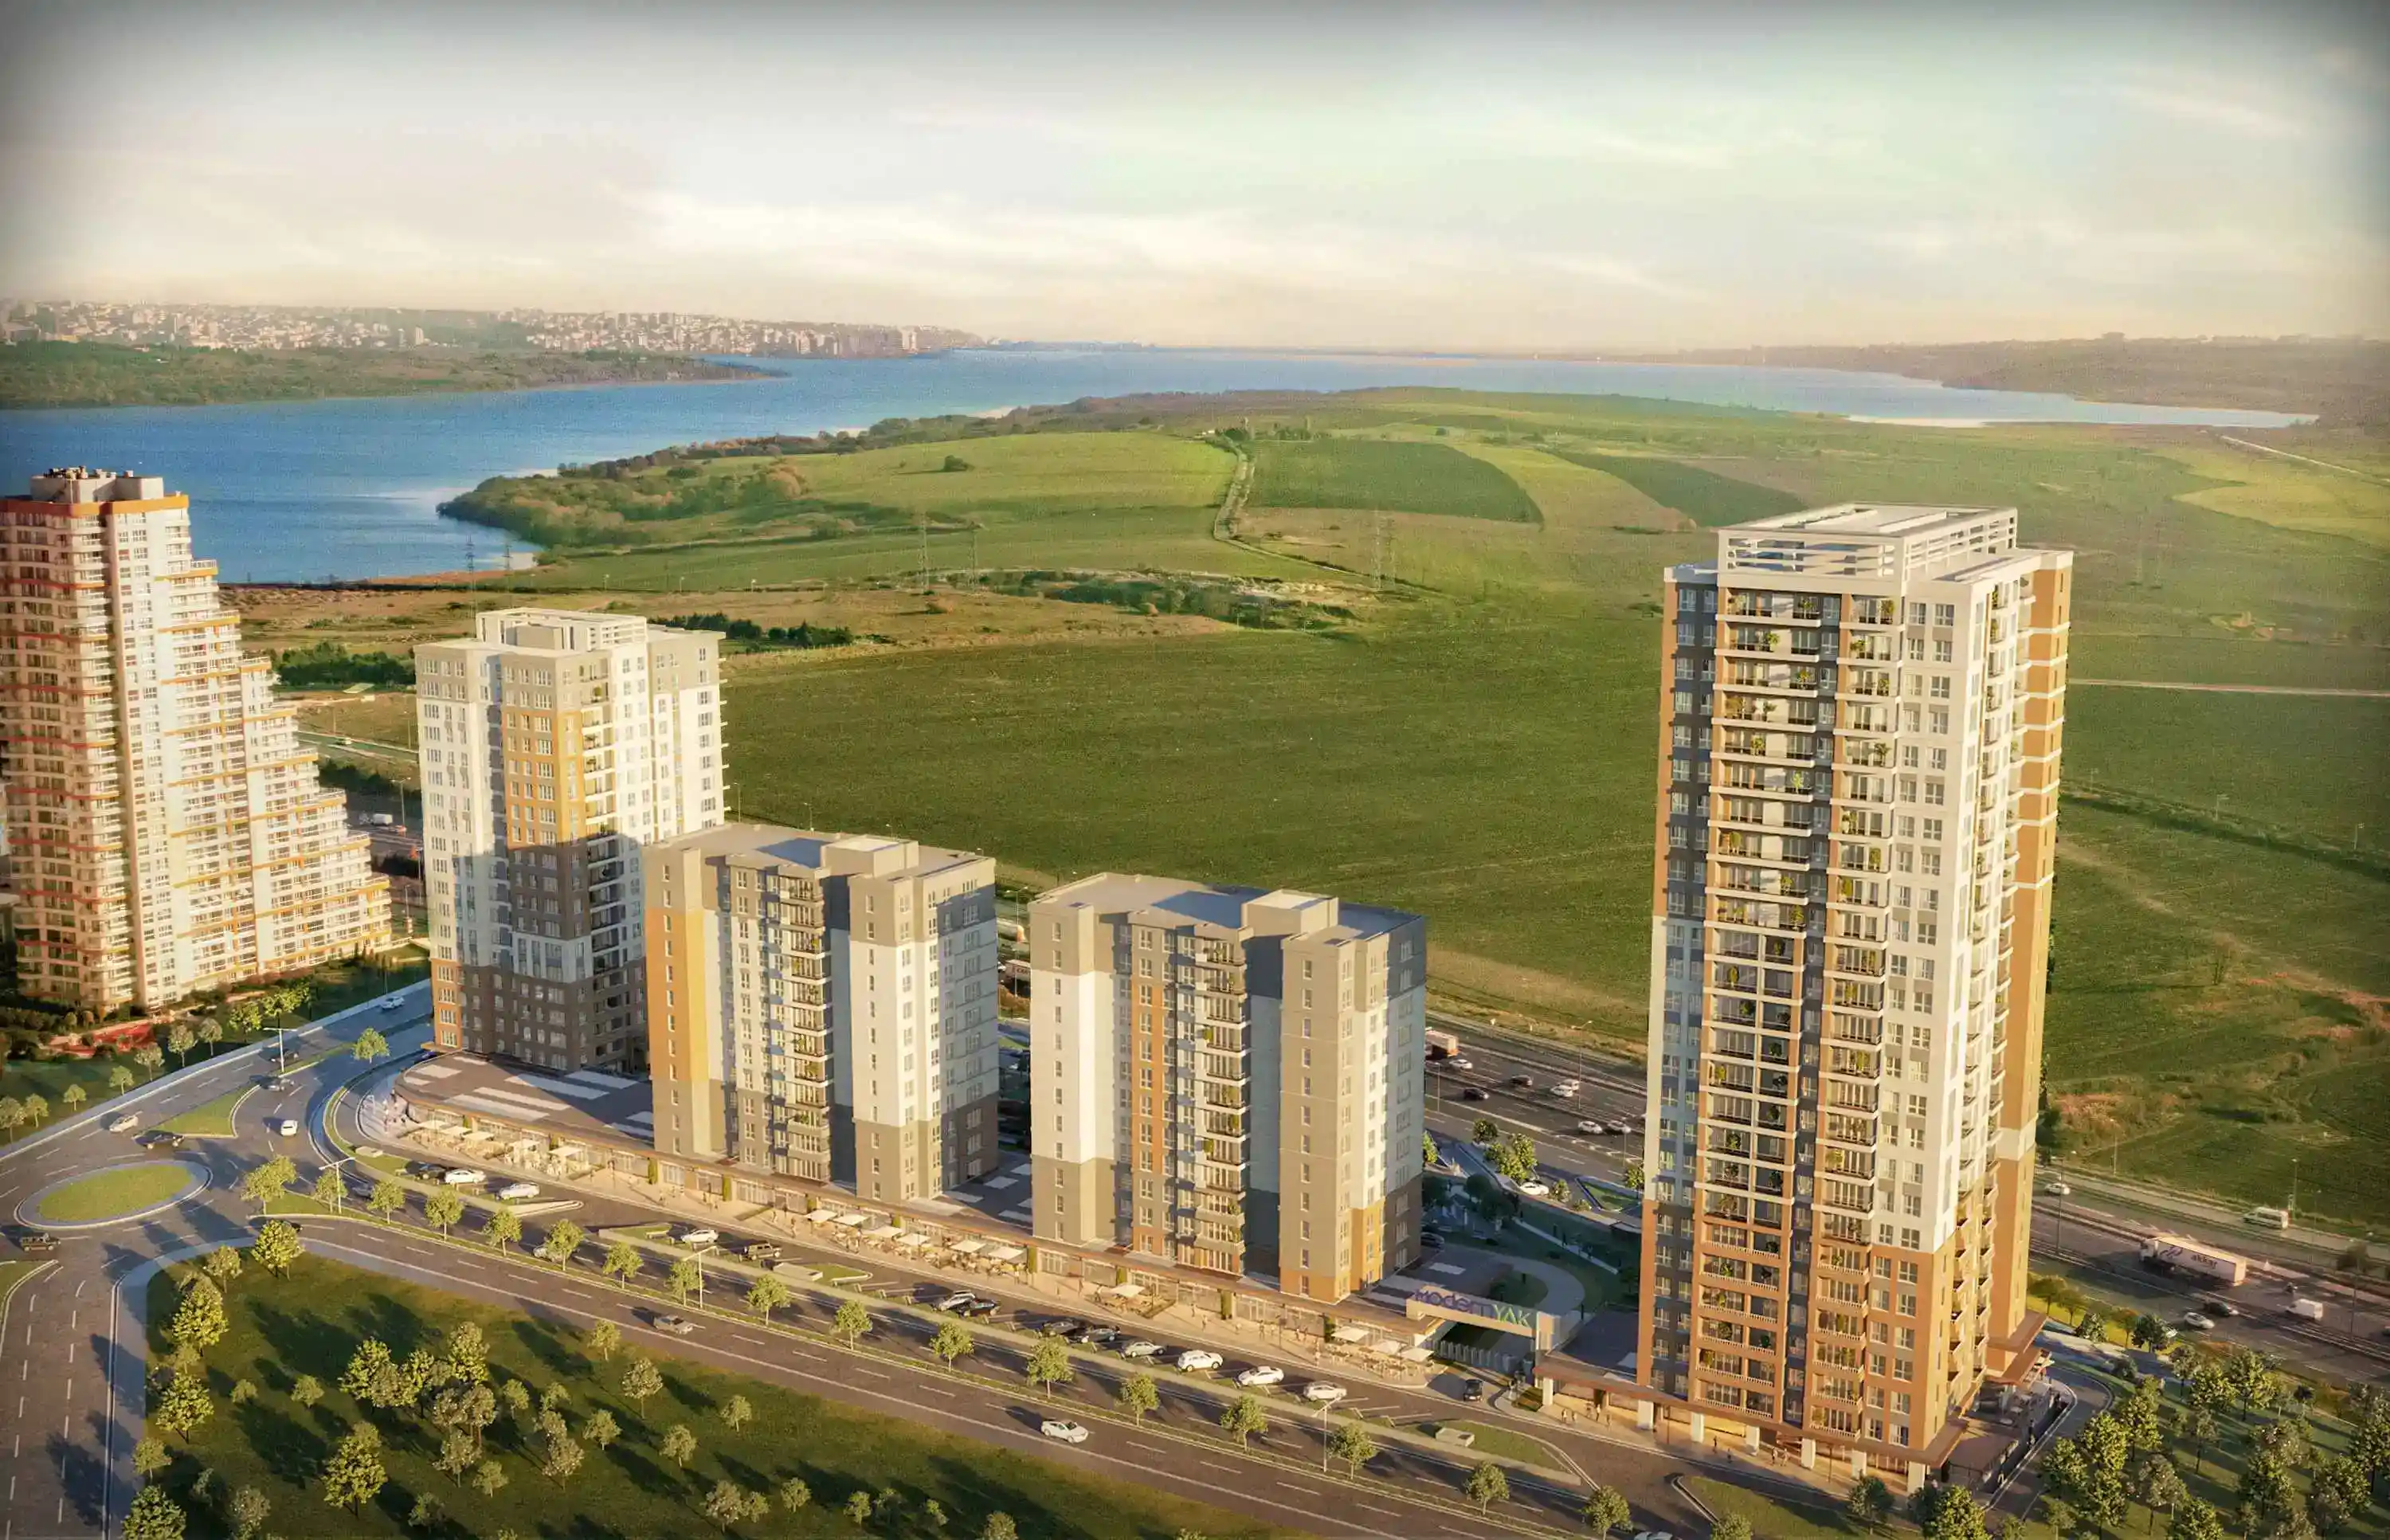
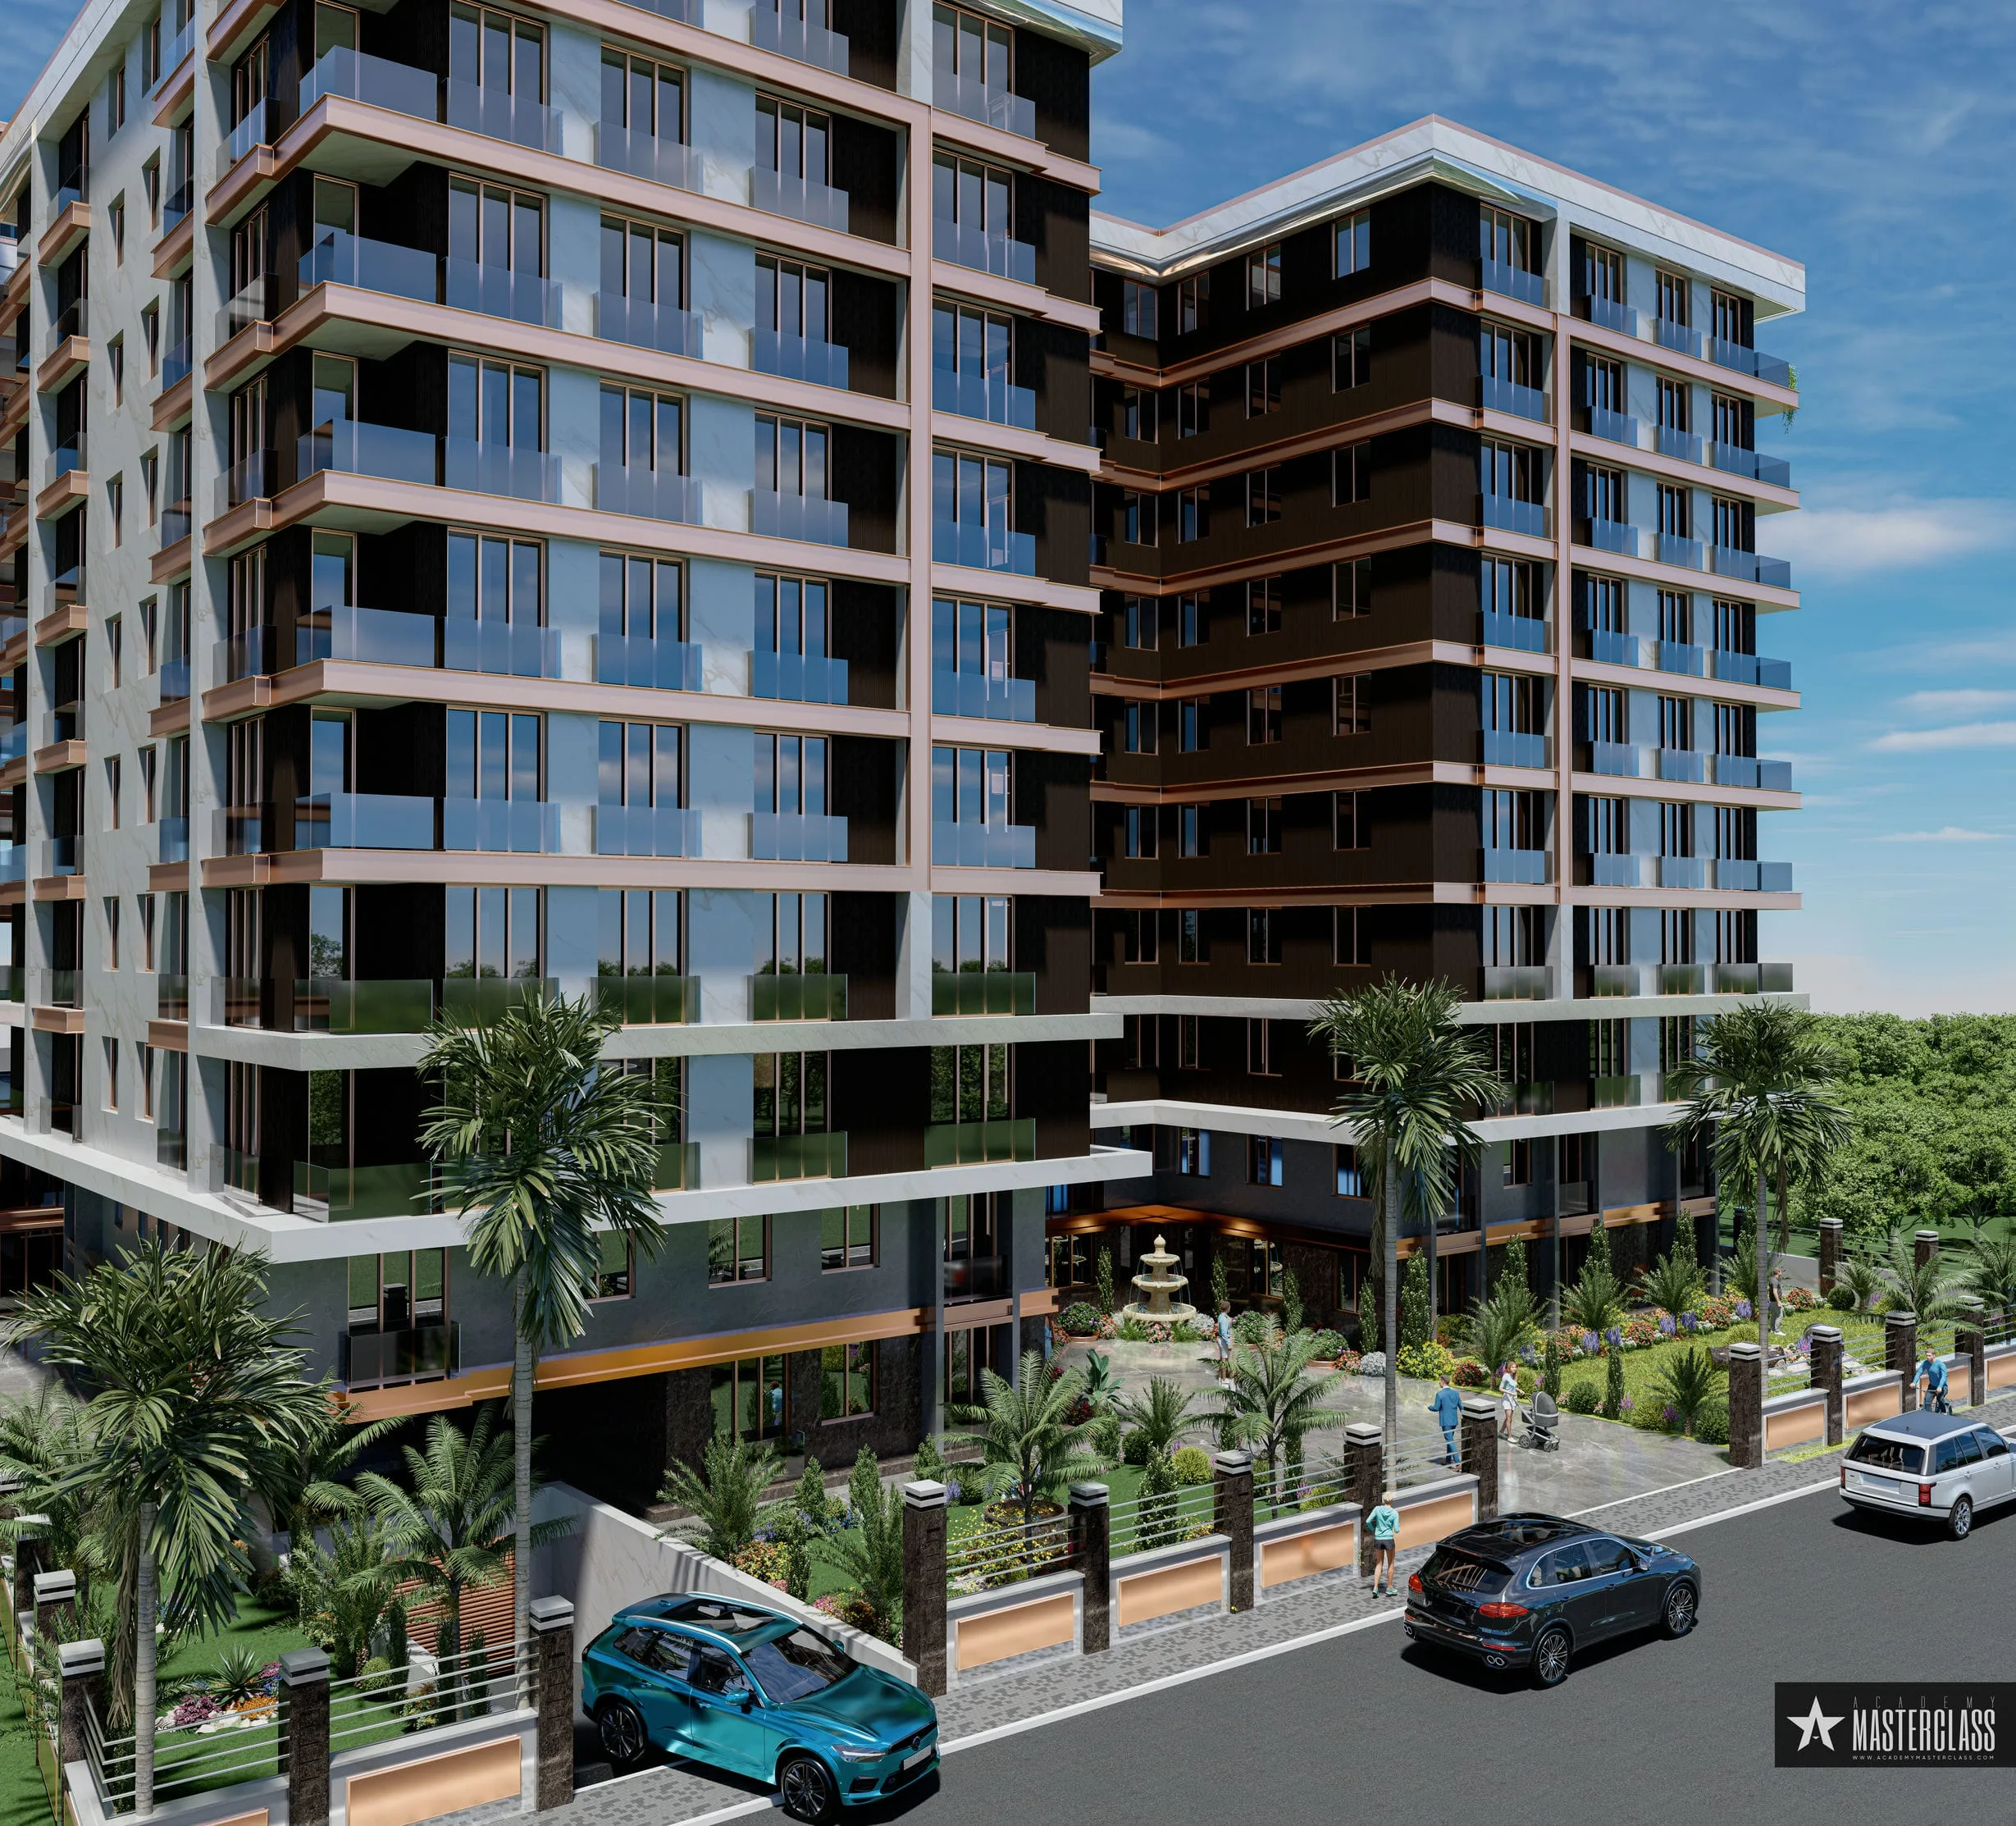
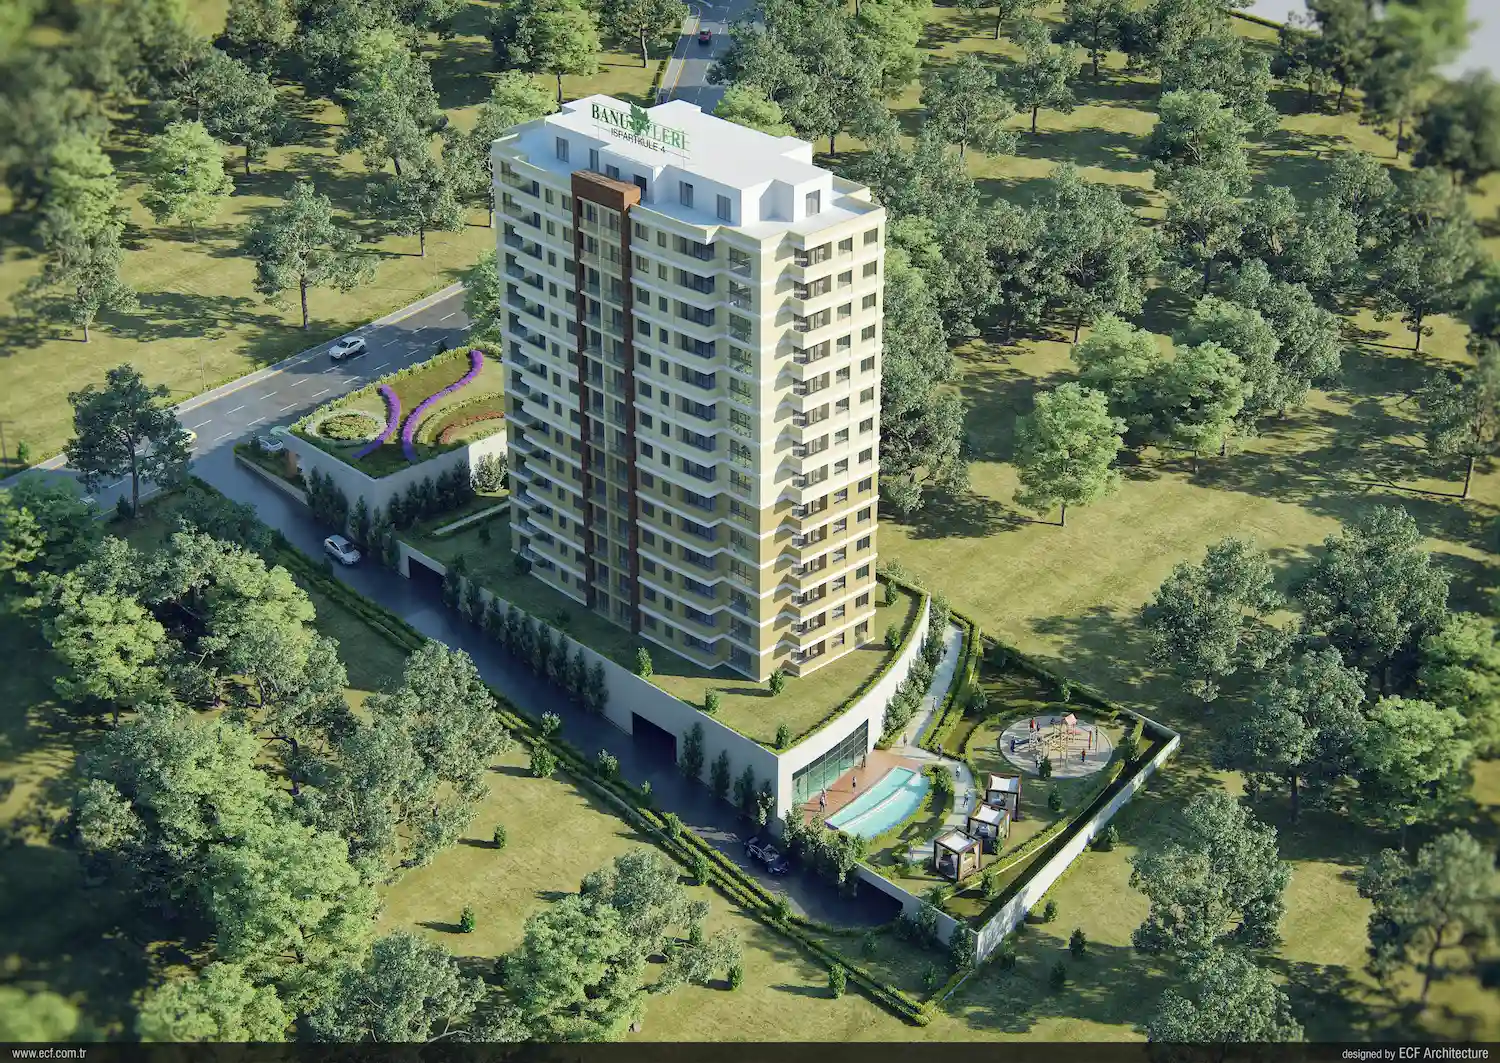
Projects Have same ROI in This Area
.webp)

Have Question Or Suggestion ?
Please Share Your Thought, To Make It Real


