Return on Investment In Turkey
We are providing a financial metric for real estate investors as it helps them to determine the profitability of their real estate investment in Turkey
571€
Average Income
428€ - 714€
Min Income - Max Income
68,415€
Cash Price
| Year | Annual Increase | Monthly ROI | Annual ROI |
|---|---|---|---|
| 1 | 10.02 % | 571€ | 6,852€ |
| 2 | 12.52 % | 714€ | 8,565€ |
| 3 | 15.65 % | 892€ | 10,706€ |
| 4 | 19.56 % | 1,115€ | 13,383€ |
| 5 | 24.45 % | 1,394€ | 16,728€ |
| 6 | 30.56 % | 1,743€ | 20,910€ |
| 7 | 38.20 % | 2,178€ | 26,138€ |
| 8 | 47.76 % | 2,723€ | 32,672€ |
| 9 | 59.70 % | 3,403€ | 40,840€ |
| 10 | 74.62 % | 4,254€ | 51,050€ |
227,844€ 333%
Total ROI For 10 Years
714€
Max Income
68,415€
Cash Price
| Year | Annual Increase | Monthly ROI | Annual ROI |
|---|---|---|---|
| 1 | 12.52 % | 714€ | 8,565€ |
| 2 | 15.65 % | 892€ | 10,706€ |
| 3 | 19.56 % | 1,115€ | 13,383€ |
| 4 | 24.45 % | 1,394€ | 16,728€ |
| 5 | 30.56 % | 1,743€ | 20,910€ |
| 6 | 38.20 % | 2,178€ | 26,138€ |
| 7 | 47.76 % | 2,723€ | 32,672€ |
| 8 | 59.70 % | 3,403€ | 40,840€ |
| 9 | 74.62 % | 4,254€ | 51,050€ |
| 10 | 93.27 % | 5,318€ | 63,813€ |
284,804€ 416%
Total ROI For 10 Years
428€
Min Income
68,415€
Cash Price
| Year | Annual Increase | Monthly ROI | Annual ROI |
|---|---|---|---|
| 1 | 7.51 % | 428€ | 5,139€ |
| 2 | 9.39 % | 535€ | 6,424€ |
| 3 | 11.74 % | 669€ | 8,030€ |
| 4 | 14.67 % | 836€ | 10,037€ |
| 5 | 18.34 % | 1,046€ | 12,546€ |
| 6 | 22.92 % | 1,307€ | 15,683€ |
| 7 | 28.65 % | 1,634€ | 19,603€ |
| 8 | 35.82 % | 2,042€ | 24,504€ |
| 9 | 44.77 % | 2,553€ | 30,630€ |
| 10 | 55.96 % | 3,191€ | 38,288€ |
170,883€ 249%
Total ROI For 10 Years
District Classification
Rating
a
Area map
Statistics
Population
448,882
Social Status
Married : 56%
Unmarried : 46%
area
52 Km2
Price Changes Over Last 5 Years
1 Year Change
13.64%
3 Year Change
339%
5 Year Change
370.8%
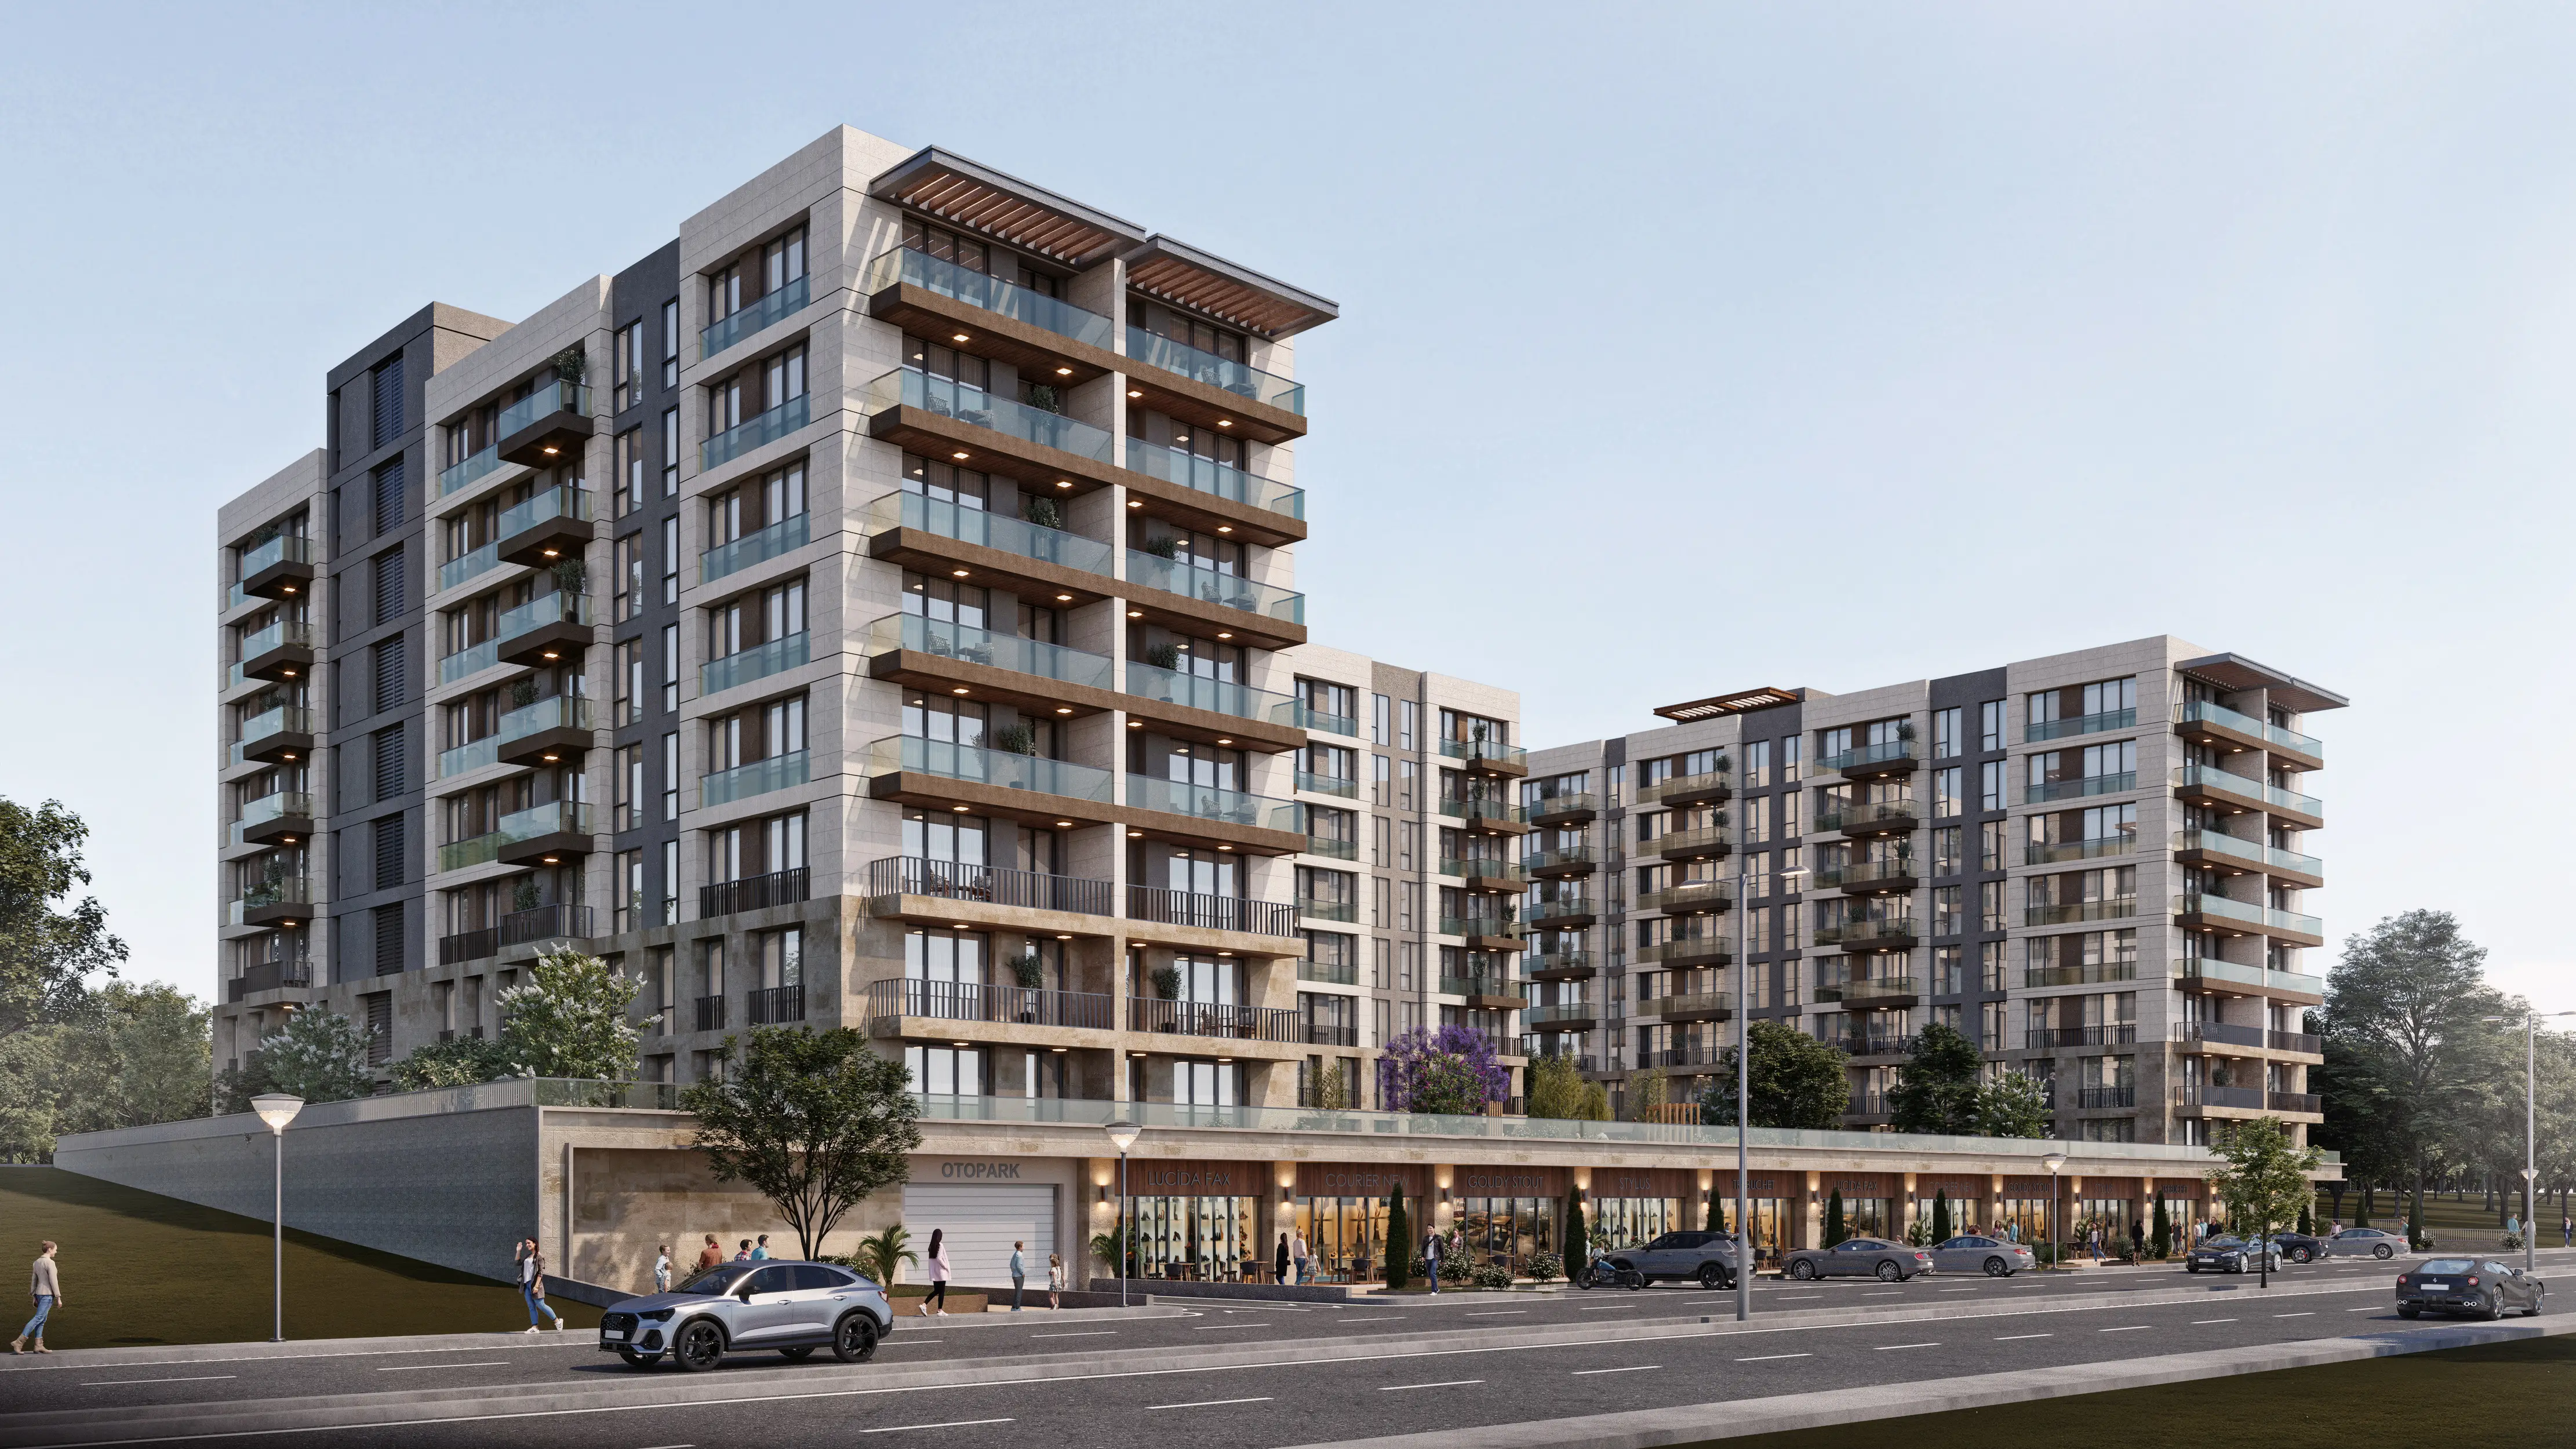
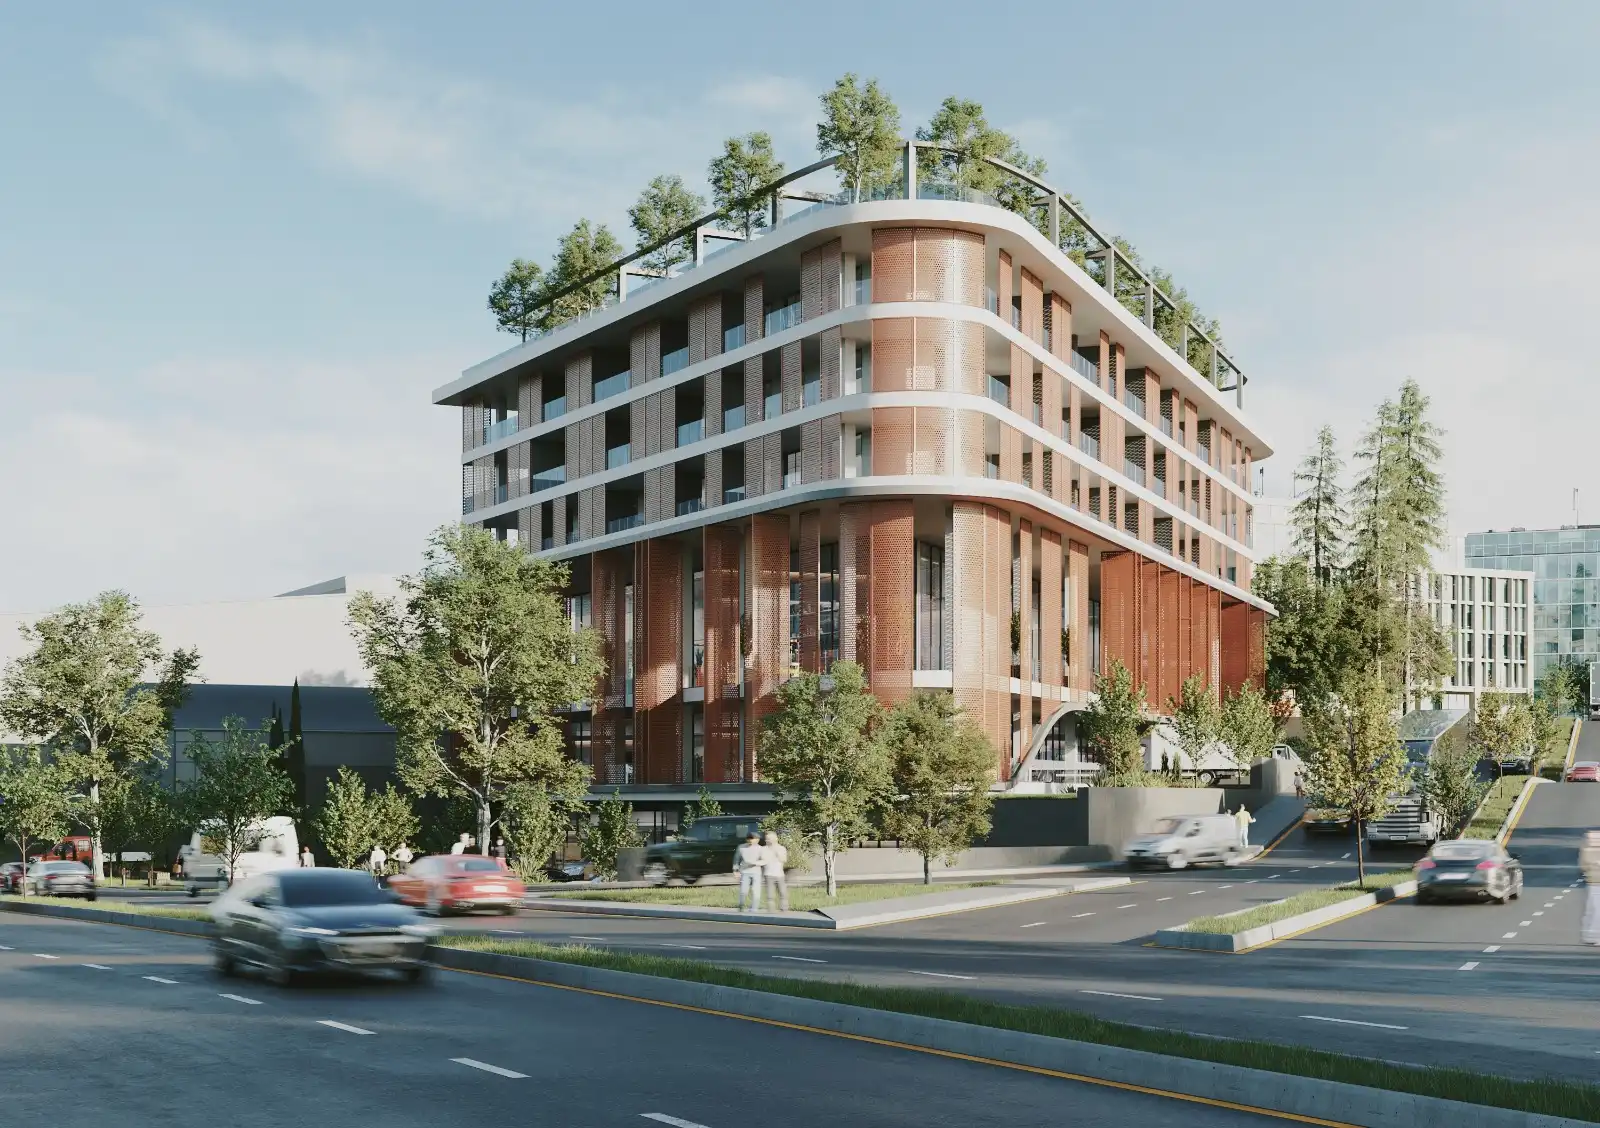
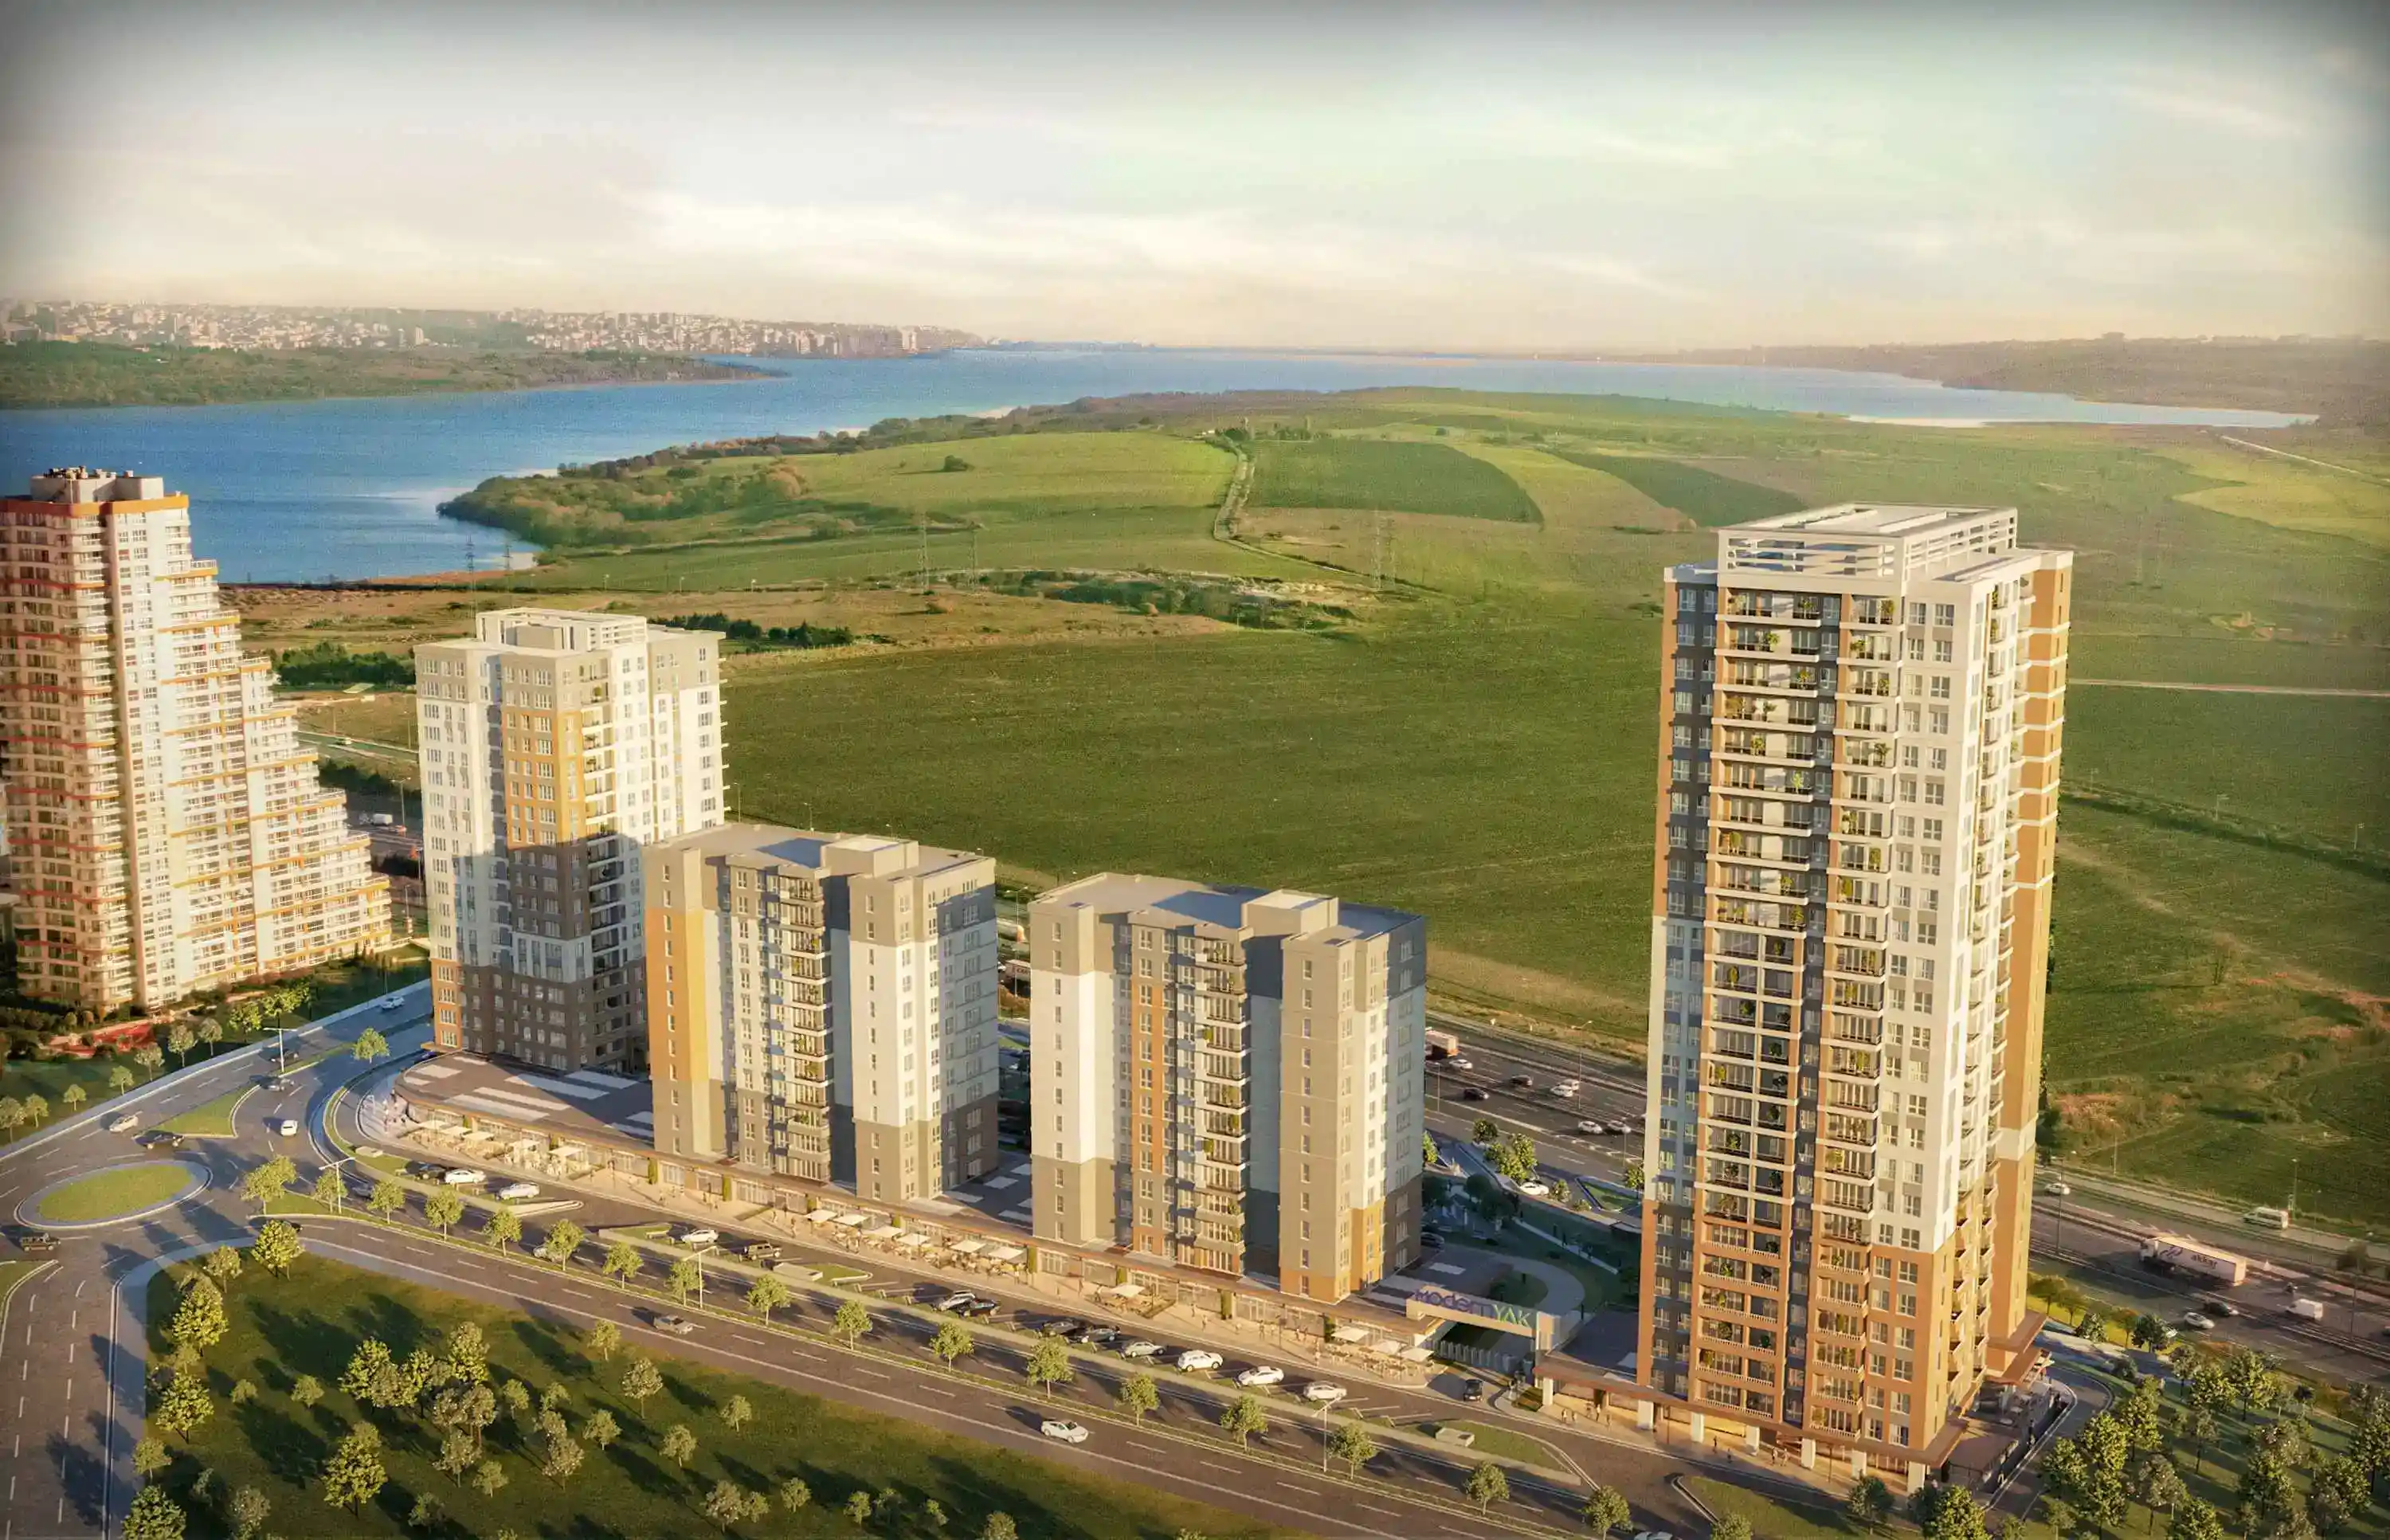
Projects Have same ROI in This Area
.webp)
Have Question Or Suggestion ?
Please Share Your Thought, To Make It Real


