Return on Investment In Turkey
We are providing a financial metric for real estate investors as it helps them to determine the profitability of their real estate investment in Turkey
769$
Average Income
461$ - 1,077$
Min Income - Max Income
90,824$
Cash Price
| Year | Annual Increase | Monthly ROI | Annual ROI |
|---|---|---|---|
| 1 | 10.16 % | 769$ | 9,228$ |
| 2 | 12.70 % | 961$ | 11,536$ |
| 3 | 15.88 % | 1,202$ | 14,420$ |
| 4 | 19.85 % | 1,502$ | 18,024$ |
| 5 | 24.81 % | 1,878$ | 22,530$ |
| 6 | 31.01 % | 2,347$ | 28,163$ |
| 7 | 38.76 % | 2,934$ | 35,204$ |
| 8 | 48.45 % | 3,667$ | 44,005$ |
| 9 | 60.56 % | 4,584$ | 55,006$ |
| 10 | 75.70 % | 5,730$ | 68,758$ |
306,874$ 337%
Total ROI For 10 Years
1,077$
Max Income
90,824$
Cash Price
| Year | Annual Increase | Monthly ROI | Annual ROI |
|---|---|---|---|
| 1 | 14.23 % | 1,077$ | 12,920$ |
| 2 | 17.78 % | 1,346$ | 16,150$ |
| 3 | 22.23 % | 1,682$ | 20,187$ |
| 4 | 27.78 % | 2,103$ | 25,234$ |
| 5 | 34.73 % | 2,629$ | 31,543$ |
| 6 | 43.41 % | 3,286$ | 39,428$ |
| 7 | 54.26 % | 4,107$ | 49,285$ |
| 8 | 67.83 % | 5,134$ | 61,607$ |
| 9 | 84.79 % | 6,417$ | 77,008$ |
| 10 | 105.99 % | 8,022$ | 96,261$ |
429,624$ 473%
Total ROI For 10 Years
461$
Min Income
90,824$
Cash Price
| Year | Annual Increase | Monthly ROI | Annual ROI |
|---|---|---|---|
| 1 | 6.10 % | 461$ | 5,537$ |
| 2 | 7.62 % | 577$ | 6,921$ |
| 3 | 9.53 % | 721$ | 8,652$ |
| 4 | 11.91 % | 901$ | 10,815$ |
| 5 | 14.88 % | 1,127$ | 13,518$ |
| 6 | 18.61 % | 1,408$ | 16,898$ |
| 7 | 23.26 % | 1,760$ | 21,122$ |
| 8 | 29.07 % | 2,200$ | 26,403$ |
| 9 | 36.34 % | 2,750$ | 33,004$ |
| 10 | 45.42 % | 3,438$ | 41,255$ |
184,124$ 202%
Total ROI For 10 Years
District Classification
Rating
a
Area map
Statistics
Population
448,882
Social Status
Married : 56%
Unmarried : 46%
area
52 Km2
Price Changes Over Last 5 Years
1 Year Change
13.64%
3 Year Change
339%
5 Year Change
370.8%
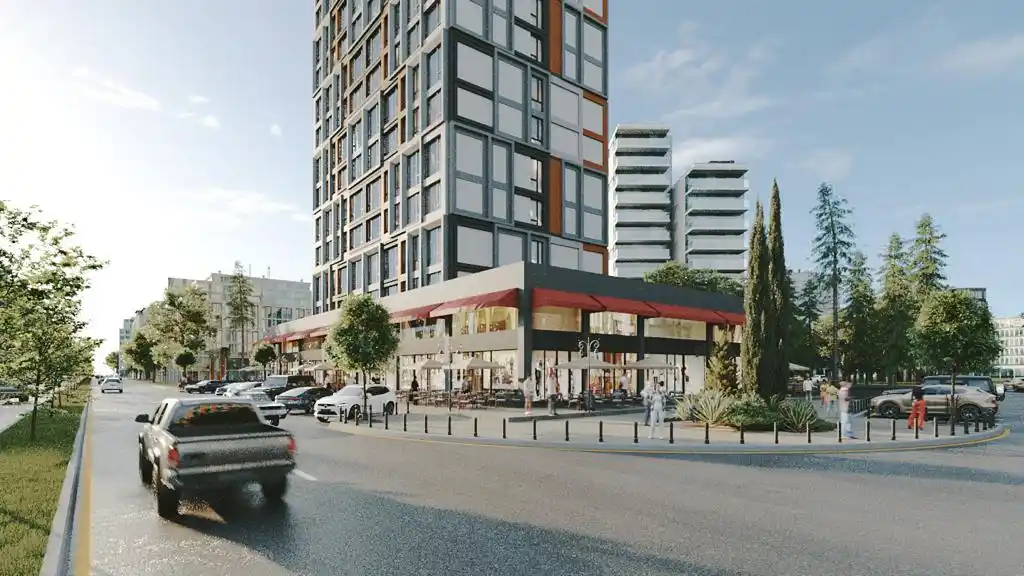
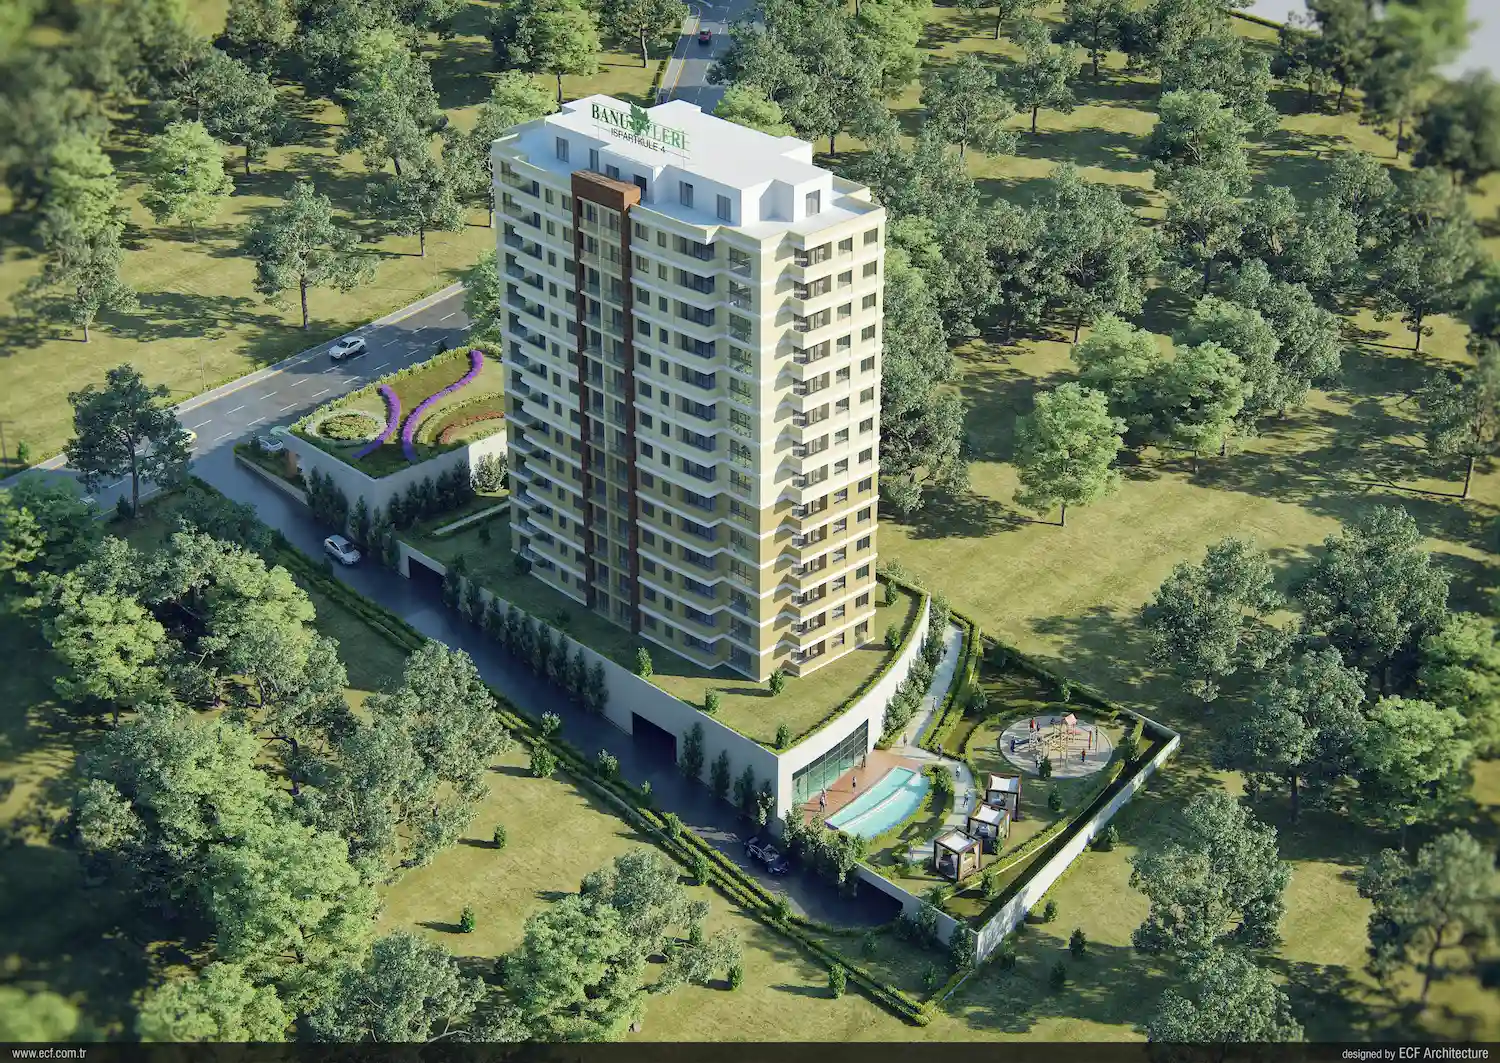
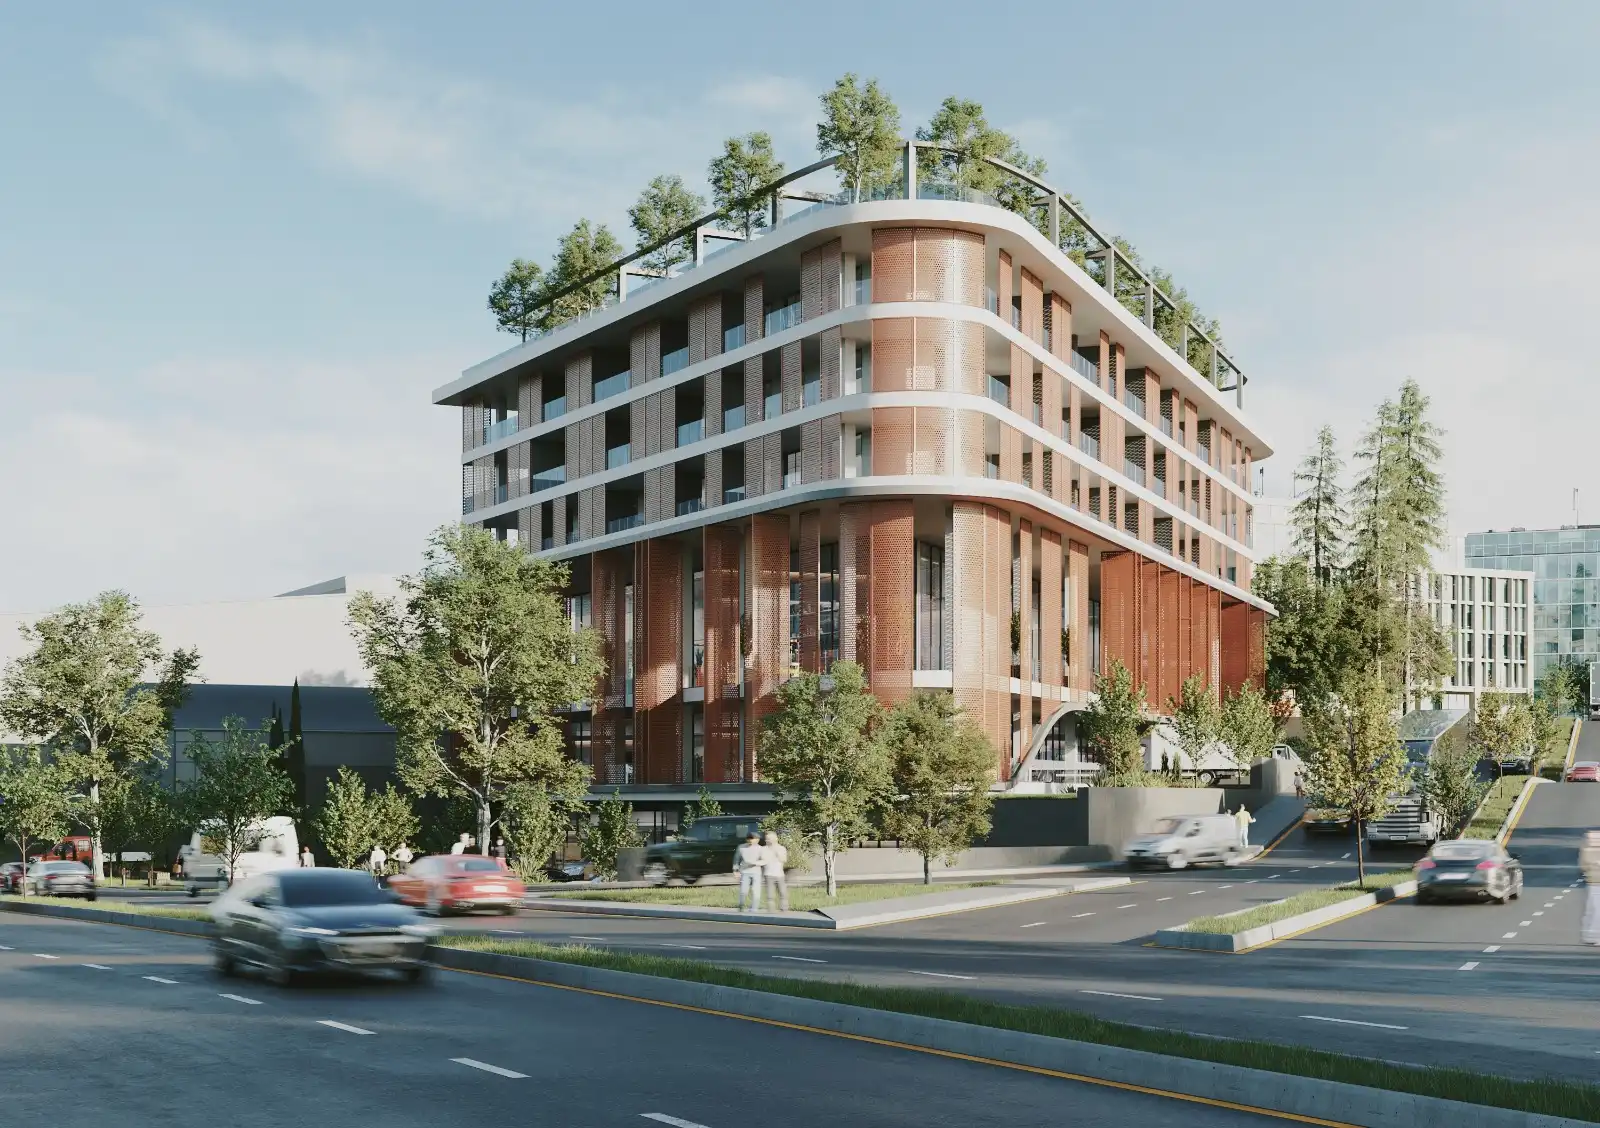
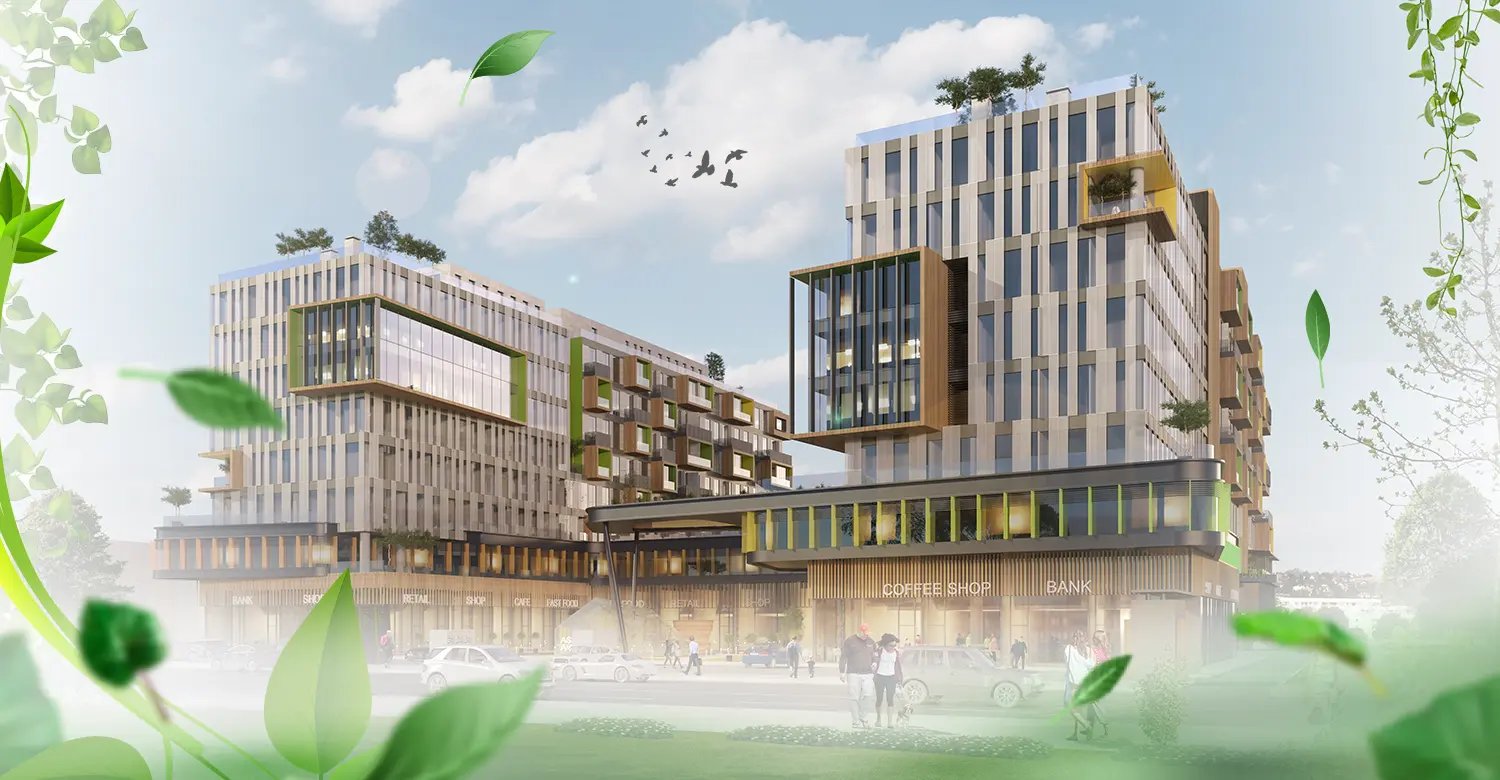
Projects Have same ROI in This Area
.webp)
Have Question Or Suggestion ?
Please Share Your Thought, To Make It Real


