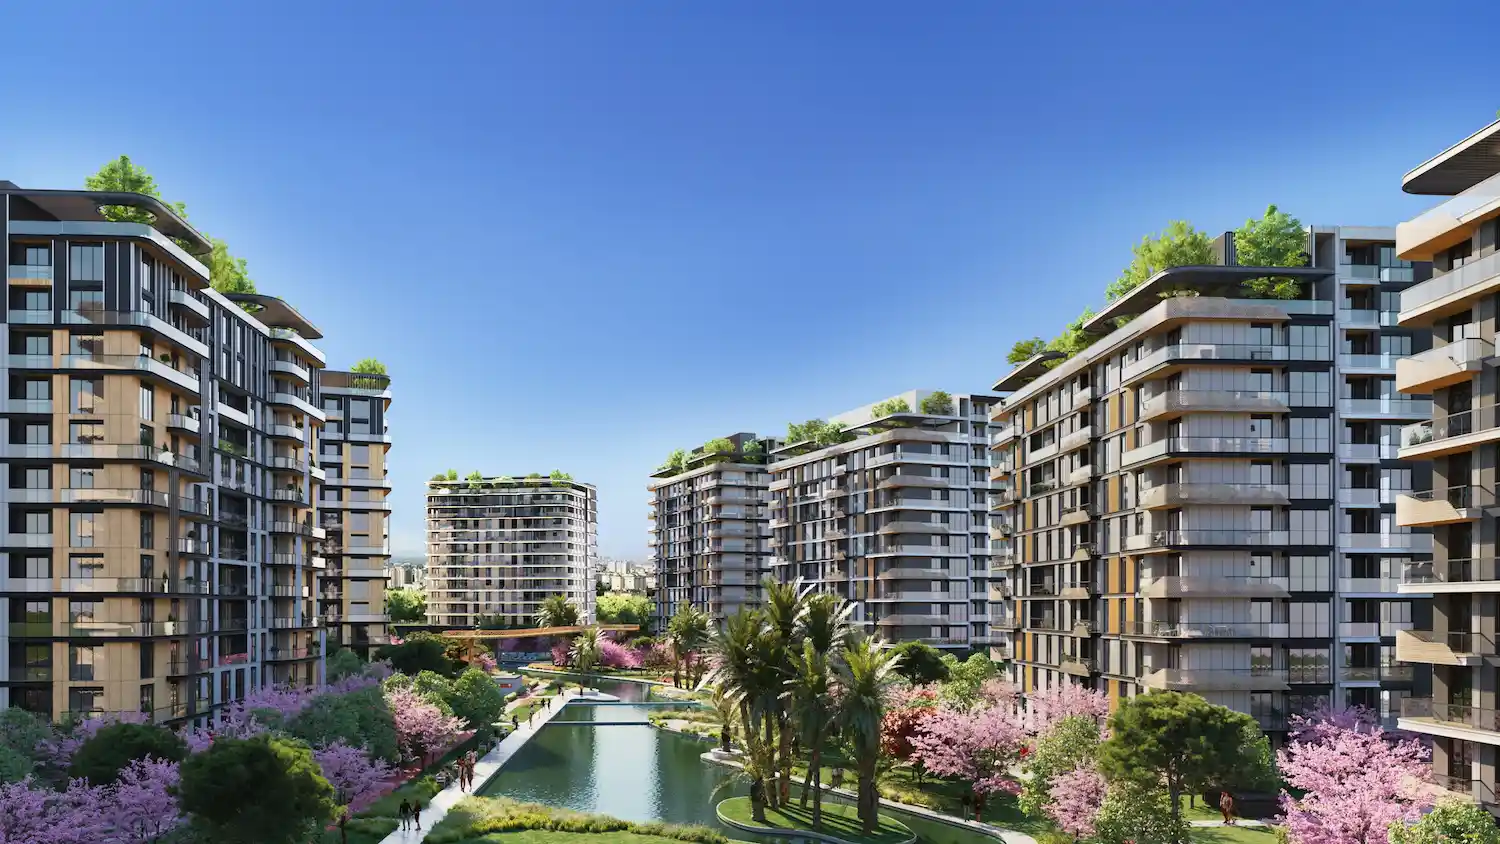
Return on Investment In Turkey
We are providing a financial metric for real estate investors as it helps them to determine the profitability of their real estate investment in Turkey
744$
Average Income
620$ - 867$
Min Income - Max Income
64,958$
Cash Price
| Year | Annual Increase | Monthly ROI | Annual ROI |
|---|---|---|---|
| 1 | 13.74 % | 744$ | 8,922$ |
| 2 | 17.17 % | 929$ | 11,153$ |
| 3 | 21.46 % | 1,162$ | 13,941$ |
| 4 | 26.83 % | 1,452$ | 17,427$ |
| 5 | 33.53 % | 1,815$ | 21,783$ |
| 6 | 41.92 % | 2,269$ | 27,229$ |
| 7 | 52.40 % | 2,836$ | 34,036$ |
| 8 | 65.50 % | 3,545$ | 42,546$ |
| 9 | 81.87 % | 4,432$ | 53,182$ |
| 10 | 102.34 % | 5,540$ | 66,477$ |
296,698$ 456%
Total ROI For 10 Years
867$
Max Income
64,958$
Cash Price
| Year | Annual Increase | Monthly ROI | Annual ROI |
|---|---|---|---|
| 1 | 16.02 % | 867$ | 10,410$ |
| 2 | 20.03 % | 1,084$ | 13,012$ |
| 3 | 25.04 % | 1,355$ | 16,265$ |
| 4 | 31.30 % | 1,694$ | 20,331$ |
| 5 | 39.12 % | 2,118$ | 25,414$ |
| 6 | 48.90 % | 2,647$ | 31,767$ |
| 7 | 61.13 % | 3,309$ | 39,709$ |
| 8 | 76.41 % | 4,136$ | 49,637$ |
| 9 | 95.52 % | 5,170$ | 62,046$ |
| 10 | 119.40 % | 6,463$ | 77,557$ |
346,147$ 532%
Total ROI For 10 Years
620$
Min Income
64,958$
Cash Price
| Year | Annual Increase | Monthly ROI | Annual ROI |
|---|---|---|---|
| 1 | 11.45 % | 620$ | 7,435$ |
| 2 | 14.31 % | 775$ | 9,294$ |
| 3 | 17.88 % | 968$ | 11,618$ |
| 4 | 22.36 % | 1,210$ | 14,522$ |
| 5 | 27.95 % | 1,513$ | 18,153$ |
| 6 | 34.93 % | 1,891$ | 22,691$ |
| 7 | 43.66 % | 2,364$ | 28,364$ |
| 8 | 54.58 % | 2,955$ | 35,455$ |
| 9 | 68.23 % | 3,693$ | 44,318$ |
| 10 | 85.28 % | 4,616$ | 55,398$ |
247,248$ 380%
Total ROI For 10 Years
District Classification
Rating
a
Area map
Statistics
Population
611,059
Social Status
Married : 59%
Unmarried : 30%
area
17 Km2
Price Changes Over Last 5 Years
1 Year Change
16.66%
3 Year Change
254.1%
5 Year Change
291.6%
Projects Have same ROI in This Area
Have Question Or Suggestion ?
Please Share Your Thought, To Make It Real
