Return on Investment In Turkey
We are providing a financial metric for real estate investors as it helps them to determine the profitability of their real estate investment in Turkey
961$
Average Income
775$ - 1,148$
Min Income - Max Income
79,434$
Cash Price
| Year | Annual Increase | Monthly ROI | Annual ROI |
|---|---|---|---|
| 1 | 14.52 % | 961$ | 11,537$ |
| 2 | 18.16 % | 1,202$ | 14,422$ |
| 3 | 22.69 % | 1,502$ | 18,027$ |
| 4 | 28.37 % | 1,878$ | 22,534$ |
| 5 | 35.46 % | 2,347$ | 28,167$ |
| 6 | 44.32 % | 2,934$ | 35,209$ |
| 7 | 55.41 % | 3,668$ | 44,011$ |
| 8 | 69.26 % | 4,584$ | 55,014$ |
| 9 | 86.57 % | 5,731$ | 68,767$ |
| 10 | 108.21 % | 7,163$ | 85,959$ |
383,647$ 482%
Total ROI For 10 Years
1,148$
Max Income
79,434$
Cash Price
| Year | Annual Increase | Monthly ROI | Annual ROI |
|---|---|---|---|
| 1 | 17.34 % | 1,148$ | 13,770$ |
| 2 | 21.67 % | 1,434$ | 17,213$ |
| 3 | 27.09 % | 1,793$ | 21,516$ |
| 4 | 33.86 % | 2,241$ | 26,895$ |
| 5 | 42.32 % | 2,802$ | 33,619$ |
| 6 | 52.90 % | 3,502$ | 42,023$ |
| 7 | 66.13 % | 4,377$ | 52,529$ |
| 8 | 82.66 % | 5,472$ | 65,662$ |
| 9 | 103.33 % | 6,840$ | 82,077$ |
| 10 | 129.16 % | 8,550$ | 102,596$ |
457,901$ 576%
Total ROI For 10 Years
775$
Min Income
79,434$
Cash Price
| Year | Annual Increase | Monthly ROI | Annual ROI |
|---|---|---|---|
| 1 | 11.71 % | 775$ | 9,304$ |
| 2 | 14.64 % | 969$ | 11,630$ |
| 3 | 18.30 % | 1,211$ | 14,538$ |
| 4 | 22.88 % | 1,514$ | 18,172$ |
| 5 | 28.60 % | 1,893$ | 22,715$ |
| 6 | 35.75 % | 2,366$ | 28,394$ |
| 7 | 44.68 % | 2,958$ | 35,493$ |
| 8 | 55.85 % | 3,697$ | 44,366$ |
| 9 | 69.82 % | 4,621$ | 55,458$ |
| 10 | 87.27 % | 5,777$ | 69,322$ |
309,393$ 389%
Total ROI For 10 Years
District Classification
Rating
a+
Area map
Statistics
Population
323,211
Social Status
Married : 55%
Unmarried : 45%
area
5 Km2
Price Changes Over Last 5 Years
1 Year Change
13.62%
3 Year Change
425.8%
5 Year Change
448.2%
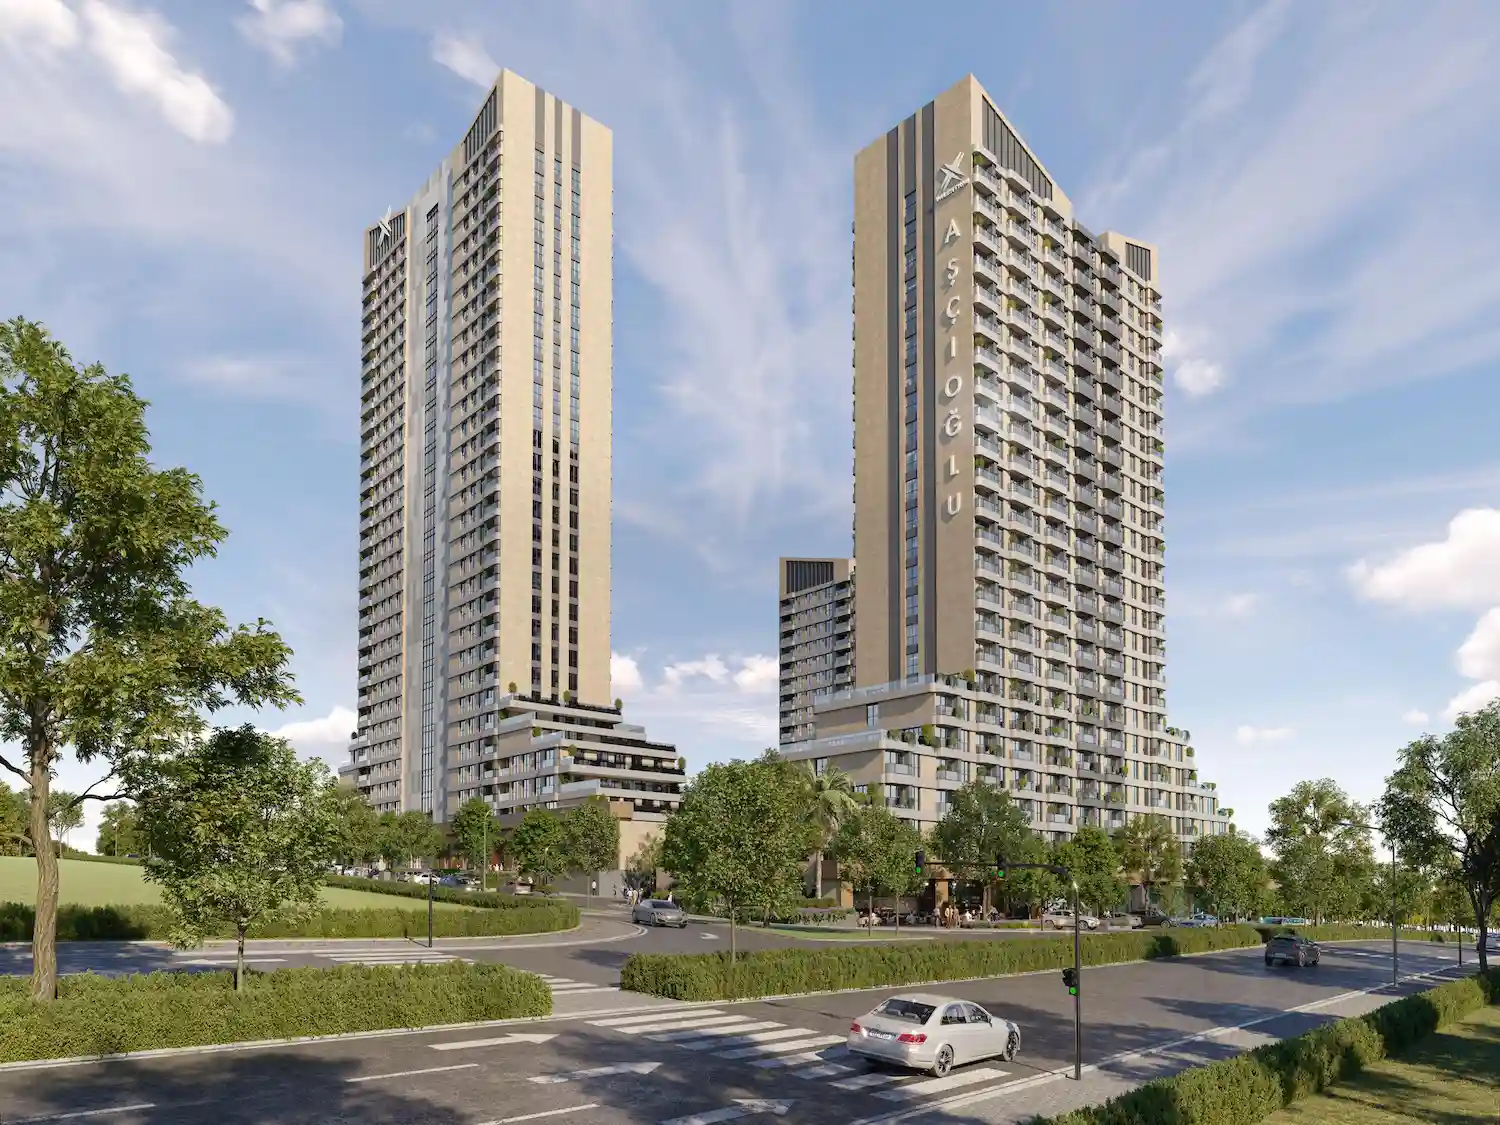
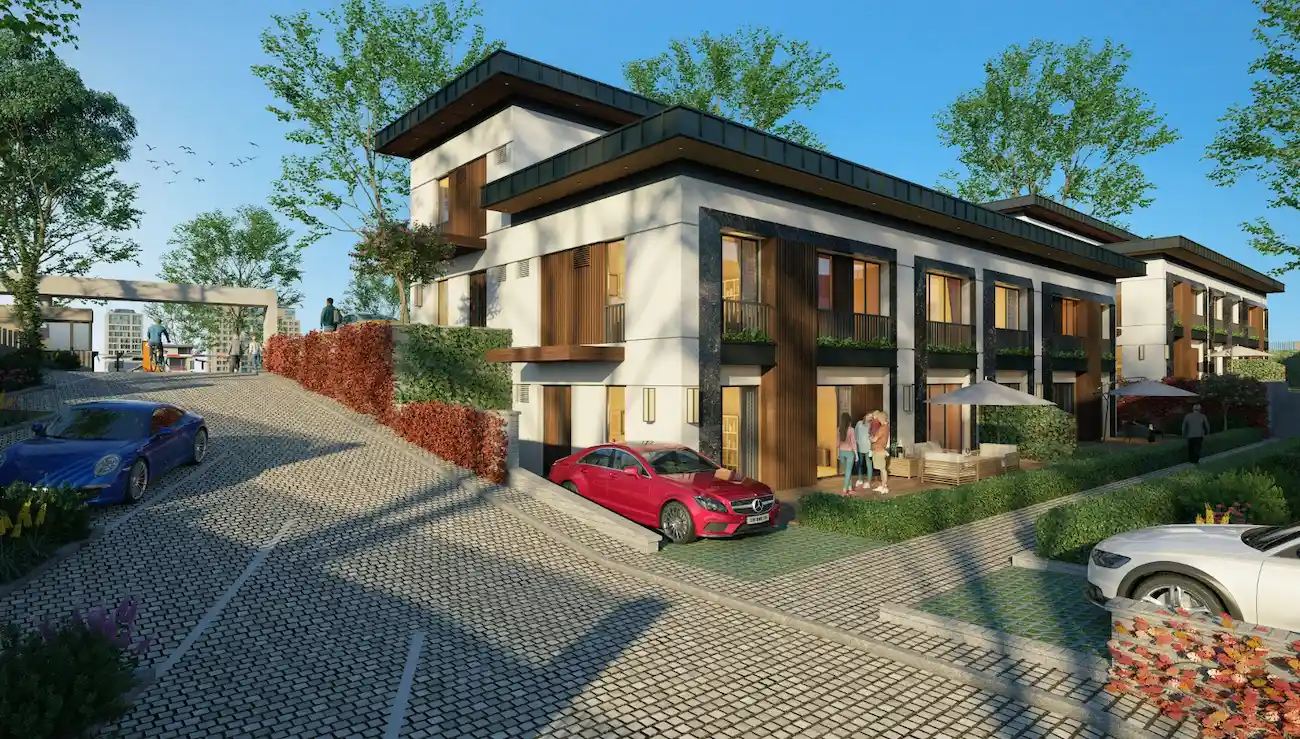
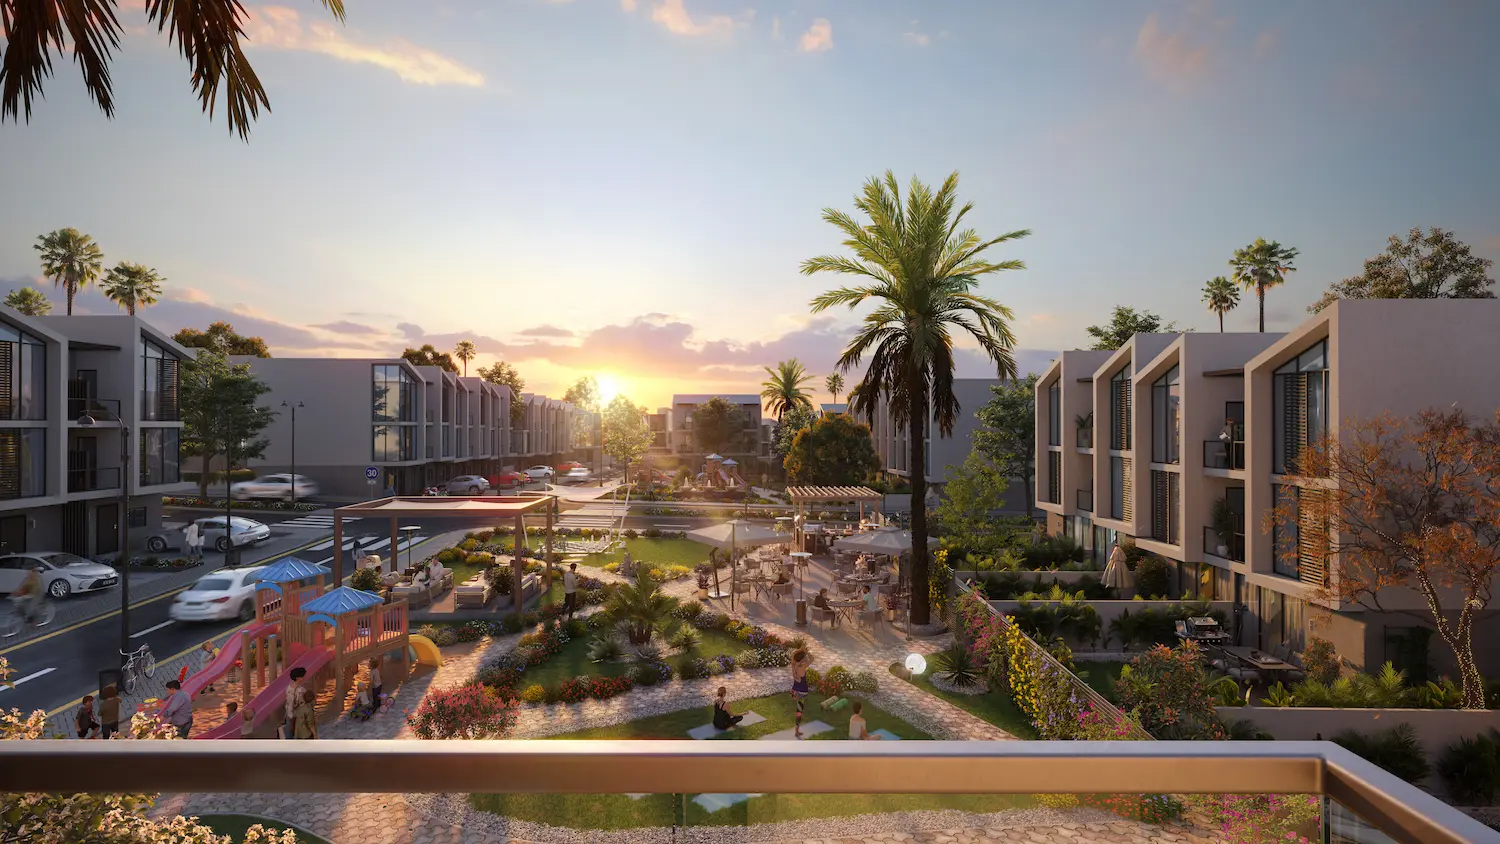
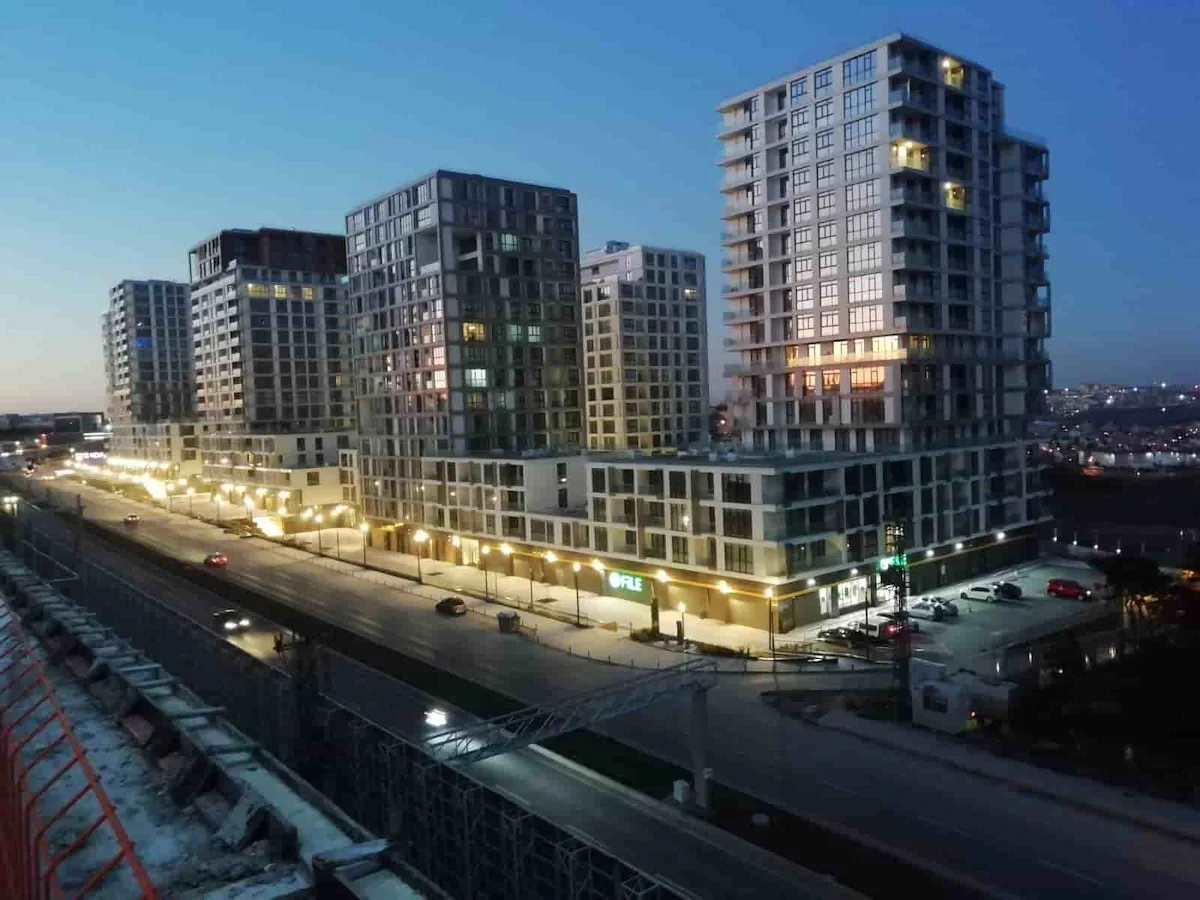
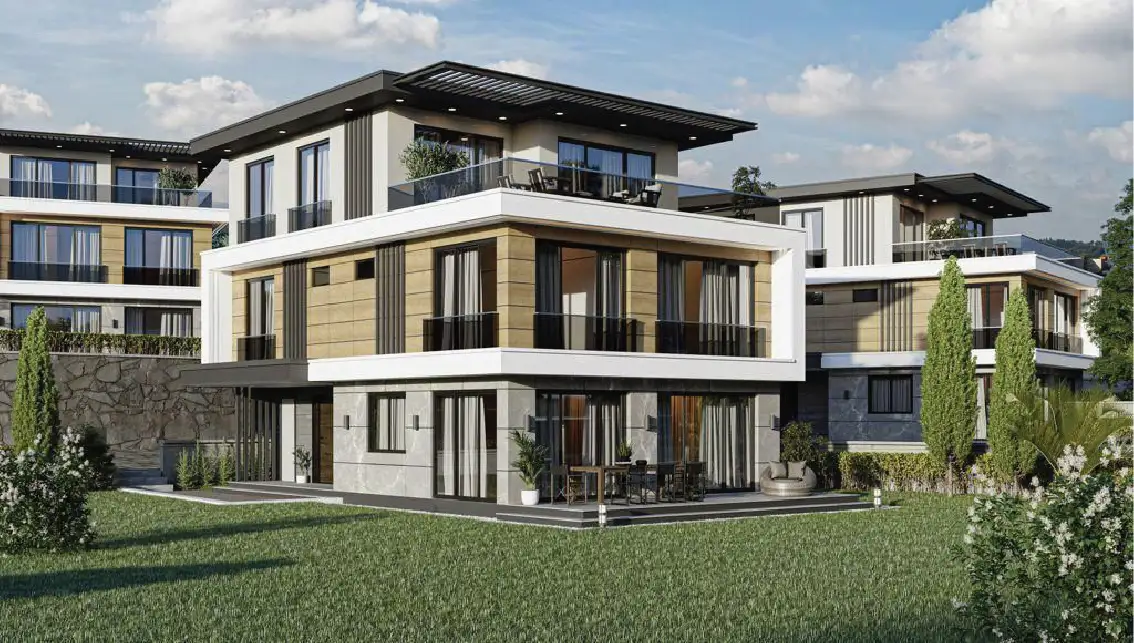
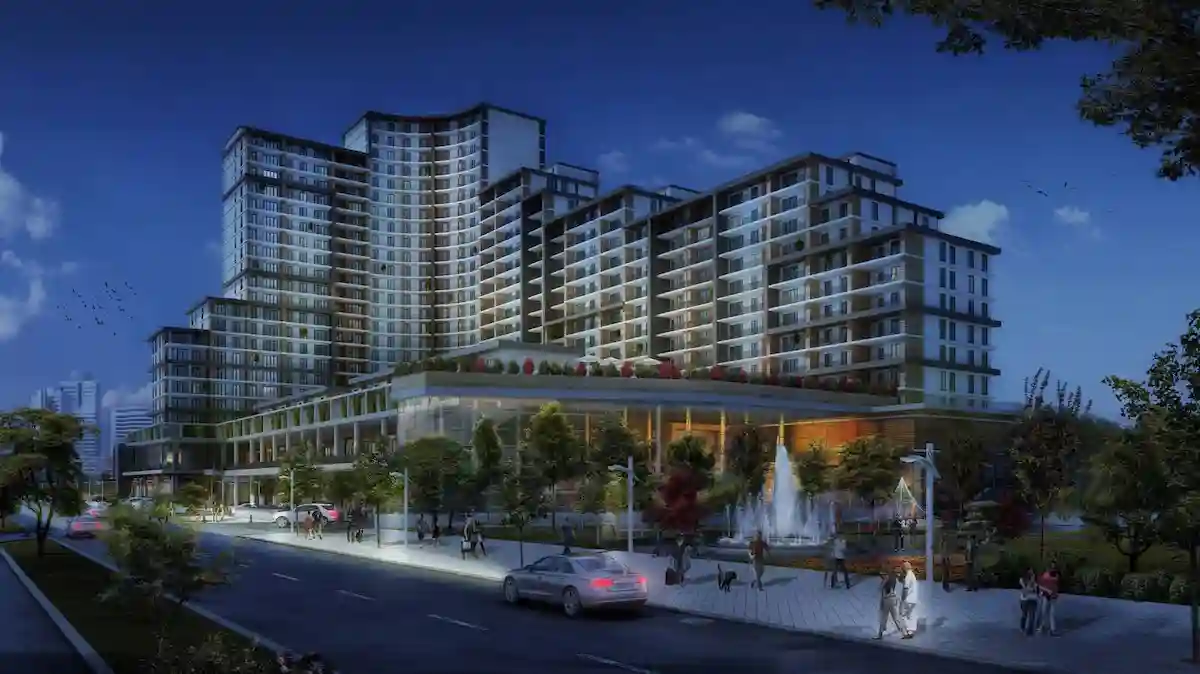
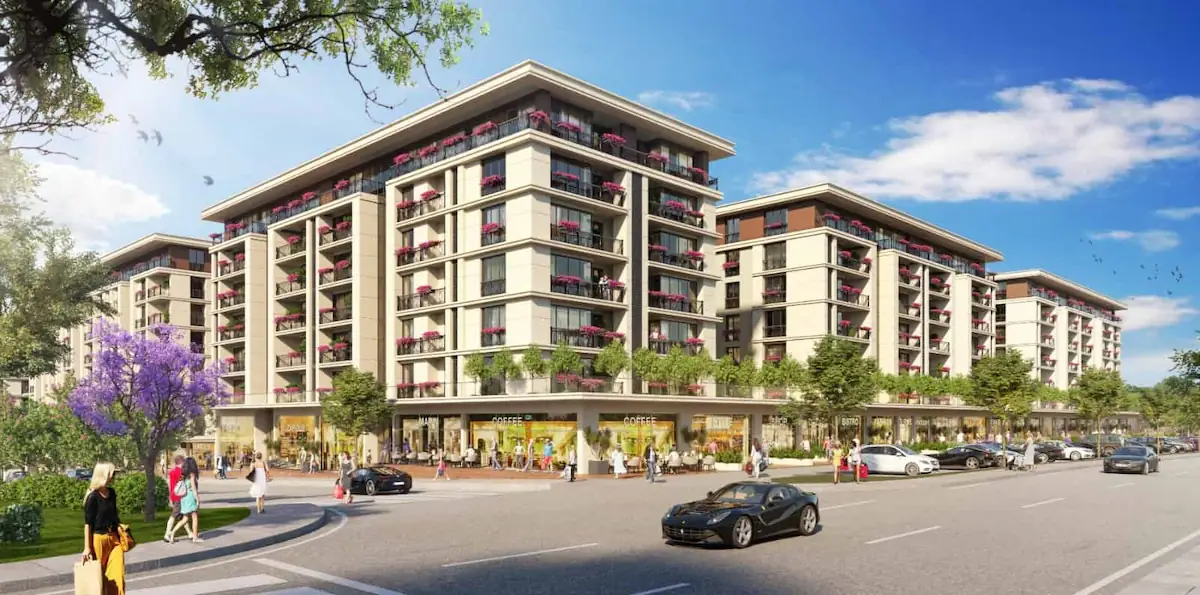
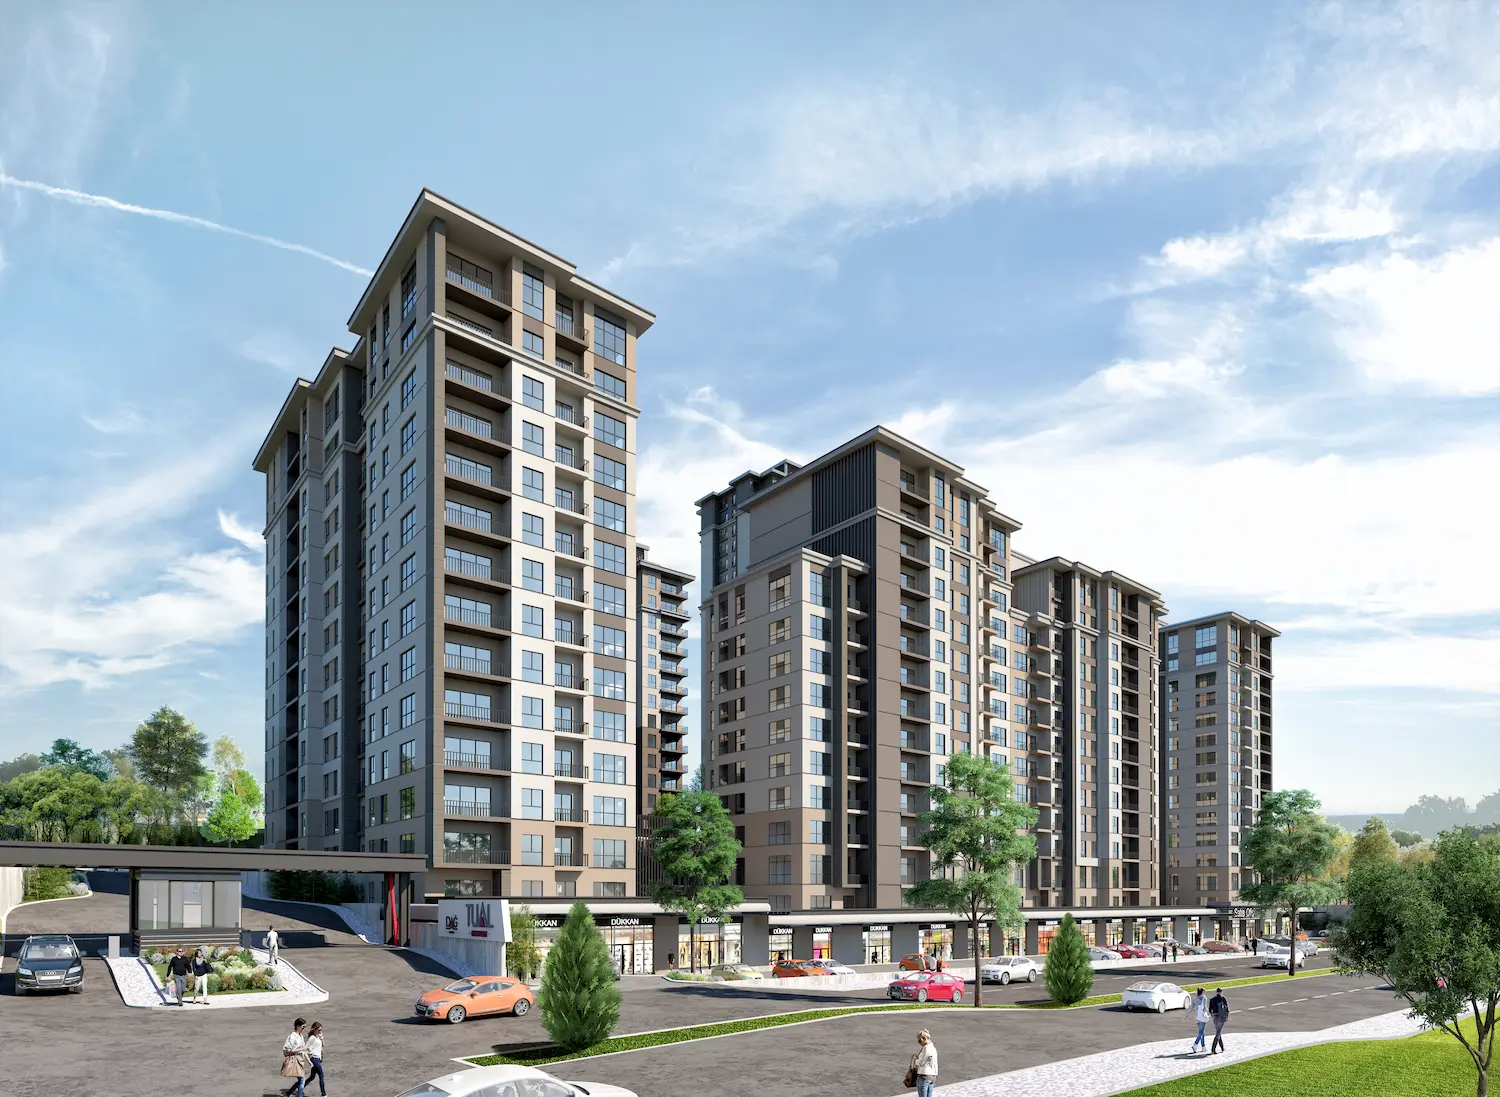
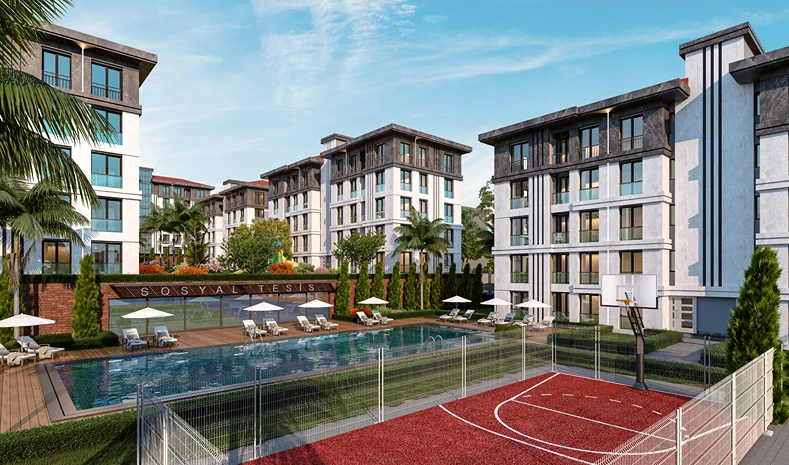
Projects Have same ROI in This Area
.webp)
.webp)
Have Question Or Suggestion ?
Please Share Your Thought, To Make It Real


