Return on Investment In Turkey
We are providing a financial metric for real estate investors as it helps them to determine the profitability of their real estate investment in Turkey
834$
Average Income
525$ - 1,143$
Min Income - Max Income
123,088$
Cash Price
| Year | Annual Increase | Monthly ROI | Annual ROI |
|---|---|---|---|
| 1 | 8.13 % | 834$ | 10,008$ |
| 2 | 10.16 % | 1,043$ | 12,510$ |
| 3 | 12.70 % | 1,303$ | 15,637$ |
| 4 | 15.88 % | 1,629$ | 19,547$ |
| 5 | 19.85 % | 2,036$ | 24,433$ |
| 6 | 24.81 % | 2,545$ | 30,542$ |
| 7 | 31.02 % | 3,181$ | 38,177$ |
| 8 | 38.77 % | 3,977$ | 47,722$ |
| 9 | 48.46 % | 4,971$ | 59,652$ |
| 10 | 60.58 % | 6,214$ | 74,565$ |
332,794$ 270%
Total ROI For 10 Years
1,143$
Max Income
123,088$
Cash Price
| Year | Annual Increase | Monthly ROI | Annual ROI |
|---|---|---|---|
| 1 | 11.14 % | 1,143$ | 13,715$ |
| 2 | 13.93 % | 1,429$ | 17,143$ |
| 3 | 17.41 % | 1,786$ | 21,429$ |
| 4 | 21.76 % | 2,232$ | 26,786$ |
| 5 | 27.20 % | 2,790$ | 33,483$ |
| 6 | 34.00 % | 3,488$ | 41,854$ |
| 7 | 42.50 % | 4,360$ | 52,317$ |
| 8 | 53.13 % | 5,450$ | 65,396$ |
| 9 | 66.41 % | 6,812$ | 81,745$ |
| 10 | 83.02 % | 8,515$ | 102,182$ |
456,050$ 370%
Total ROI For 10 Years
525$
Min Income
123,088$
Cash Price
| Year | Annual Increase | Monthly ROI | Annual ROI |
|---|---|---|---|
| 1 | 5.12 % | 525$ | 6,301$ |
| 2 | 6.40 % | 656$ | 7,877$ |
| 3 | 8.00 % | 820$ | 9,846$ |
| 4 | 10.00 % | 1,026$ | 12,307$ |
| 5 | 12.50 % | 1,282$ | 15,384$ |
| 6 | 15.62 % | 1,603$ | 19,230$ |
| 7 | 19.53 % | 2,003$ | 24,038$ |
| 8 | 24.41 % | 2,504$ | 30,047$ |
| 9 | 30.51 % | 3,130$ | 37,559$ |
| 10 | 38.14 % | 3,912$ | 46,948$ |
209,537$ 170%
Total ROI For 10 Years
District Classification
Rating
b+
Area map
Statistics
Population
381,110
Social Status
Married : 67%
Unmarried : 26%
area
230 Km2
Price Changes Over Last 5 Years
1 Year Change
17.79%
3 Year Change
202%
5 Year Change
253%
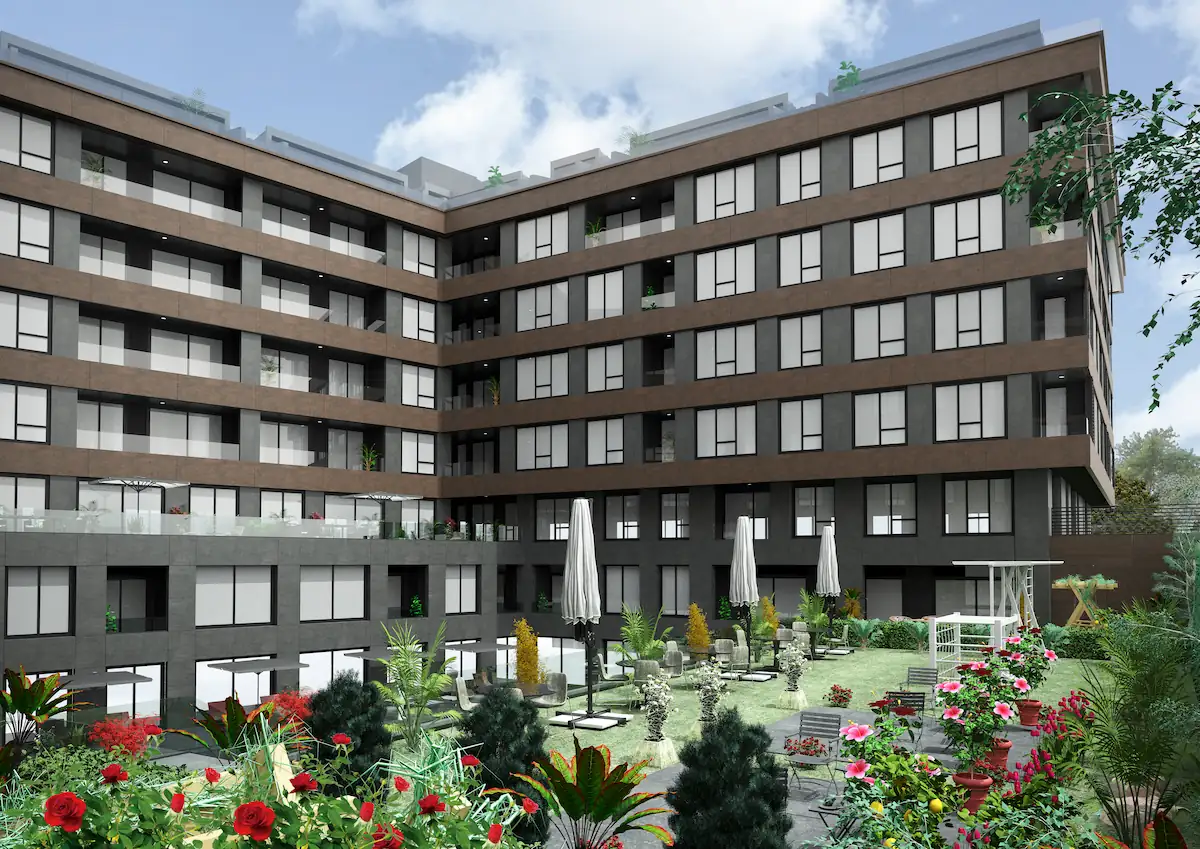
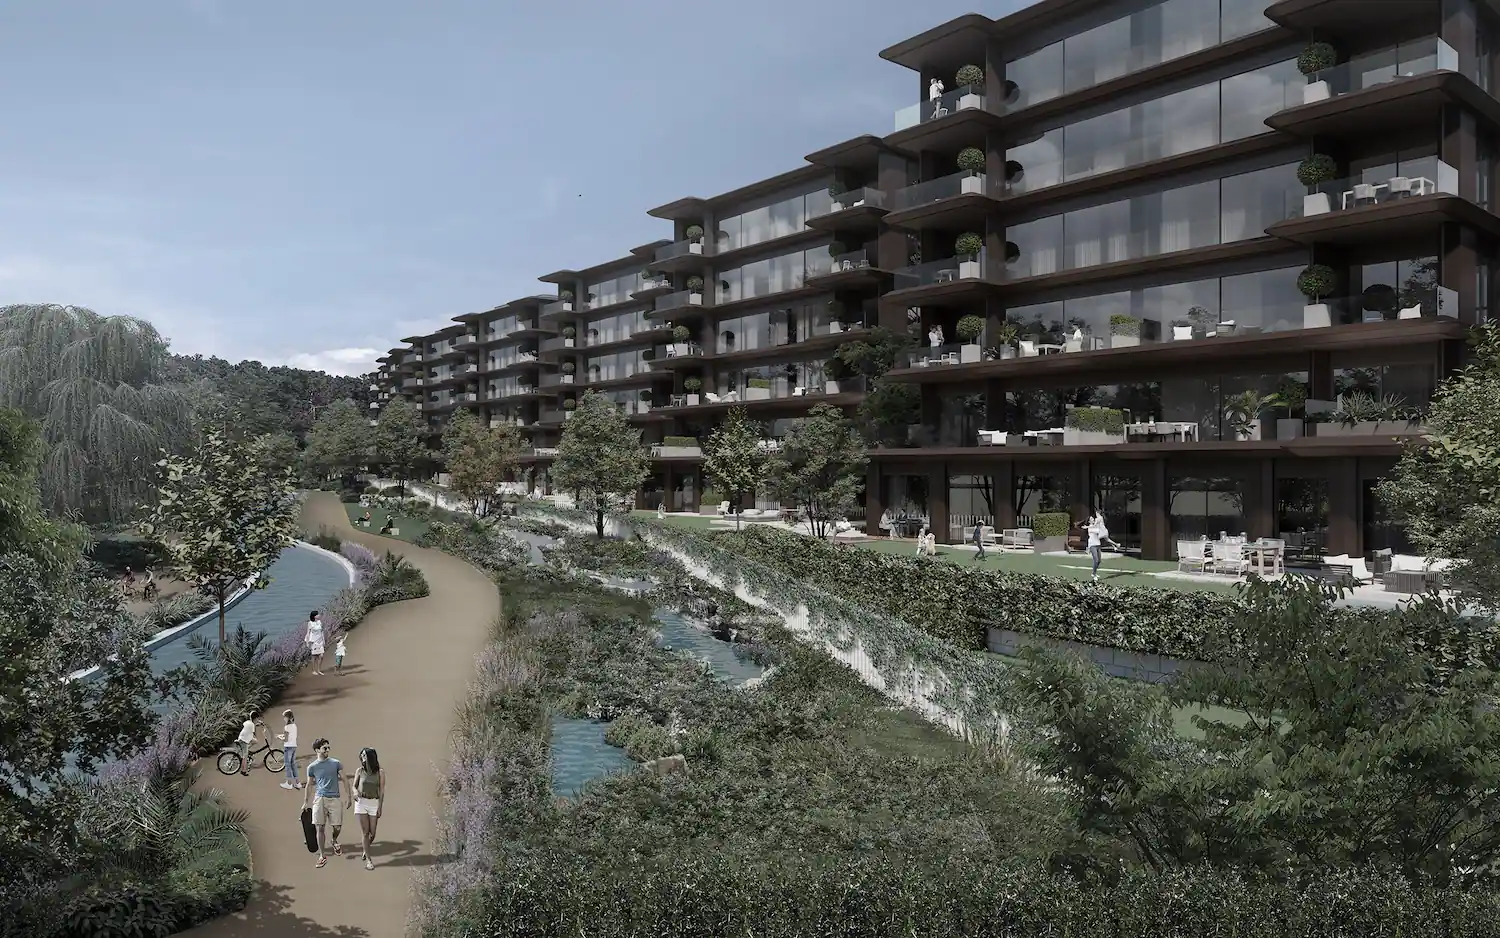
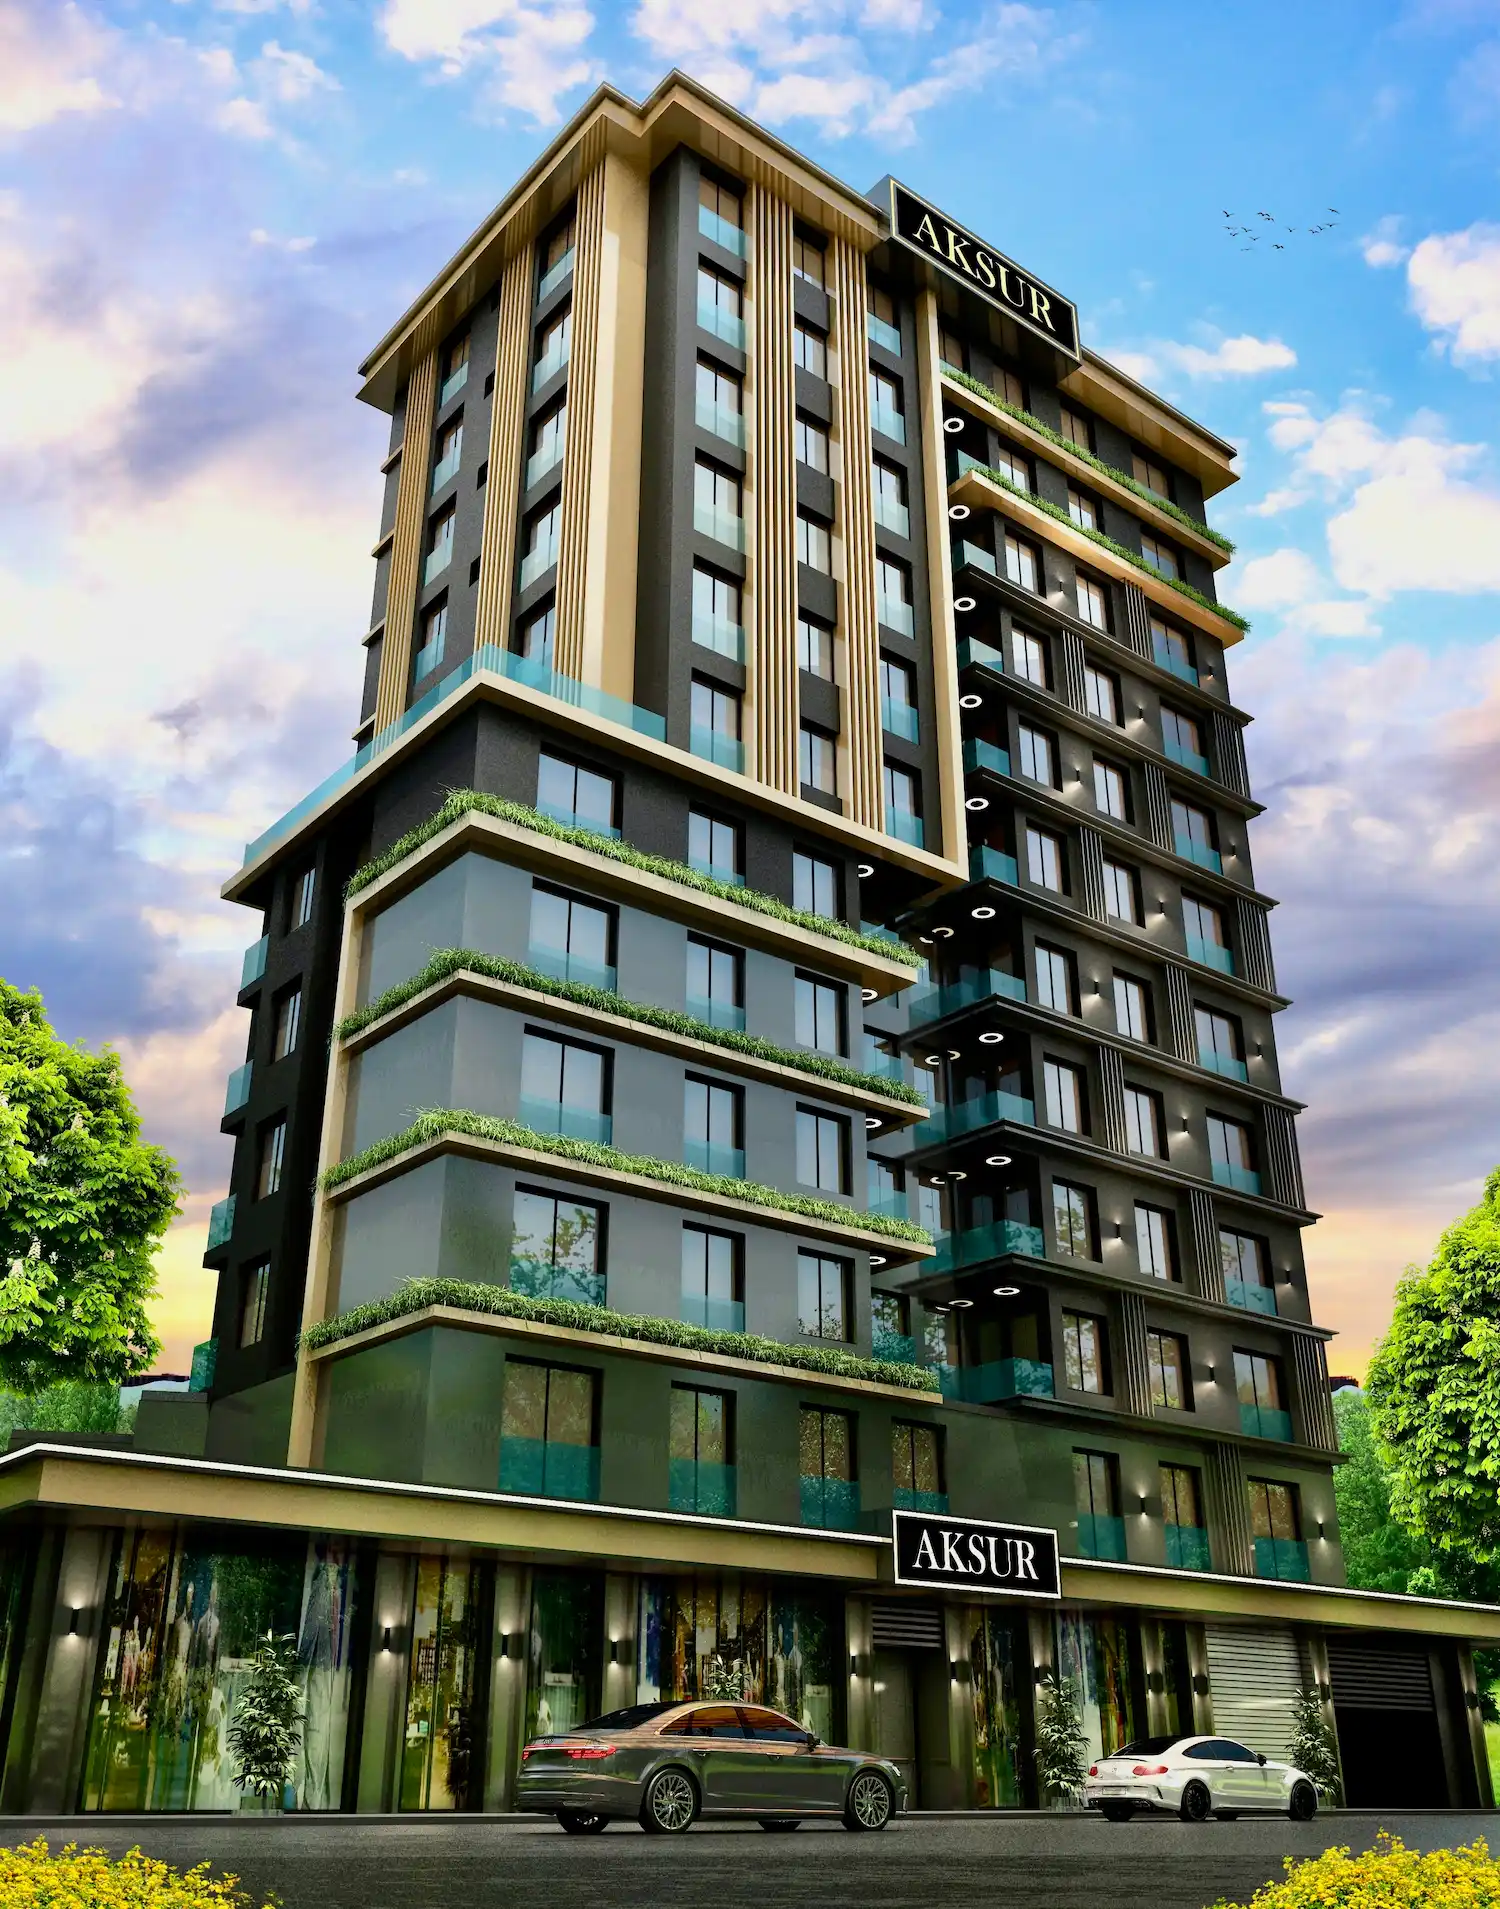
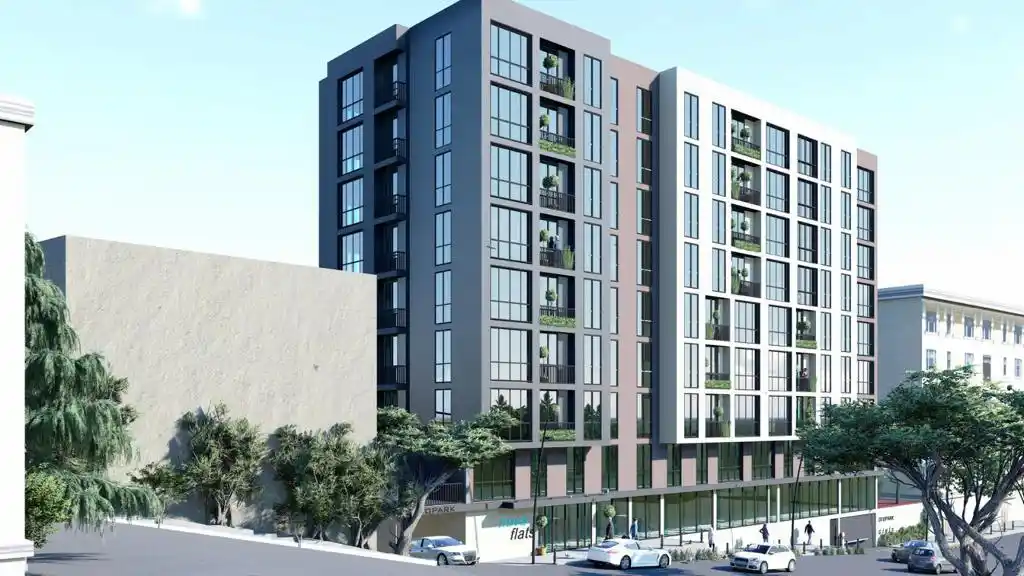
Projects Have same ROI in This Area


Have Question Or Suggestion ?
Please Share Your Thought, To Make It Real


