Return on Investment In Turkey
We are providing a financial metric for real estate investors as it helps them to determine the profitability of their real estate investment in Turkey
1,139€
Average Income
854€ - 1,423€
Min Income - Max Income
172,643€
Cash Price
| Year | Annual Increase | Monthly ROI | Annual ROI |
|---|---|---|---|
| 1 | 7.91 % | 1,139€ | 13,665€ |
| 2 | 9.89 % | 1,423€ | 17,081€ |
| 3 | 12.37 % | 1,779€ | 21,351€ |
| 4 | 15.46 % | 2,224€ | 26,689€ |
| 5 | 19.32 % | 2,780€ | 33,361€ |
| 6 | 24.15 % | 3,475€ | 41,701€ |
| 7 | 30.19 % | 4,344€ | 52,126€ |
| 8 | 37.74 % | 5,430€ | 65,158€ |
| 9 | 47.18 % | 6,787€ | 81,447€ |
| 10 | 58.97 % | 8,484€ | 101,809€ |
454,388€ 263%
Total ROI For 10 Years
1,423€
Max Income
172,643€
Cash Price
| Year | Annual Increase | Monthly ROI | Annual ROI |
|---|---|---|---|
| 1 | 9.89 % | 1,423€ | 17,081€ |
| 2 | 12.37 % | 1,779€ | 21,351€ |
| 3 | 15.46 % | 2,224€ | 26,689€ |
| 4 | 19.32 % | 2,780€ | 33,361€ |
| 5 | 24.15 % | 3,475€ | 41,701€ |
| 6 | 30.19 % | 4,344€ | 52,126€ |
| 7 | 37.74 % | 5,430€ | 65,158€ |
| 8 | 47.18 % | 6,787€ | 81,447€ |
| 9 | 58.97 % | 8,484€ | 101,809€ |
| 10 | 73.71 % | 10,605€ | 127,262€ |
567,985€ 328%
Total ROI For 10 Years
854€
Min Income
172,643€
Cash Price
| Year | Annual Increase | Monthly ROI | Annual ROI |
|---|---|---|---|
| 1 | 5.94 % | 854€ | 10,248€ |
| 2 | 7.42 % | 1,068€ | 12,811€ |
| 3 | 9.28 % | 1,334€ | 16,013€ |
| 4 | 11.59 % | 1,668€ | 20,017€ |
| 5 | 14.49 % | 2,085€ | 25,021€ |
| 6 | 18.12 % | 2,606€ | 31,276€ |
| 7 | 22.64 % | 3,258€ | 39,095€ |
| 8 | 28.31 % | 4,072€ | 48,869€ |
| 9 | 35.38 % | 5,090€ | 61,086€ |
| 10 | 44.23 % | 6,363€ | 76,357€ |
340,791€ 197%
Total ROI For 10 Years
District Classification
Rating
b+
Area map
Statistics
Population
381,110
Social Status
Married : 67%
Unmarried : 26%
area
230 Km2
Price Changes Over Last 5 Years
1 Year Change
17.79%
3 Year Change
202%
5 Year Change
253%
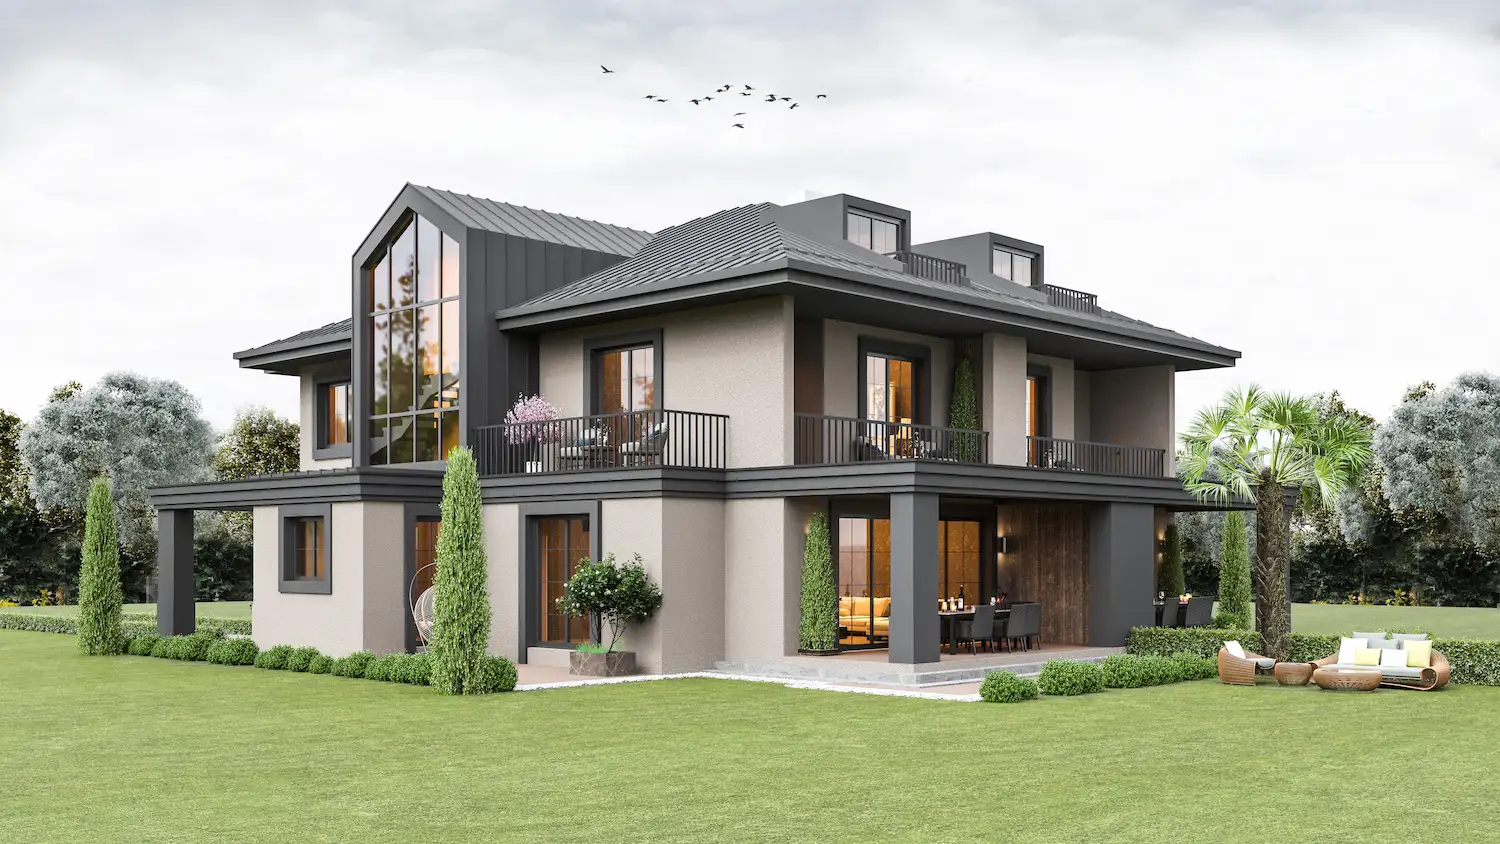
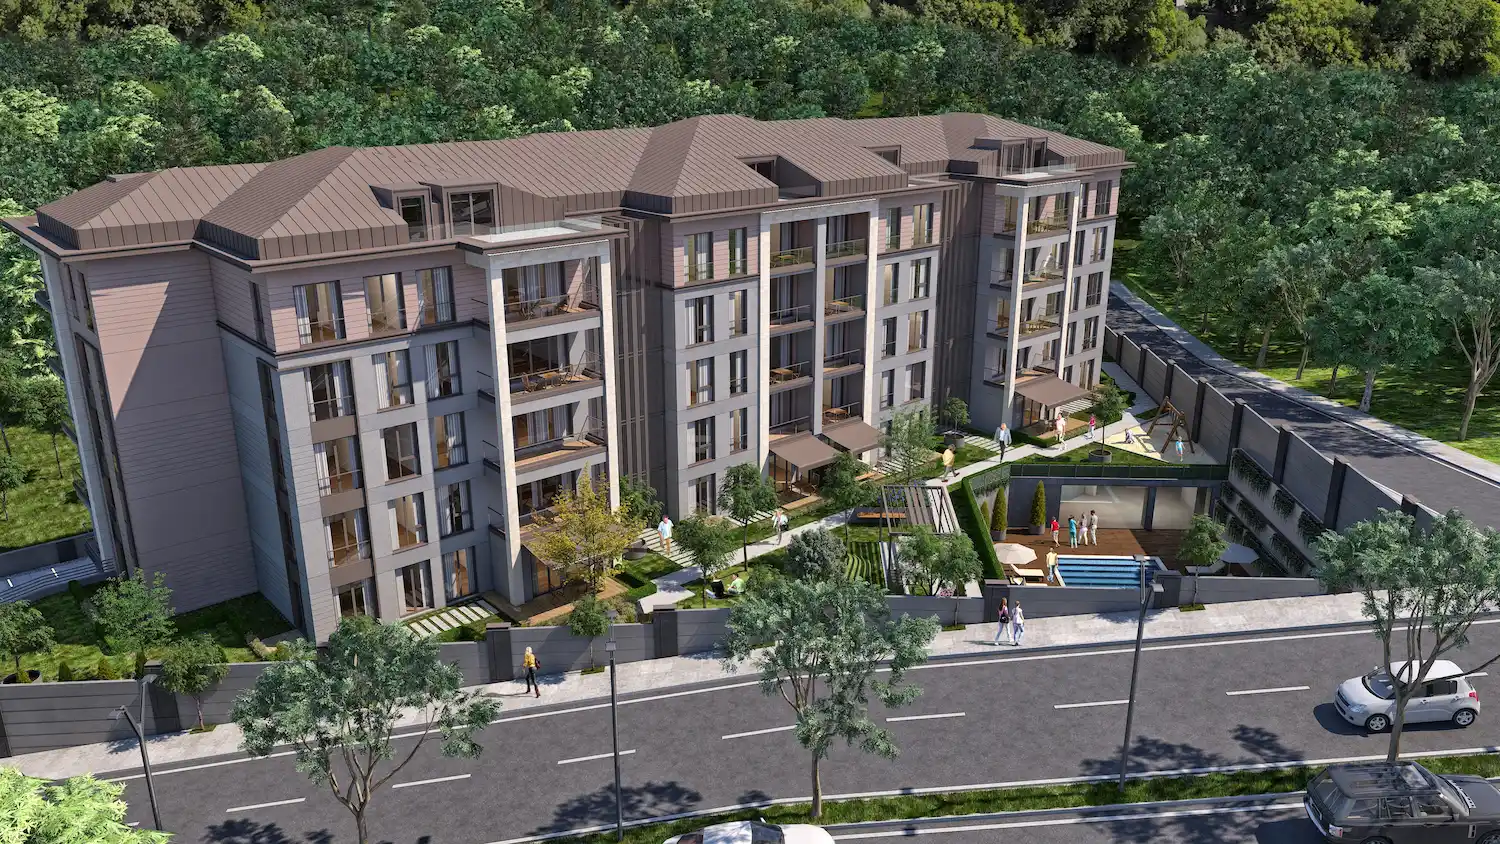
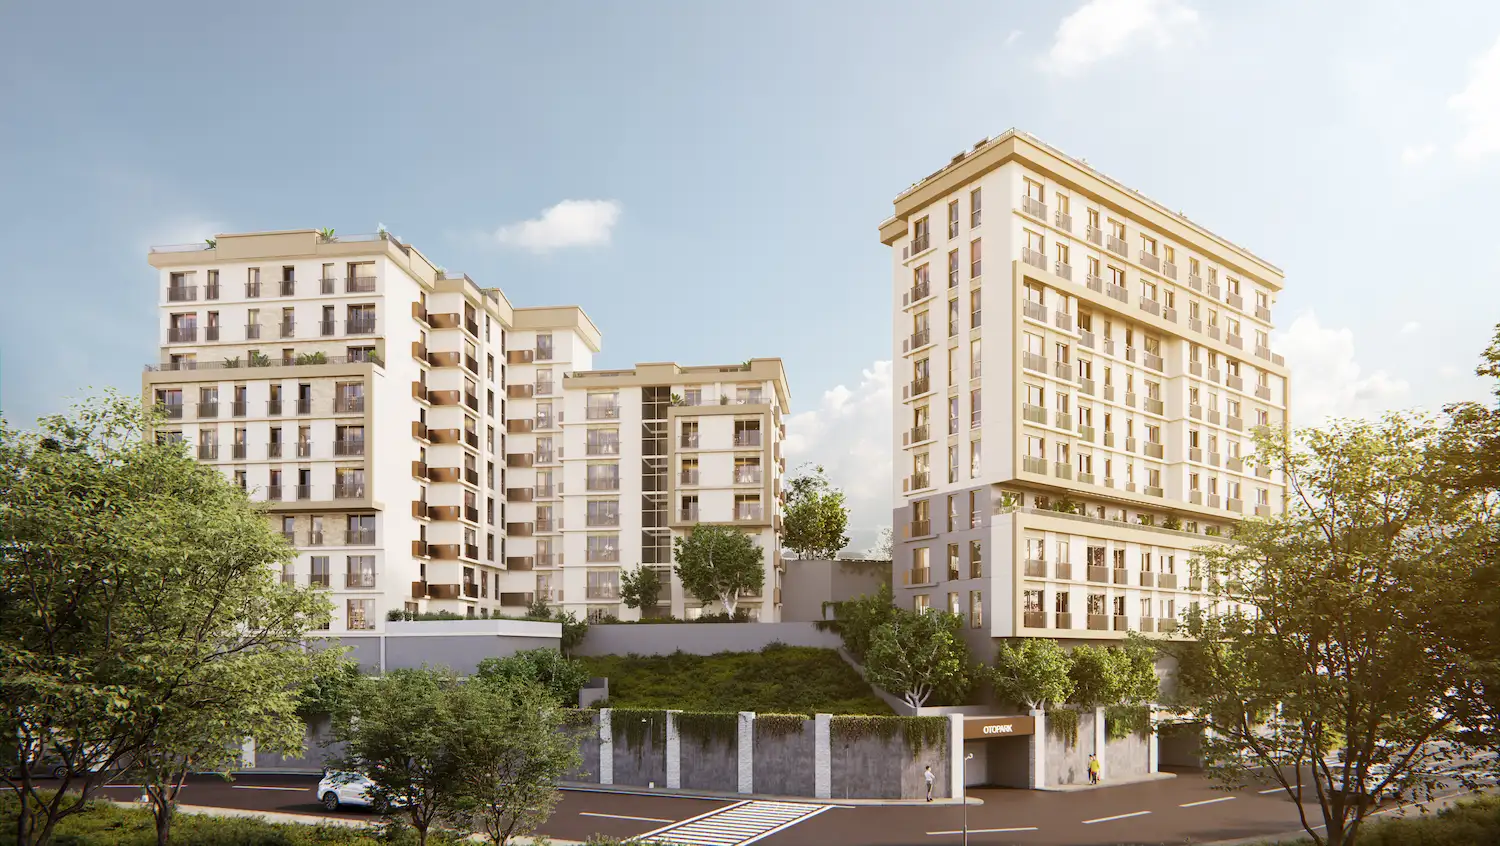
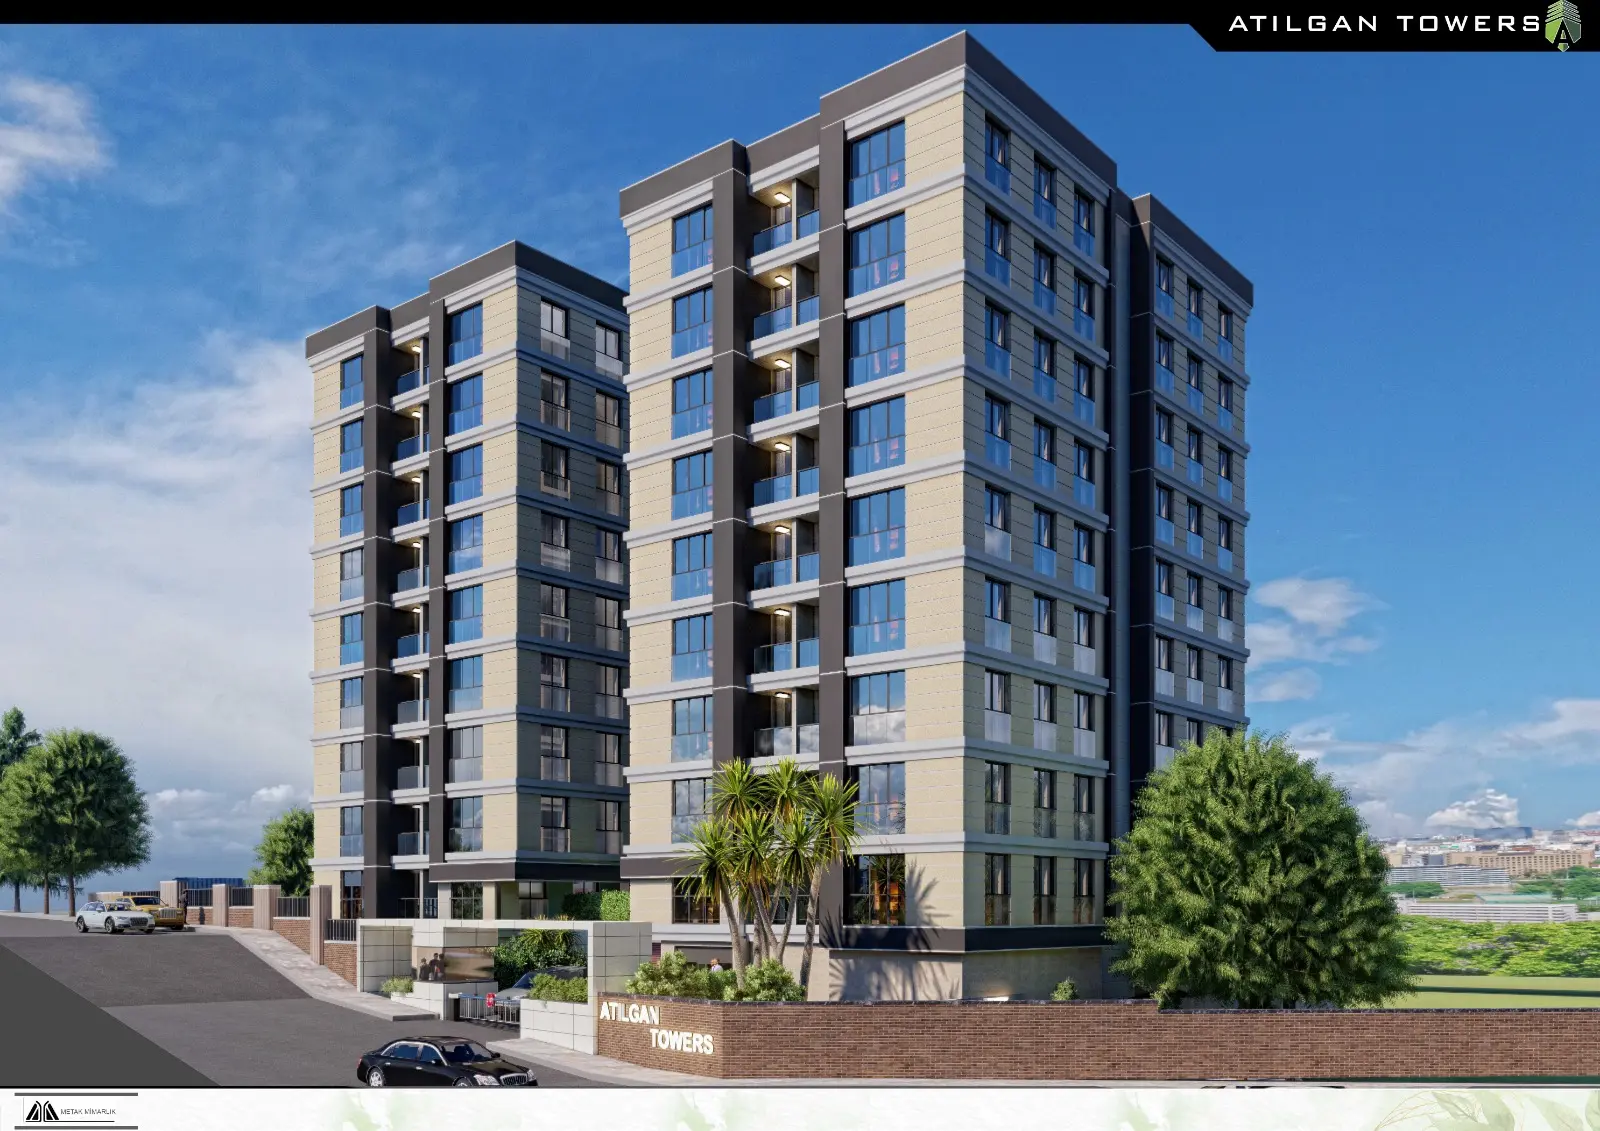
Projects Have same ROI in This Area

.webp)

Have Question Or Suggestion ?
Please Share Your Thought, To Make It Real


