Return on Investment In Turkey
We are providing a financial metric for real estate investors as it helps them to determine the profitability of their real estate investment in Turkey
1,148€
Average Income
861€ - 1,435€
Min Income - Max Income
173,030€
Cash Price
| Year | Annual Increase | Monthly ROI | Annual ROI |
|---|---|---|---|
| 1 | 7.96 % | 1,148€ | 13,773€ |
| 2 | 9.95 % | 1,435€ | 17,216€ |
| 3 | 12.44 % | 1,793€ | 21,520€ |
| 4 | 15.55 % | 2,242€ | 26,900€ |
| 5 | 19.43 % | 2,802€ | 33,626€ |
| 6 | 24.29 % | 3,503€ | 42,032€ |
| 7 | 30.36 % | 4,378€ | 52,540€ |
| 8 | 37.96 % | 5,473€ | 65,675€ |
| 9 | 47.44 % | 6,841€ | 82,094€ |
| 10 | 59.31 % | 8,551€ | 102,617€ |
457,993€ 264%
Total ROI For 10 Years
1,435€
Max Income
173,030€
Cash Price
| Year | Annual Increase | Monthly ROI | Annual ROI |
|---|---|---|---|
| 1 | 9.95 % | 1,435€ | 17,216€ |
| 2 | 12.44 % | 1,793€ | 21,520€ |
| 3 | 15.55 % | 2,242€ | 26,900€ |
| 4 | 19.43 % | 2,802€ | 33,626€ |
| 5 | 24.29 % | 3,503€ | 42,032€ |
| 6 | 30.36 % | 4,378€ | 52,540€ |
| 7 | 37.96 % | 5,473€ | 65,675€ |
| 8 | 47.44 % | 6,841€ | 82,094€ |
| 9 | 59.31 % | 8,551€ | 102,617€ |
| 10 | 74.13 % | 10,689€ | 128,271€ |
572,491€ 330%
Total ROI For 10 Years
861€
Min Income
173,030€
Cash Price
| Year | Annual Increase | Monthly ROI | Annual ROI |
|---|---|---|---|
| 1 | 5.97 % | 861€ | 10,330€ |
| 2 | 7.46 % | 1,076€ | 12,912€ |
| 3 | 9.33 % | 1,345€ | 16,140€ |
| 4 | 11.66 % | 1,681€ | 20,175€ |
| 5 | 14.58 % | 2,102€ | 25,219€ |
| 6 | 18.22 % | 2,627€ | 31,524€ |
| 7 | 22.77 % | 3,284€ | 39,405€ |
| 8 | 28.47 % | 4,105€ | 49,256€ |
| 9 | 35.58 % | 5,131€ | 61,570€ |
| 10 | 44.48 % | 6,414€ | 76,963€ |
343,495€ 198%
Total ROI For 10 Years
District Classification
Rating
b+
Area map
Statistics
Population
381,110
Social Status
Married : 67%
Unmarried : 26%
area
230 Km2
Price Changes Over Last 5 Years
1 Year Change
17.79%
3 Year Change
202%
5 Year Change
253%
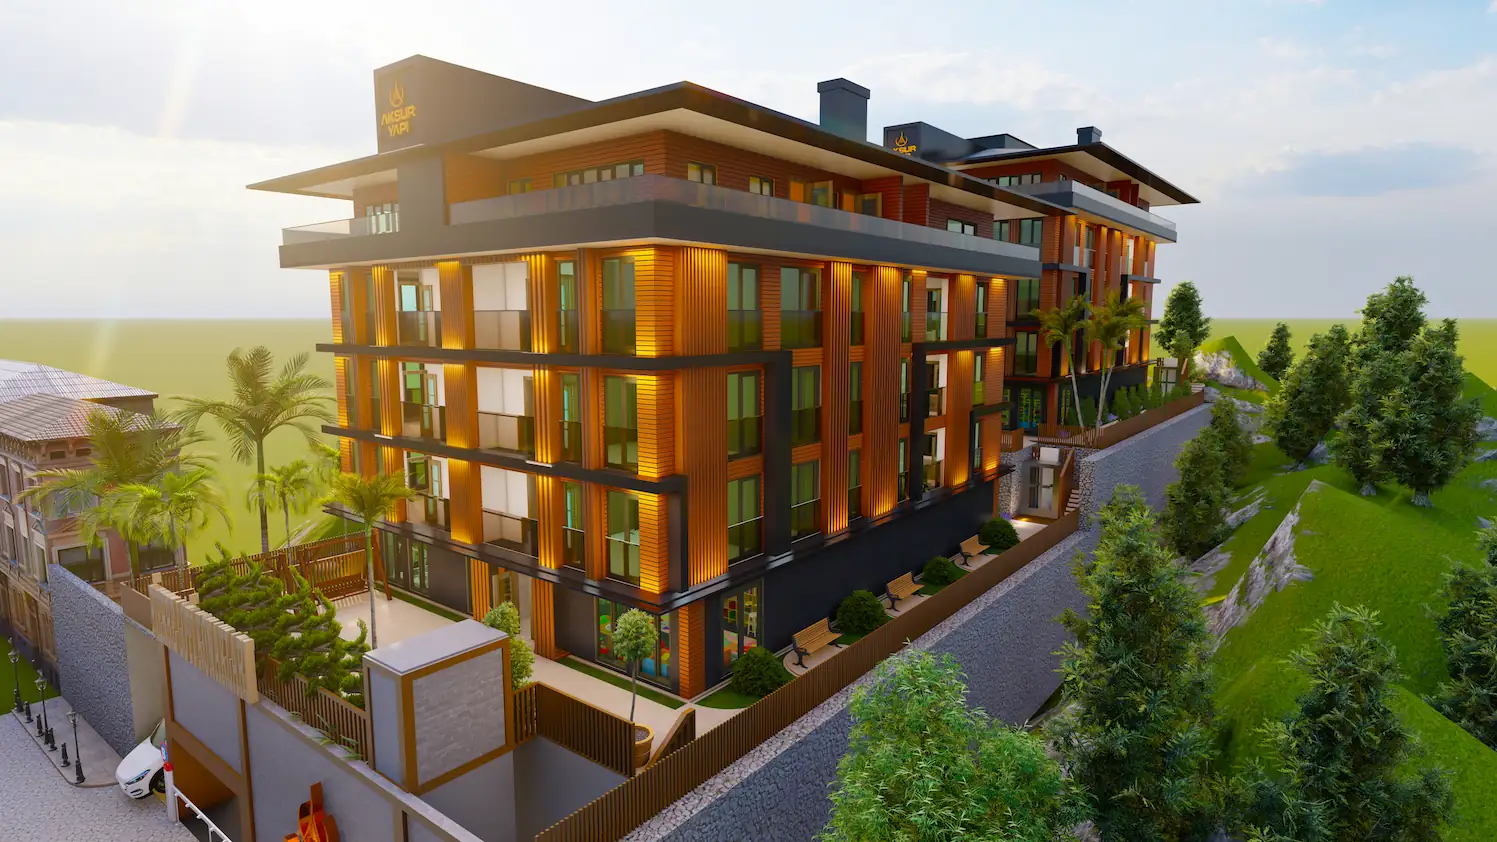
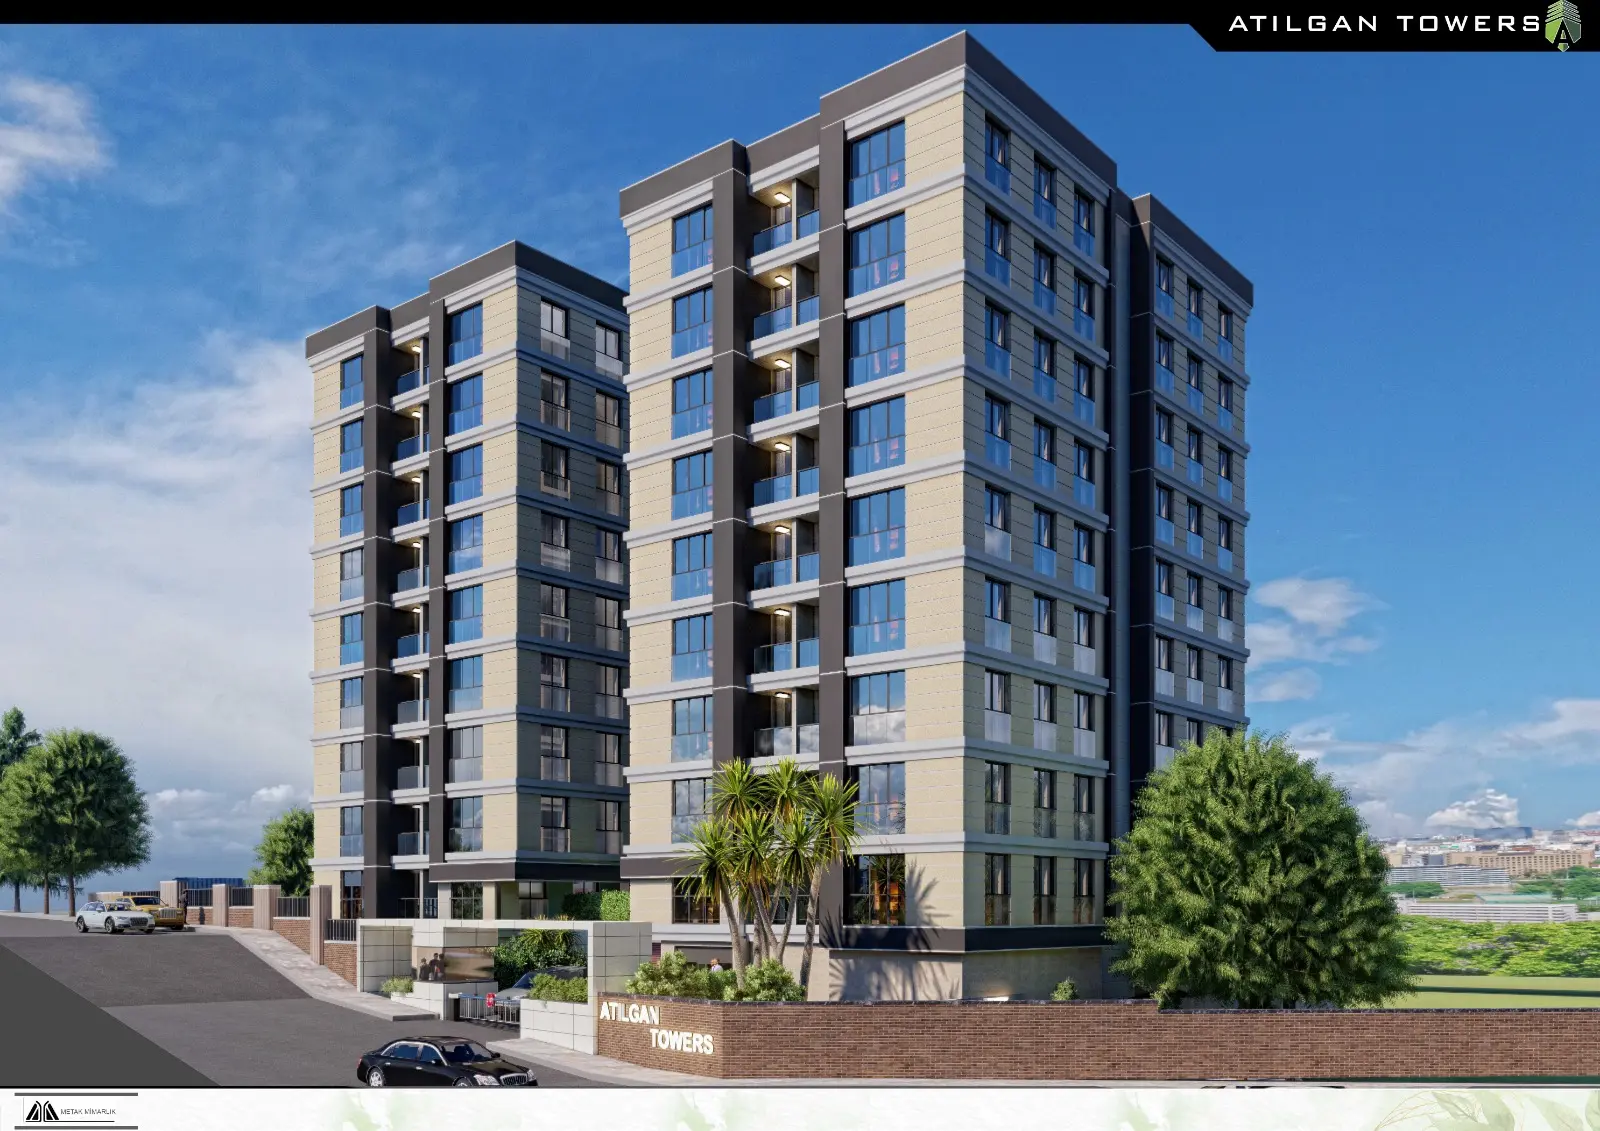
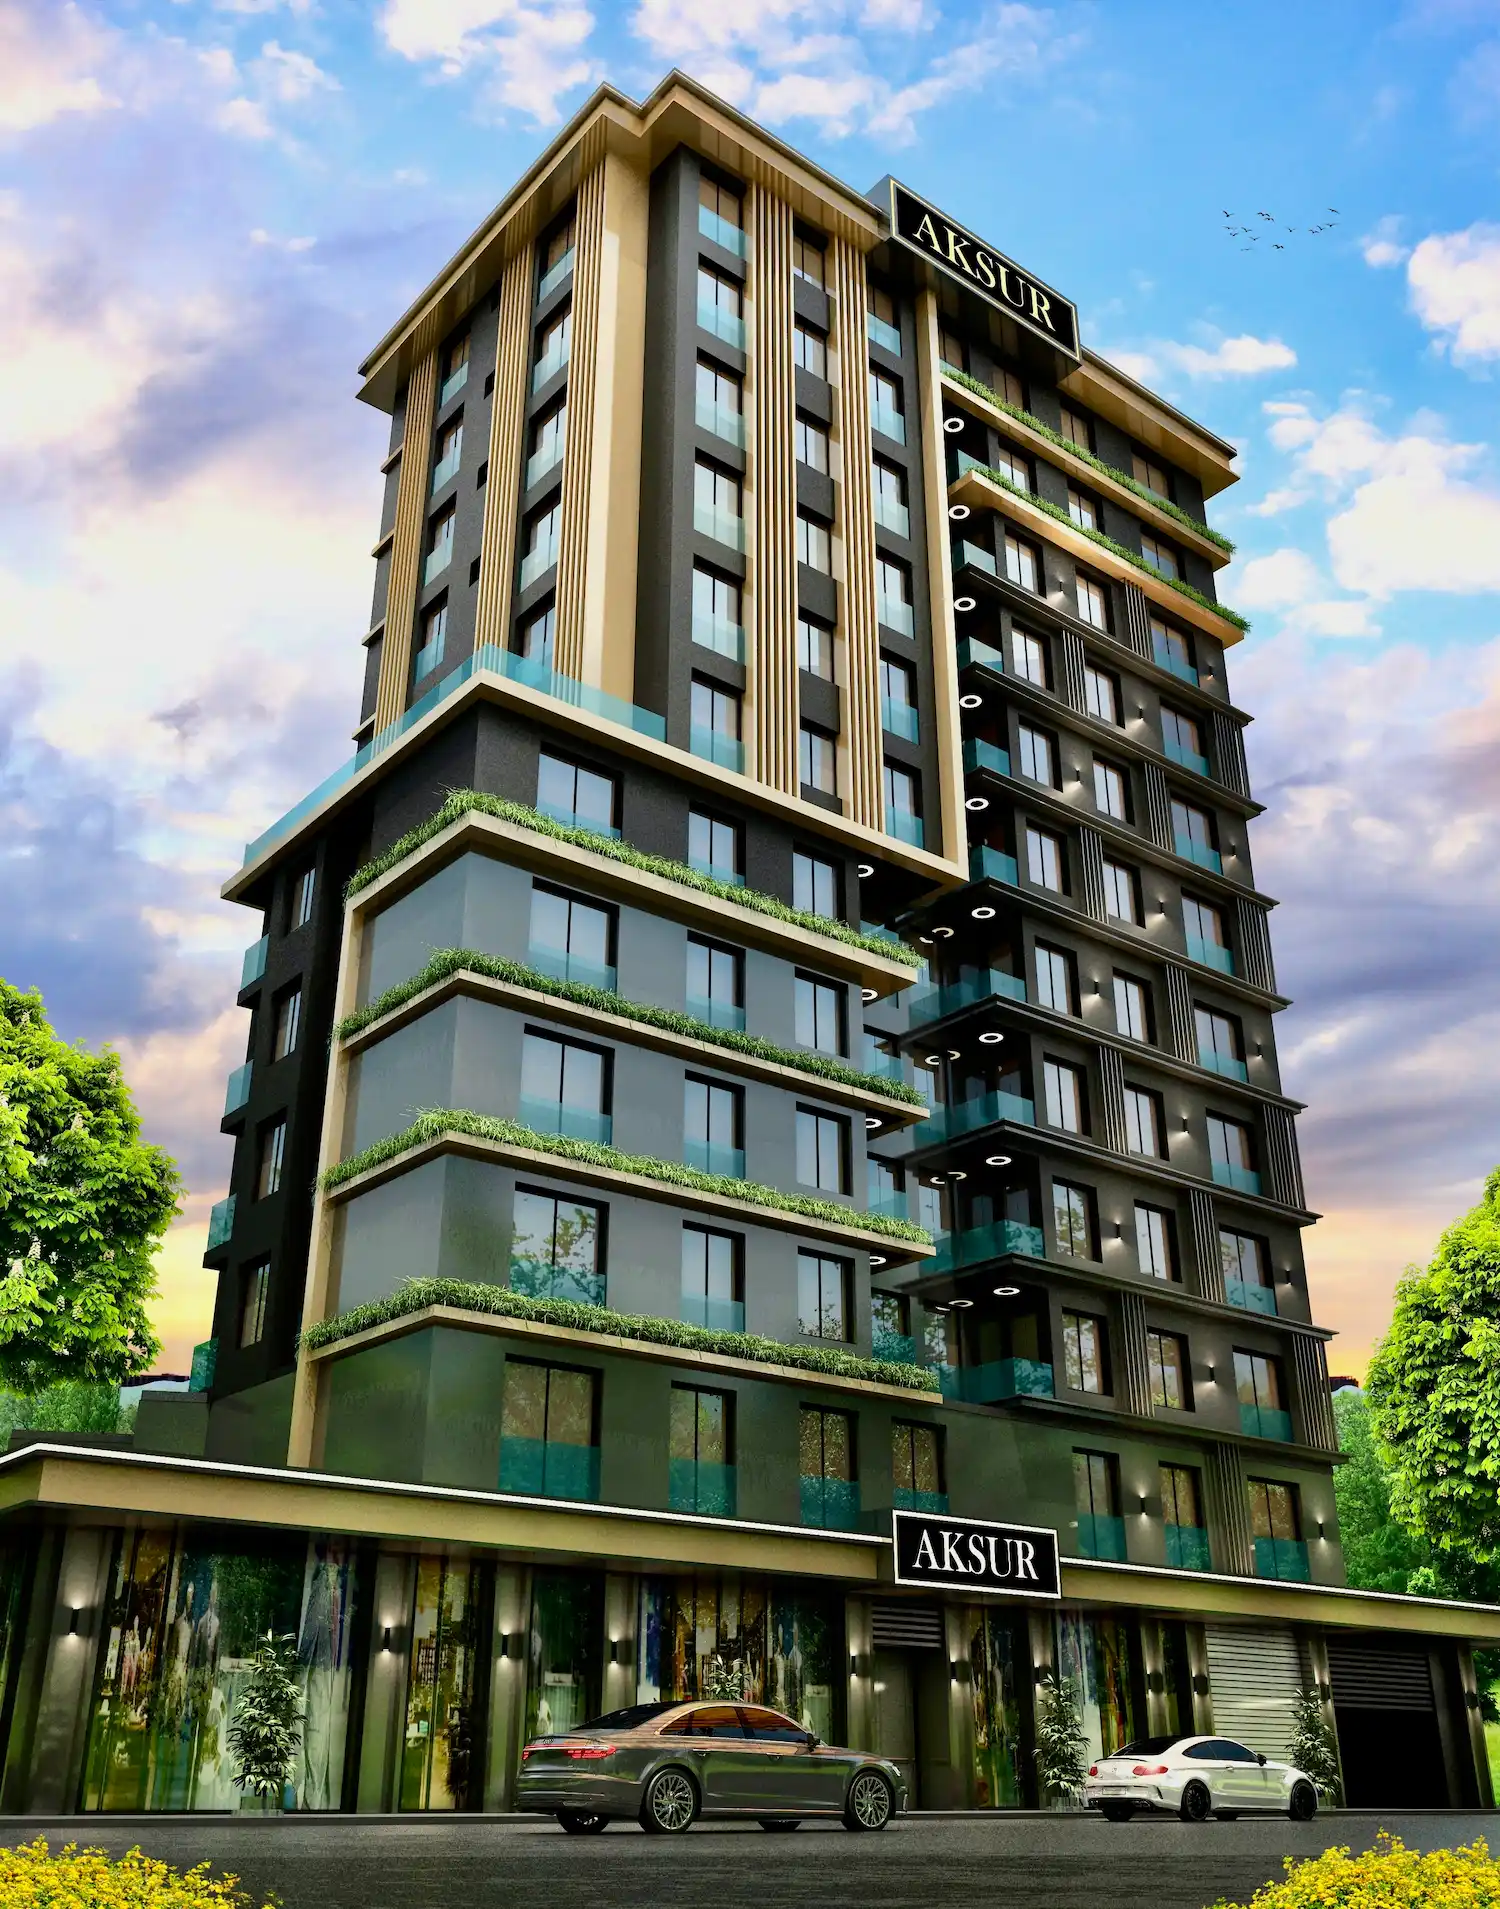
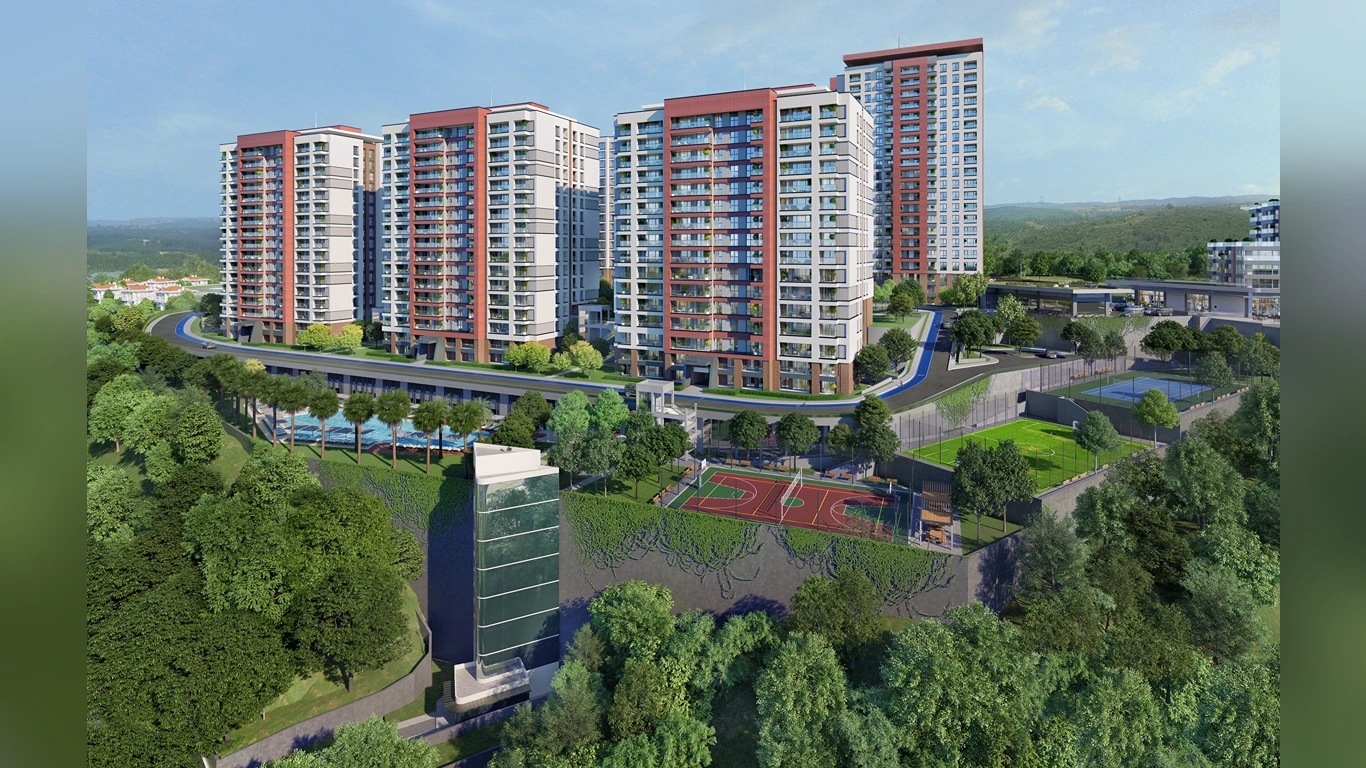
Projects Have same ROI in This Area


Have Question Or Suggestion ?
Please Share Your Thought, To Make It Real


