Return on Investment In Turkey
We are providing a financial metric for real estate investors as it helps them to determine the profitability of their real estate investment in Turkey
1,142€
Average Income
857€ - 1,428€
Min Income - Max Income
274,226€
Cash Price
| Year | Annual Increase | Monthly ROI | Annual ROI |
|---|---|---|---|
| 1 | 5.00 % | 1,142€ | 13,708€ |
| 2 | 6.25 % | 1,428€ | 17,135€ |
| 3 | 7.81 % | 1,785€ | 21,419€ |
| 4 | 9.76 % | 2,231€ | 26,774€ |
| 5 | 12.20 % | 2,789€ | 33,467€ |
| 6 | 15.26 % | 3,486€ | 41,834€ |
| 7 | 19.07 % | 4,358€ | 52,292€ |
| 8 | 23.84 % | 5,447€ | 65,365€ |
| 9 | 29.80 % | 6,809€ | 81,707€ |
| 10 | 37.24 % | 8,511€ | 102,134€ |
455,835€ 166%
Total ROI For 10 Years
1,428€
Max Income
274,226€
Cash Price
| Year | Annual Increase | Monthly ROI | Annual ROI |
|---|---|---|---|
| 1 | 6.25 % | 1,428€ | 17,135€ |
| 2 | 7.81 % | 1,785€ | 21,419€ |
| 3 | 9.76 % | 2,231€ | 26,774€ |
| 4 | 12.20 % | 2,789€ | 33,467€ |
| 5 | 15.26 % | 3,486€ | 41,834€ |
| 6 | 19.07 % | 4,358€ | 52,292€ |
| 7 | 23.84 % | 5,447€ | 65,365€ |
| 8 | 29.80 % | 6,809€ | 81,707€ |
| 9 | 37.24 % | 8,511€ | 102,134€ |
| 10 | 46.56 % | 10,639€ | 127,667€ |
569,794€ 207%
Total ROI For 10 Years
857€
Min Income
274,226€
Cash Price
| Year | Annual Increase | Monthly ROI | Annual ROI |
|---|---|---|---|
| 1 | 3.75 % | 857€ | 10,281€ |
| 2 | 4.69 % | 1,071€ | 12,851€ |
| 3 | 5.86 % | 1,339€ | 16,064€ |
| 4 | 7.32 % | 1,673€ | 20,080€ |
| 5 | 9.15 % | 2,092€ | 25,100€ |
| 6 | 11.44 % | 2,615€ | 31,375€ |
| 7 | 14.30 % | 3,268€ | 39,219€ |
| 8 | 17.88 % | 4,085€ | 49,024€ |
| 9 | 22.35 % | 5,107€ | 61,280€ |
| 10 | 27.93 % | 6,383€ | 76,600€ |
341,876€ 124%
Total ROI For 10 Years
District Classification
Rating
b+
Area map
Statistics
Population
381,110
Social Status
Married : 67%
Unmarried : 26%
area
230 Km2
Price Changes Over Last 5 Years
1 Year Change
17.79%
3 Year Change
202%
5 Year Change
253%
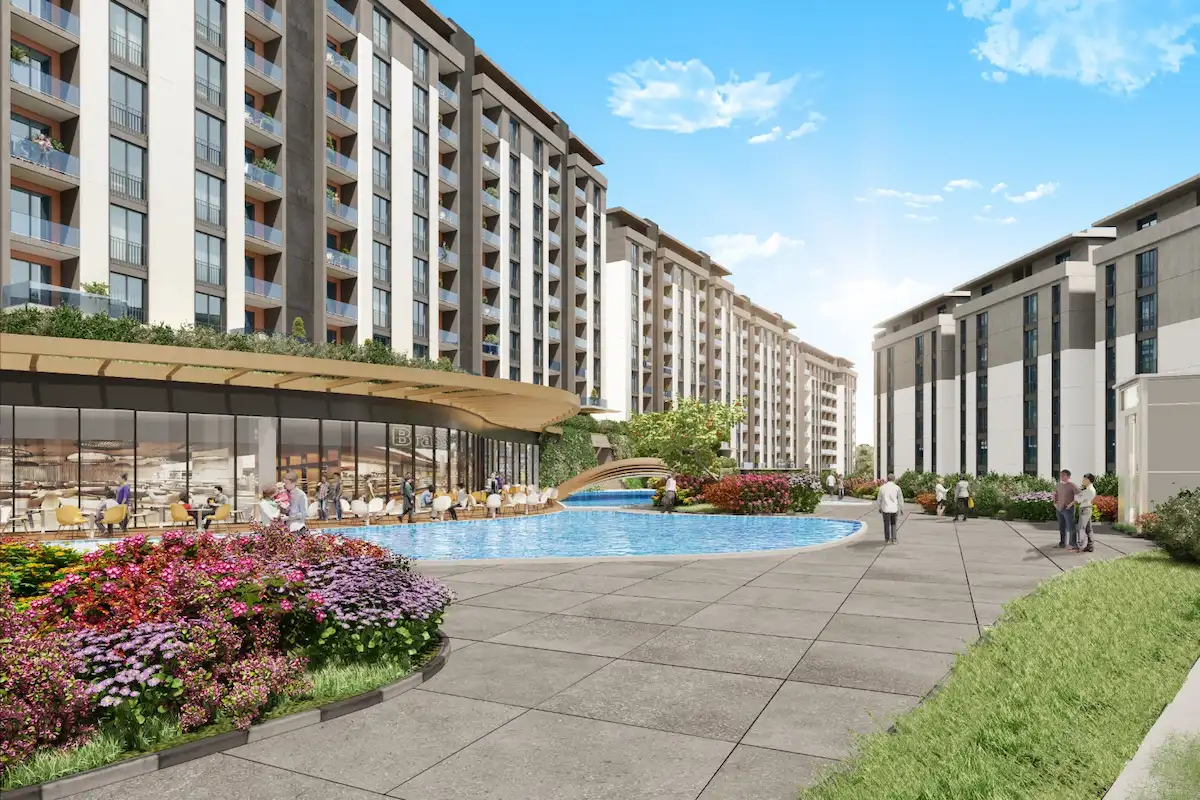
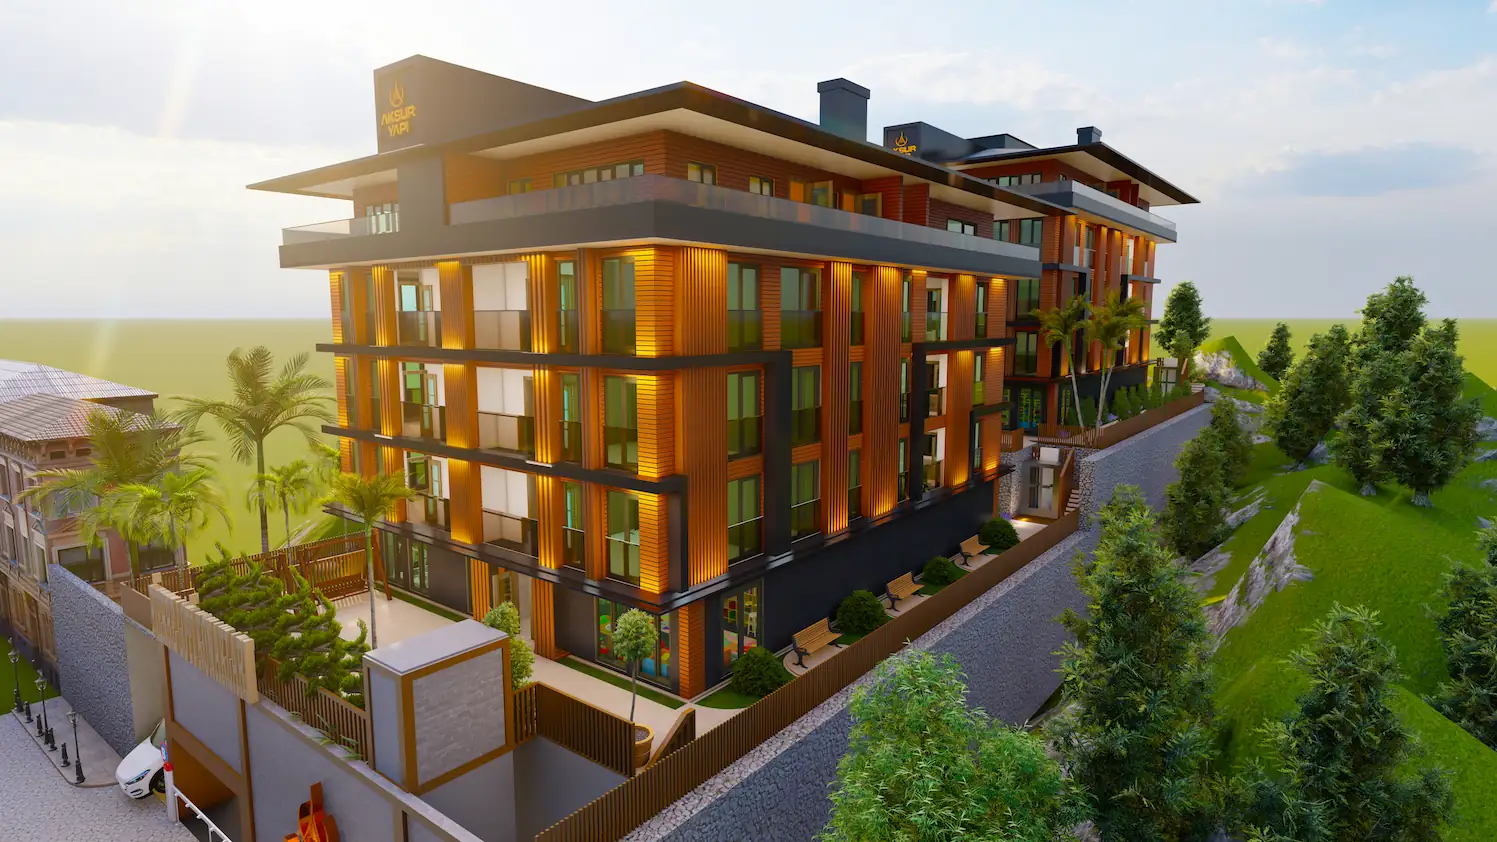
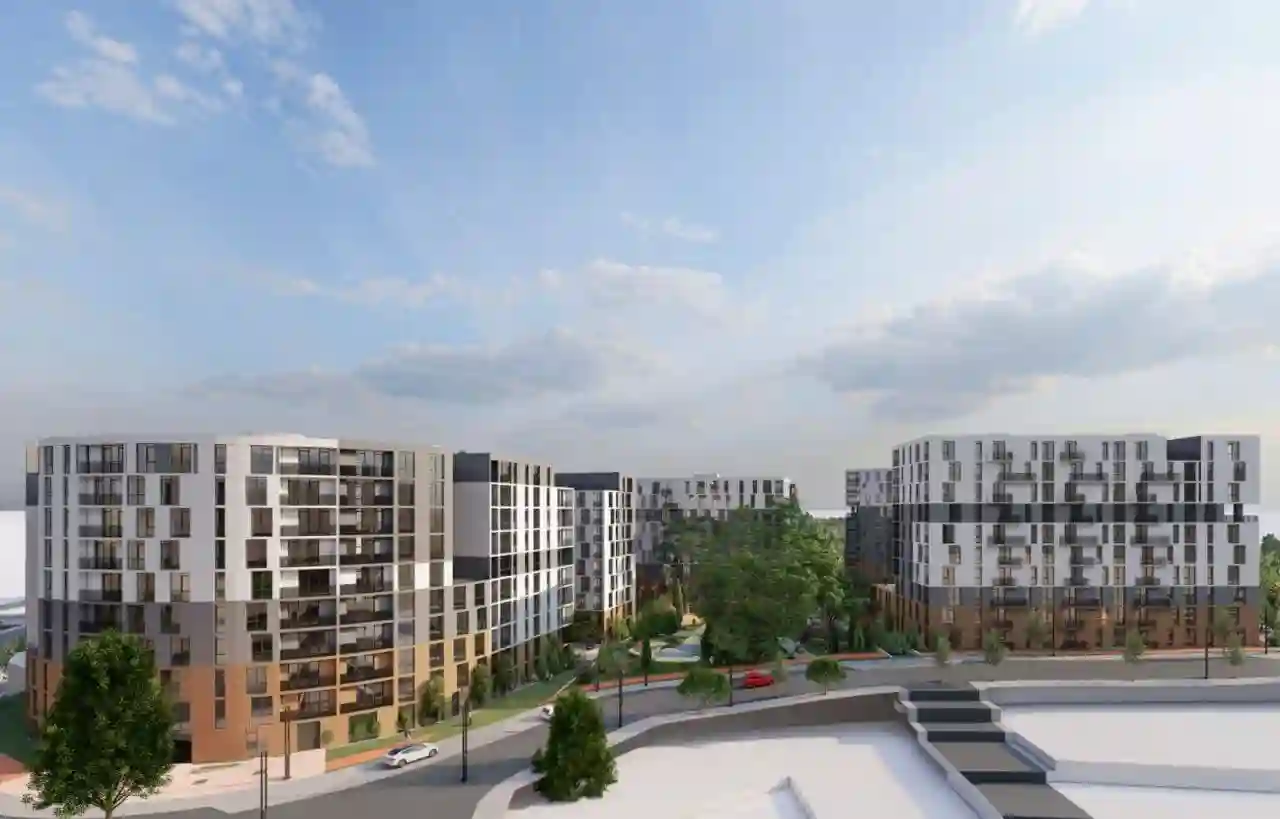
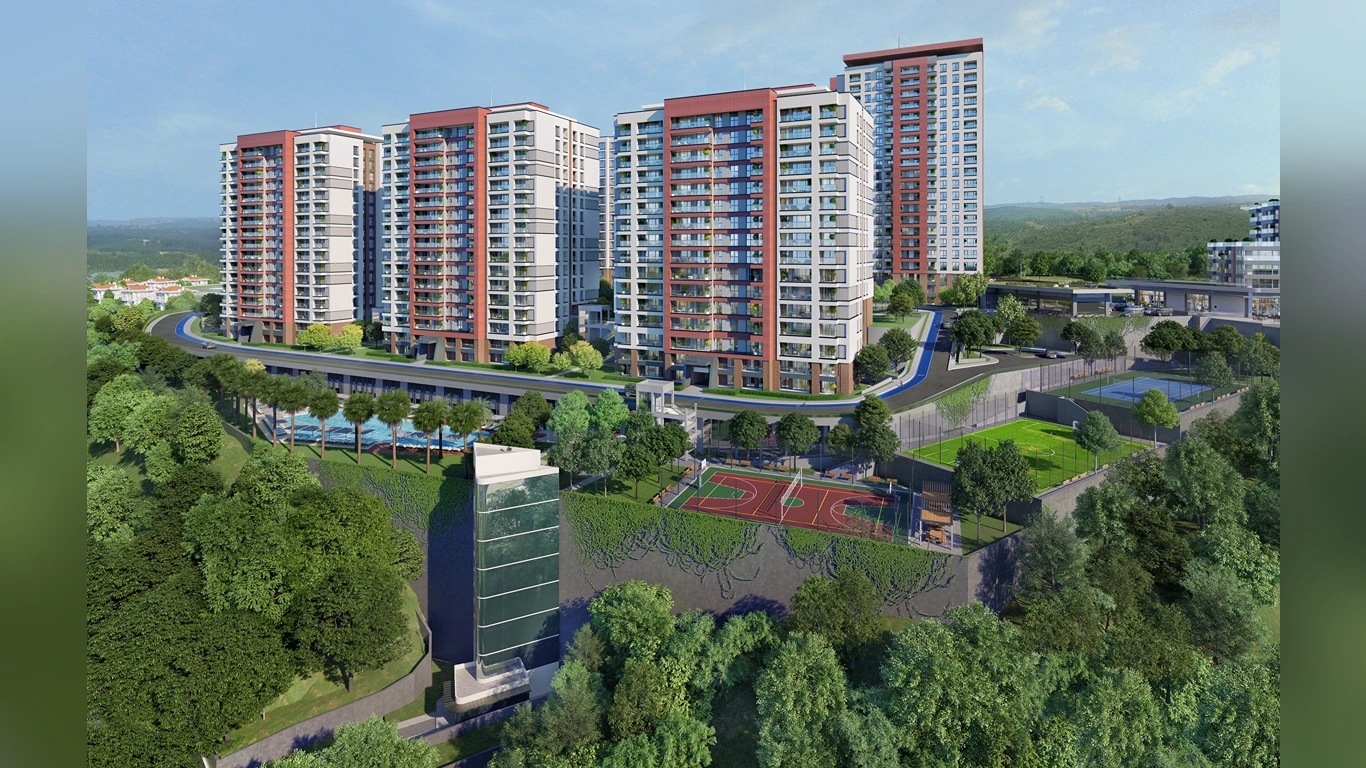
Projects Have same ROI in This Area
.webp)


Have Question Or Suggestion ?
Please Share Your Thought, To Make It Real


