Return on Investment In Turkey
We are providing a financial metric for real estate investors as it helps them to determine the profitability of their real estate investment in Turkey
1,230$
Average Income
923$ - 1,538$
Min Income - Max Income
669,000$
Cash Price
| Year | Annual Increase | Monthly ROI | Annual ROI |
|---|---|---|---|
| 1 | 2.21 % | 1,230$ | 14,766$ |
| 2 | 2.76 % | 1,538$ | 18,457$ |
| 3 | 3.45 % | 1,923$ | 23,071$ |
| 4 | 4.31 % | 2,403$ | 28,839$ |
| 5 | 5.39 % | 3,004$ | 36,049$ |
| 6 | 6.74 % | 3,755$ | 45,061$ |
| 7 | 8.42 % | 4,694$ | 56,326$ |
| 8 | 10.52 % | 5,867$ | 70,408$ |
| 9 | 13.16 % | 7,334$ | 88,010$ |
| 10 | 16.44 % | 9,168$ | 110,012$ |
490,998$ 73%
Total ROI For 10 Years
1,538$
Max Income
669,000$
Cash Price
| Year | Annual Increase | Monthly ROI | Annual ROI |
|---|---|---|---|
| 1 | 2.76 % | 1,538$ | 18,457$ |
| 2 | 3.45 % | 1,923$ | 23,071$ |
| 3 | 4.31 % | 2,403$ | 28,839$ |
| 4 | 5.39 % | 3,004$ | 36,049$ |
| 5 | 6.74 % | 3,755$ | 45,061$ |
| 6 | 8.42 % | 4,694$ | 56,326$ |
| 7 | 10.52 % | 5,867$ | 70,408$ |
| 8 | 13.16 % | 7,334$ | 88,010$ |
| 9 | 16.44 % | 9,168$ | 110,012$ |
| 10 | 20.56 % | 11,460$ | 137,515$ |
613,748$ 91%
Total ROI For 10 Years
923$
Min Income
669,000$
Cash Price
| Year | Annual Increase | Monthly ROI | Annual ROI |
|---|---|---|---|
| 1 | 1.66 % | 923$ | 11,074$ |
| 2 | 2.07 % | 1,154$ | 13,843$ |
| 3 | 2.59 % | 1,442$ | 17,303$ |
| 4 | 3.23 % | 1,802$ | 21,629$ |
| 5 | 4.04 % | 2,253$ | 27,037$ |
| 6 | 5.05 % | 2,816$ | 33,796$ |
| 7 | 6.31 % | 3,520$ | 42,245$ |
| 8 | 7.89 % | 4,400$ | 52,806$ |
| 9 | 9.87 % | 5,501$ | 66,007$ |
| 10 | 12.33 % | 6,876$ | 82,509$ |
368,249$ 55%
Total ROI For 10 Years
District Classification
Rating
b+
Area map
Statistics
Population
381,110
Social Status
Married : 67%
Unmarried : 26%
area
230 Km2
Price Changes Over Last 5 Years
1 Year Change
17.79%
3 Year Change
202%
5 Year Change
253%
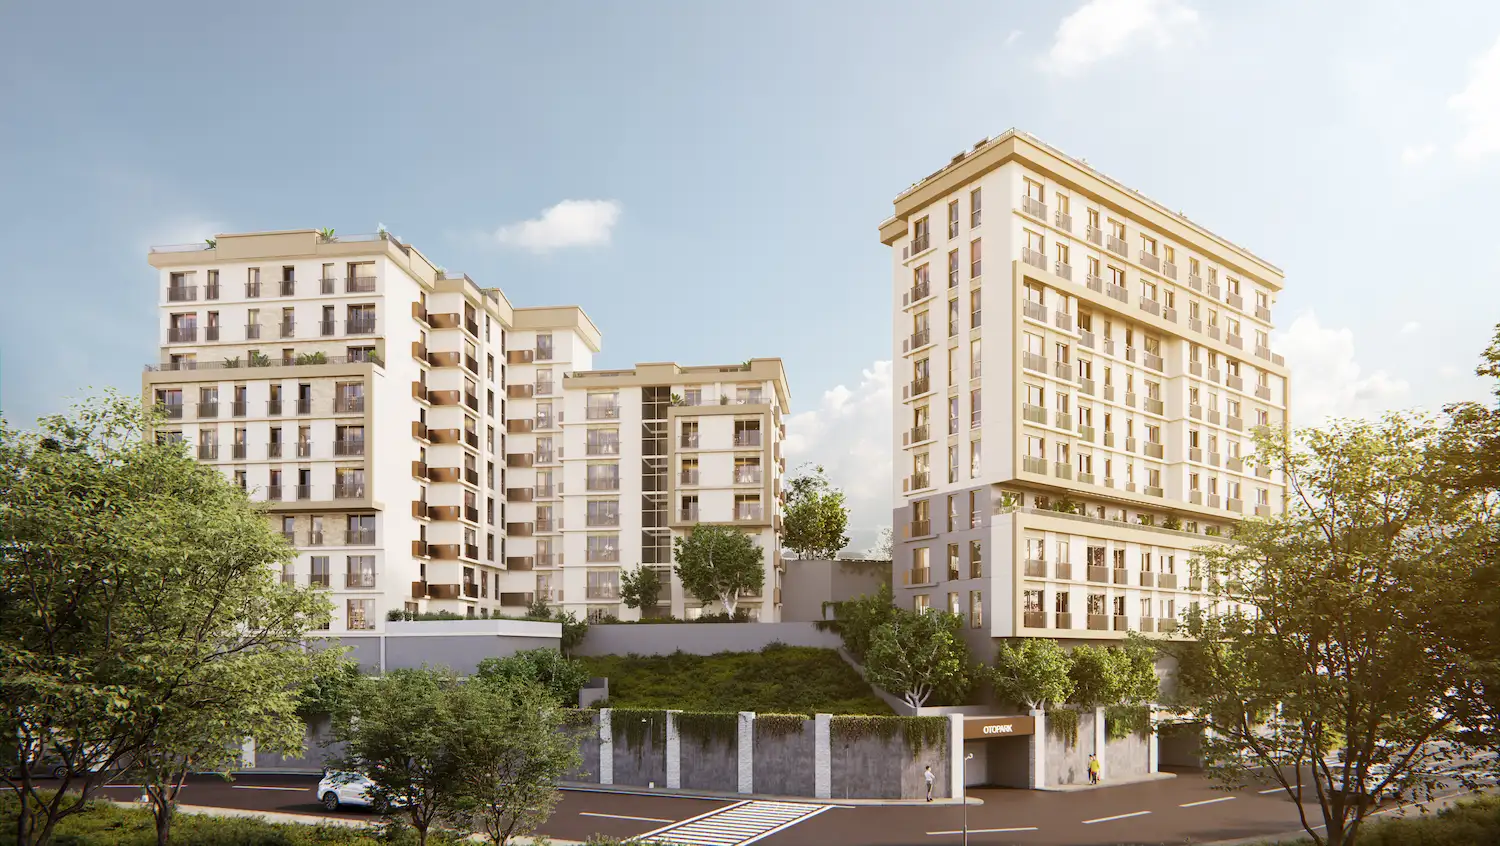
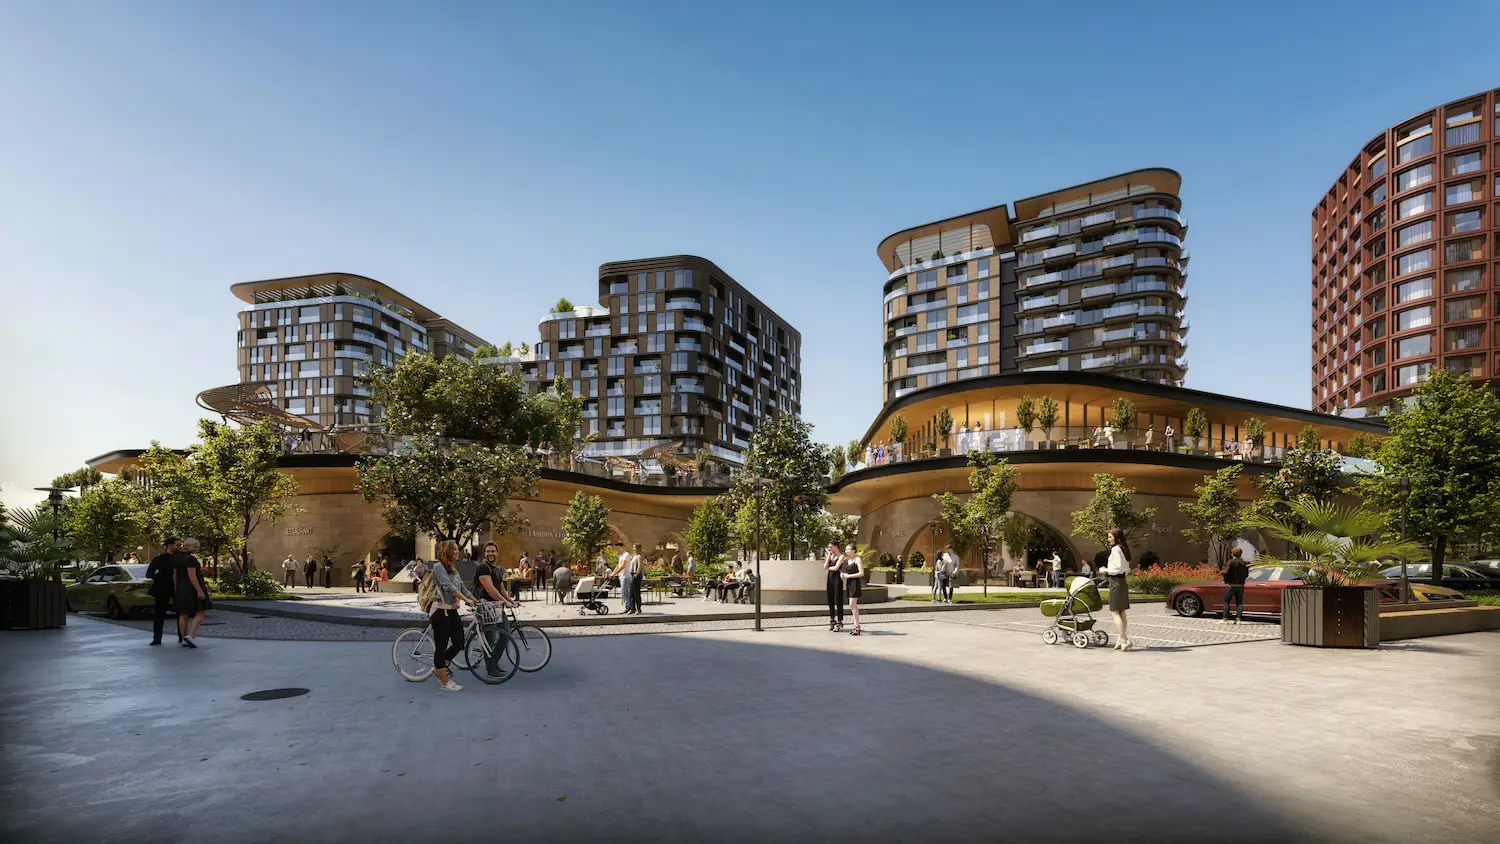
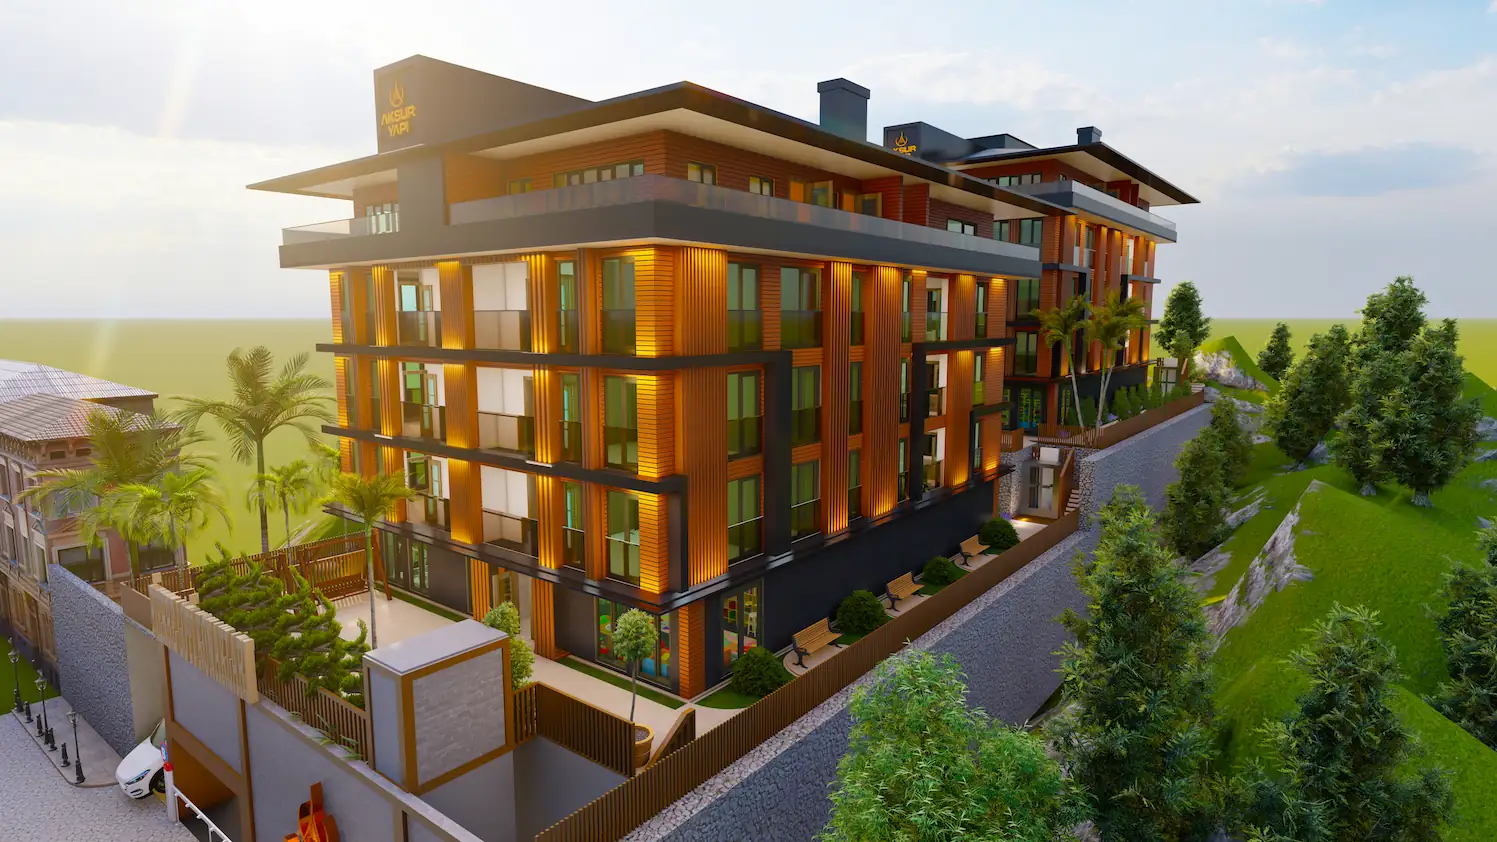
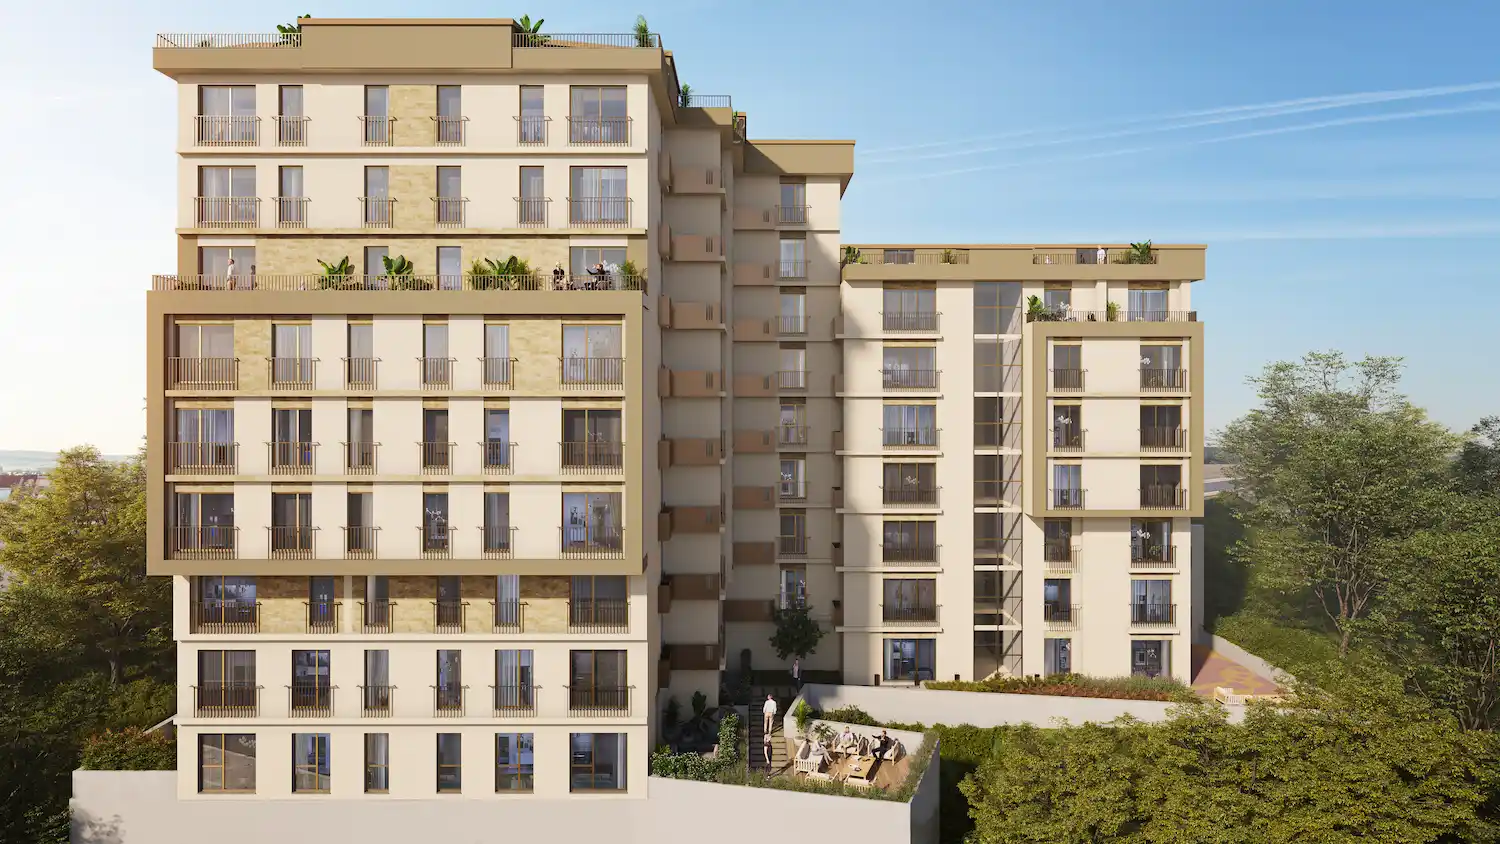
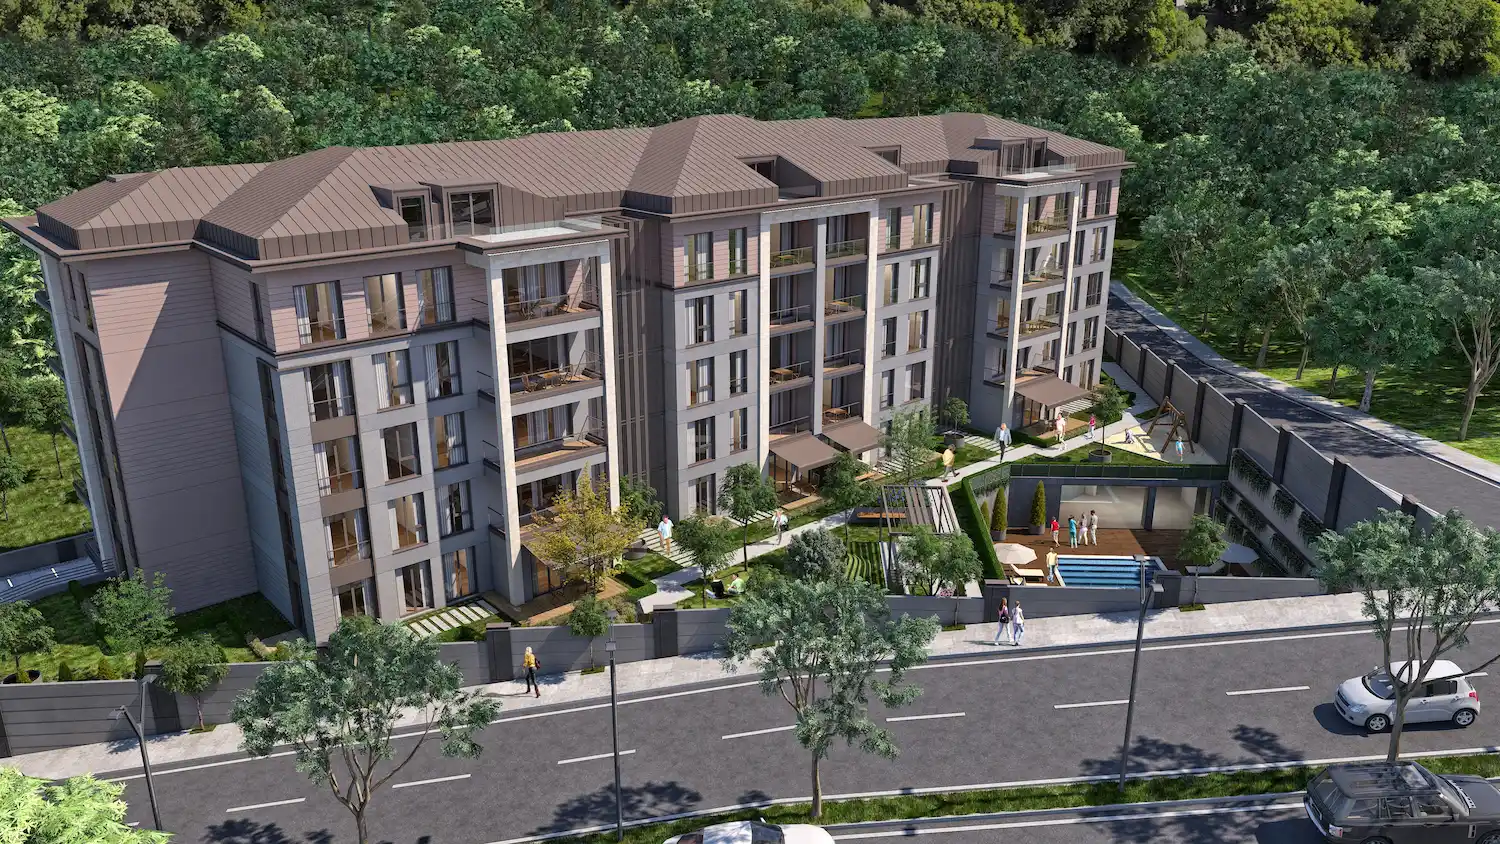
Projects Have same ROI in This Area


Have Question Or Suggestion ?
Please Share Your Thought, To Make It Real


