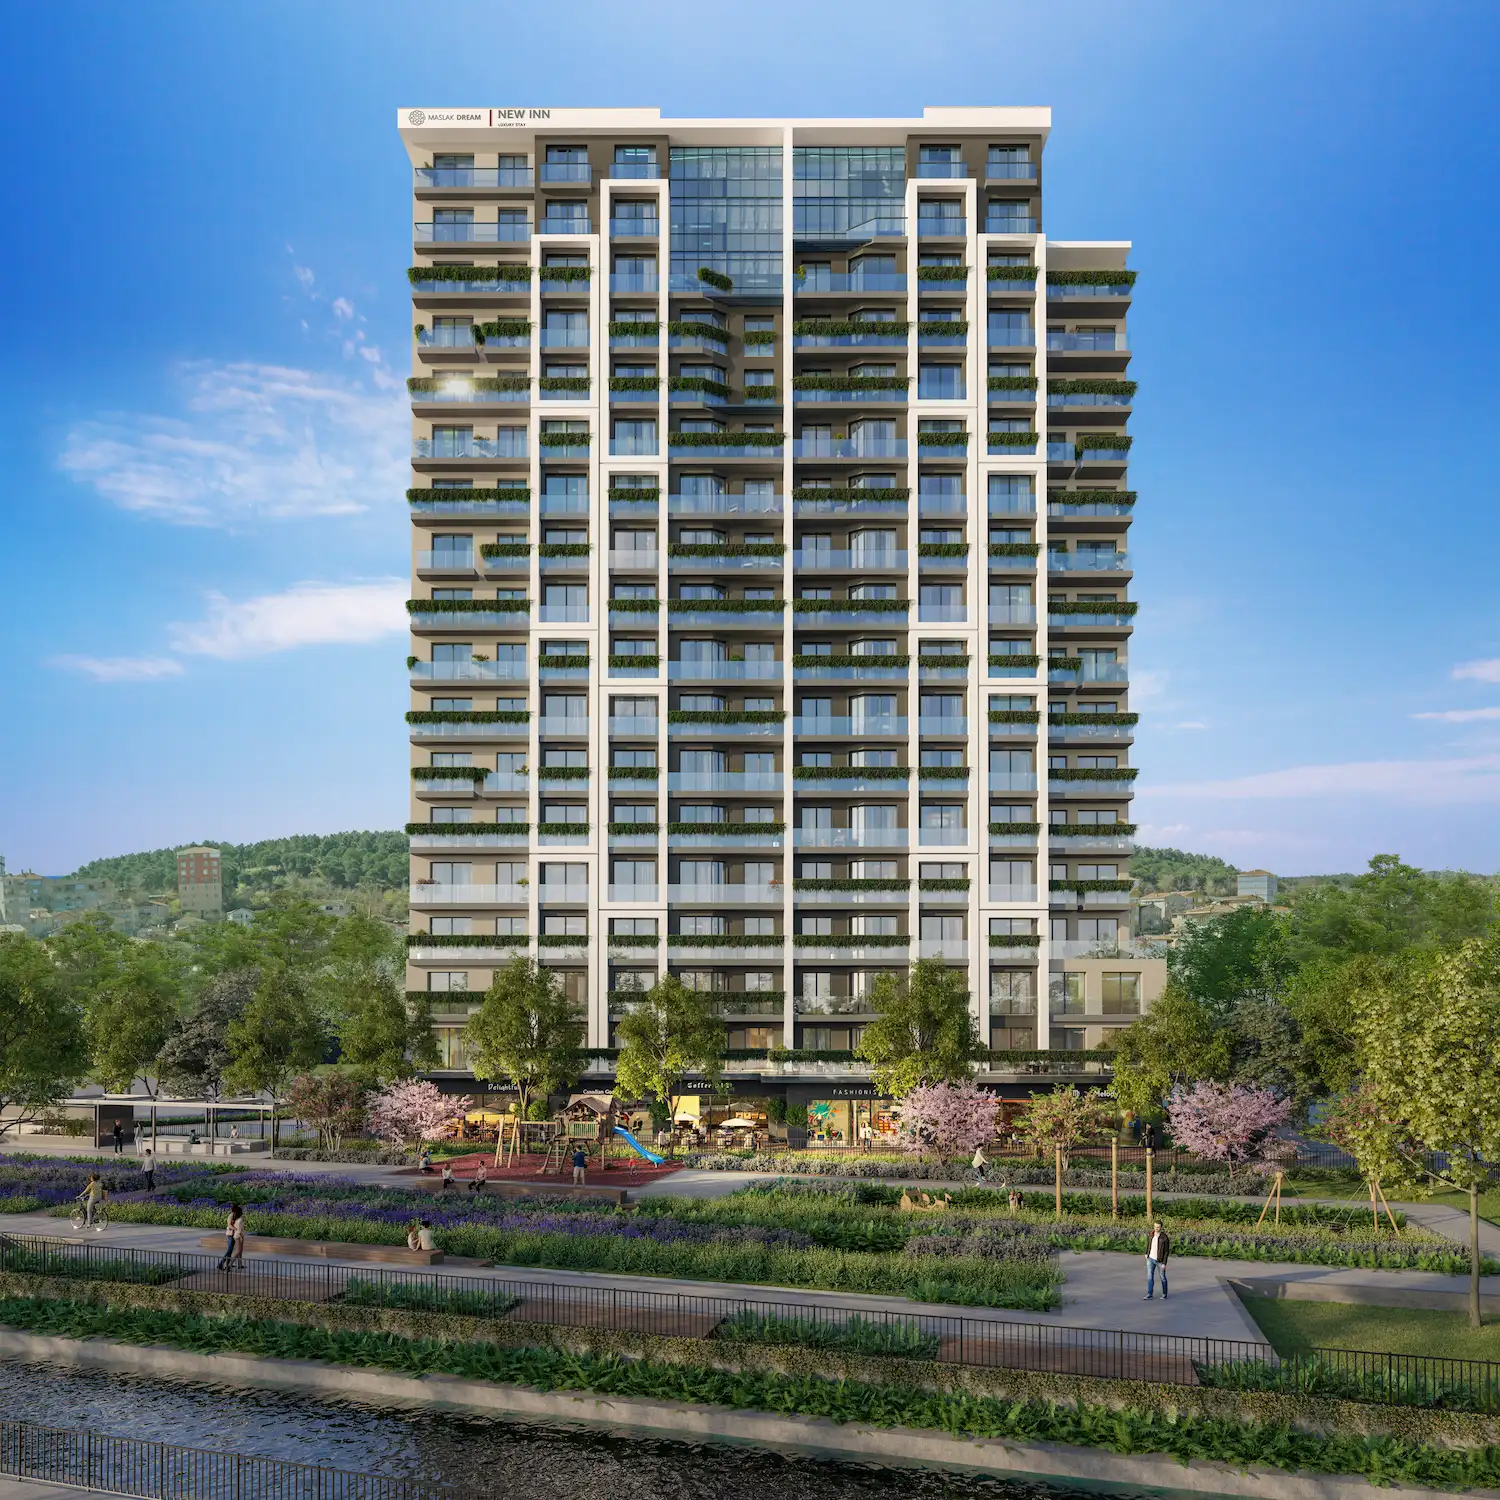
Return on Investment In Turkey
We are providing a financial metric for real estate investors as it helps them to determine the profitability of their real estate investment in Turkey
900$
Average Income
776$ - 1,024$
Min Income - Max Income
100,061$
Cash Price
| Year | Annual Increase | Monthly ROI | Annual ROI |
|---|---|---|---|
| 1 | 10.79 % | 900$ | 10,800$ |
| 2 | 13.49 % | 1,125$ | 13,500$ |
| 3 | 16.86 % | 1,406$ | 16,875$ |
| 4 | 21.08 % | 1,758$ | 21,094$ |
| 5 | 26.35 % | 2,197$ | 26,368$ |
| 6 | 32.94 % | 2,747$ | 32,959$ |
| 7 | 41.17 % | 3,433$ | 41,199$ |
| 8 | 51.47 % | 4,292$ | 51,499$ |
| 9 | 64.33 % | 5,364$ | 64,374$ |
| 10 | 80.42 % | 6,706$ | 80,467$ |
359,136$ 358%
Total ROI For 10 Years
1,024$
Max Income
100,061$
Cash Price
| Year | Annual Increase | Monthly ROI | Annual ROI |
|---|---|---|---|
| 1 | 12.28 % | 1,024$ | 12,290$ |
| 2 | 15.35 % | 1,280$ | 15,362$ |
| 3 | 19.19 % | 1,600$ | 19,203$ |
| 4 | 23.99 % | 2,000$ | 24,004$ |
| 5 | 29.99 % | 2,500$ | 30,004$ |
| 6 | 37.48 % | 3,125$ | 37,506$ |
| 7 | 46.85 % | 3,907$ | 46,882$ |
| 8 | 58.57 % | 4,884$ | 58,602$ |
| 9 | 73.21 % | 6,104$ | 73,253$ |
| 10 | 91.51 % | 7,631$ | 91,566$ |
408,673$ 408%
Total ROI For 10 Years
776$
Min Income
100,061$
Cash Price
| Year | Annual Increase | Monthly ROI | Annual ROI |
|---|---|---|---|
| 1 | 9.30 % | 776$ | 9,310$ |
| 2 | 11.63 % | 970$ | 11,638$ |
| 3 | 14.54 % | 1,212$ | 14,548$ |
| 4 | 18.17 % | 1,515$ | 18,185$ |
| 5 | 22.72 % | 1,894$ | 22,731$ |
| 6 | 28.40 % | 2,368$ | 28,413$ |
| 7 | 35.49 % | 2,960$ | 35,517$ |
| 8 | 44.37 % | 3,700$ | 44,396$ |
| 9 | 55.46 % | 4,625$ | 55,495$ |
| 10 | 69.33 % | 5,781$ | 69,368$ |
309,600$ 309%
Total ROI For 10 Years
District Classification
Rating
a+
Area map
Statistics
Population
10,185
Social Status
Married : 49%
Unmarried : 41%
area
10 Km2
Price Changes Over Last 5 Years
1 Year Change
13.48%
3 Year Change
416%
5 Year Change
448.7%
Projects Have same ROI in This Area
Have Question Or Suggestion ?
Please Share Your Thought, To Make It Real


